|
|
市場調査レポート
商品コード
1275629
Platform-as-a-Service (PaaS) の世界市場 (~2030年):タイプ・導入モード・産業別Platform-as-a-Service Market by Type, Deployment Mode, Sector - Global Forecast to 2030 |
||||||
|
|
|||||||
カスタマイズ可能
|
|||||||


| Platform-as-a-Service (PaaS) の世界市場 (~2030年):タイプ・導入モード・産業別 |
|
出版日: 2023年05月17日
発行: Meticulous Research
ページ情報: 英文 207 Pages
納期: 即納可能
|

- 全表示
- 概要
- 図表
- 目次
Platform-as-a-Service (PaaS) の市場規模は、2023年から2030年にかけて16.8%のCAGRで推移し、2030年には2,275億米ドルの規模に成長すると予測されています。
同市場の成長は、クラウドコンピューティング技術の採用の増加、IoT技術の導入の拡大、市場投入までの時間やアプリケーション開発コストの削減へのニーズの高まりによってもたらされています。AIおよび機械学習技術の普及が進み、動画PaaSの需要が高まっていることも同市場の参入事業者に成長機会をもたらすと予想されています。
当レポートでは、世界のPlatform-as-a-Service (PaaS) の市場を調査し、市場の定義と概要、市場成長への各種影響因子の分析、市場規模の推移・予測、各種区分・地域/主要国別の内訳、競合環境、主要企業のプロファイルなどをまとめています。
目次
第1章 市場の定義・範囲
第2章 調査手法
第3章 エグゼクティブサマリー
第4章 市場洞察
- 市場成長への影響要因
- 市場動向
- ケーススタディ
- ポーターのファイブフォース分析
第5章 世界のPaaS市場の評価:タイプ別
- 概要
- データベースPaaS
- アプリケーションPaaS
- 統合PaaS
- その他
第6章 世界のPaaS市場の評価:組織規模別
- 概要
- 大企業
- 中小企業
第7章 世界のPaaS市場の評価:導入モード別
- 概要
- ハイブリッドPaaS
- パブリックPaaS
- プライベートPaaS
第8章 世界のPaaS市場の評価:産業別
- 概要
- IT・通信
- 小売・eコマース
- BFSI
- ヘルスケア
- 製造
- 政府・防衛
- エネルギー・ユーティリティ
- その他
第9章 PaaS市場の評価:地域別
- 概要
- 北米
- アジア太平洋
- 欧州
- 中東・アフリカ
- ラテンアメリカ
第10章 競合情勢
- 主要な成長戦略
- 競合ベンチマーキング
- 市場シェア分析
第11章 企業プロファイル
- Amazon Web Services, Inc. (Amazon.com, Inc.)
- Microsoft Corporation
- Google LLC (Alphabet, Inc.)
- SAP SE
- Oracle Corporation
- Salesforce, Inc.
- VMware, Inc. (EMC Corporation)
- ServiceNow, Inc.
- Alibaba Group Holding Limited
- Software AG
- Cisco Systems, Inc.
- Mendix Technology BV (Siemens AG)
- Zoho Corporation Pvt. Ltd.
- Atos SE
- IBM Corporation
第12章 付録
List of Tables
- Table 1 Global PaaS Market Size, by Type, 2021-2030 (USD Million)
- Table 2 Global dbPaaS Market Size, by Country/Region, 2021-2030 (USD Million)
- Table 3 Global Application PaaS Market Size, by Country/Region, 2021-2030 (USD Million)
- Table 4 Global Integration PaaS Market Size, by Country/Region, 2021-2030 (USD Million)
- Table 5 Global Other PaaS Market Size, by Country/Region, 2021-2030 (USD Million)
- Table 6 Global PaaS Market, by Organization Size, 2021-2030 (USD Million)
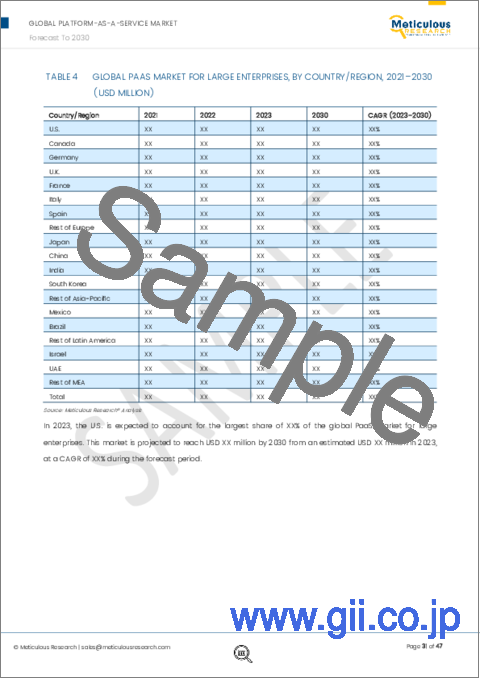
- Table 7 Global PaaS Market for Large Enterprises, by Country/Region, 2021-2030 (USD Million)
- Table 8 Global PaaS Market for SMEs, by Country/Region, 2021-2030 (USD Million)
- Table 9 Global PaaS Market, by Deployment Mode, 2021-2030 (USD Million)
- Table 10 Global Hybrid PaaS Market, by Country/Region, 2021-2030 (USD Million)
- Table 11 Global Public PaaS Market, by Country/Region, 2021-2030 (USD Million)
- Table 12 Global Private PaaS Market, by Country/Region, 2021-2030 (USD Million)
- Table 13 Global PaaS Market, by Sector, 2021-2030 (USD Million)
- Table 14 Global PaaS Market for IT & Telecom, by Country/Region, 2021-2030 (USD Million)
- Table 15 Global PaaS Market for Retail & E-Commerce, by Country/Region, 2021-2030 (USD Million)
- Table 16 Global PaaS Market for BFSI, by Country/Region, 2021-2030 (USD Million)
- Table 17 Global PaaS Market for Healthcare, by Country/Region, 2021-2030 (USD Million)
- Table 18 Global PaaS Market for Manufacturing, by Country/Region, 2021-2030 (USD Million)
- Table 19 Global PaaS Market for Government & Defense, by Country/Region, 2021-2030 (USD Million)
- Table 20 Global PaaS Market for Energy & Utility, by Country/Region, 2021-2030 (USD Million)
- Table 21 Global PaaS Market for Other Sectors, by Country/Region, 2021-2030 (USD Million)
- Table 22 Global PaaS Market, by Country/Region, 2021-2030 (USD Million)
- Table 23 North America: PaaS Market, by Country, 2021-2030 (USD Million)
- Table 24 North America: PaaS Market, by Type, 2021-2030 (USD Million)
- Table 25 North America: PaaS Market, by Organization Size, 2021-2030 (USD Million)
- Table 26 North America: PaaS Market, by Deployment Mode, 2021-2030 (USD Million)
- Table 27 North America: PaaS Market, by Sector, 2021-2030 (USD Million)
- Table 28 U.S.: PaaS Market, by Type, 2021-2030 (USD Million)
- Table 29 U.S.: PaaS Market, by Organization Size, 2021-2030 (USD Million)
- Table 30 U.S.: PaaS Market, by Deployment Mode, 2021-2030 (USD Million)
- Table 31 U.S.: PaaS Market, by Sector, 2021-2030 (USD Million)
- Table 32 Canada: PaaS Market, by Type, 2021-2030 (USD Million)
- Table 33 Canada: PaaS Market, by Organization Size, 2021-2030 (USD Million)
- Table 34 Canada: PaaS Market, by Deployment Mode, 2021-2030 (USD Million)
- Table 35 Canada: PaaS Market, by Sector, 2021-2030 (USD Million)
- Table 36 Asia-Pacific: PaaS Market, by Country/Region, 2021-2030 (USD Million)
- Table 37 Asia-Pacific: PaaS Market, by Type, 2021-2030 (USD Million)
- Table 38 Asia-Pacific: PaaS Market, by Organization Size, 2021-2030 (USD Million)
- Table 39 Asia-Pacific: PaaS Market, by Deployment Mode, 2021-2030 (USD Million)
- Table 40 Asia-Pacific: PaaS Market, by Sector, 2021-2030 (USD Million)
- Table 41 China: PaaS Market, by Type, 2021-2030 (USD Million)
- Table 42 China: PaaS Market, by Organization Size, 2021-2030 (USD Million)
- Table 43 China: PaaS Market, by Deployment Mode, 2021-2030 (USD Million)
- Table 44 China: PaaS Market, by Sector, 2021-2030 (USD Million)
- Table 45 South Korea: PaaS Market, by Type, 2021-2030 (USD Million)
- Table 46 South Korea: PaaS Market, by Organization Size, 2021-2030 (USD Million)
- Table 47 South Korea: PaaS Market, by Deployment Mode, 2021-2030 (USD Million)
- Table 48 South Korea: PaaS Market, by Sector, 2021-2030 (USD Million)
- Table 49 Japan: PaaS Market, by Type, 2021-2030 (USD Million)
- Table 50 Japan: PaaS Market, by Organization Size, 2021-2030 (USD Million)
- Table 51 Japan: PaaS Market, by Deployment Mode, 2021-2030 (USD Million)
- Table 52 Japan: PaaS Market, by Sector, 2021-2030 (USD Million)
- Table 53 India: PaaS Market, by Type, 2021-2030 (USD Million)
- Table 54 India: PaaS Market, by Organization Size, 2021-2030 (USD Million)
- Table 55 India: PaaS Market, by Deployment Mode, 2021-2030 (USD Million)
- Table 56 India: PaaS Market, by Sector, 2021-2030 (USD Million)
- Table 57 Rest of Asia-Pacific: PaaS Market, by Type, 2021-2030 (USD Million)
- Table 58 Rest of Asia-Pacific: PaaS Market, by Organization Size, 2021-2030 (USD Million)
- Table 59 Rest of Asia-Pacific: PaaS Market, by Deployment Mode, 2021-2030 (USD Million)
- Table 60 Rest of Asia-Pacific: PaaS Market, by Sector, 2021-2030 (USD Million)
- Table 61 Europe: PaaS Market, by Country, 2021-2030 (USD Million)
- Table 62 Europe: PaaS Market, by Type, 2021-2030 (USD Million)
- Table 63 Europe: PaaS Market, by Organization Size, 2021-2030 (USD Million)
- Table 64 Europe: PaaS Market, by Deployment Mode, 2021-2030 (USD Million)
- Table 65 Europe: PaaS Market, by Sector, 2021-2030 (USD Million)
- Table 66 Germany: PaaS Market, by Type, 2021-2030 (USD Million)
- Table 67 Germany: PaaS Market, by Organization Size, 2021-2030 (USD Million)
- Table 68 Germany: PaaS Market, by Deployment Mode, 2021-2030 (USD Million)
- Table 69 Germany: PaaS Market, by Sector, 2021-2030 (USD Million)
- Table 70 France: PaaS Market, by Type, 2021-2030 (USD Million)
- Table 71 France: PaaS Market, by Organization Size, 2021-2030 (USD Million)
- Table 72 France: PaaS Market, by Deployment Mode, 2021-2030 (USD Million)
- Table 73 France: PaaS Market, by Sector, 2021-2030 (USD Million)
- Table 74 U.K.: PaaS Market, by Type, 2021-2030 (USD Million)
- Table 75 U.K.: PaaS Market, by Organization Size, 2021-2030 (USD Million)
- Table 76 U.K.: PaaS Market, by Deployment Mode, 2021-2030 (USD Million)
- Table 77 U.K.: PaaS Market, by Sector, 2021-2030 (USD Million)
- Table 78 Italy: PaaS Market, by Type, 2021-2030 (USD Million)
- Table 79 Italy: PaaS Market, by Organization Size, 2021-2030 (USD Million)
- Table 80 Italy: PaaS Market, by Deployment Mode, 2021-2030 (USD Million)
- Table 81 Italy: PaaS Market, by Sector, 2021-2030 (USD Million)
- Table 82 Spain: PaaS Market, by Type, 2021-2030 (USD Million)
- Table 83 Spain: PaaS Market, by Organization Size, 2021-2030 (USD Million)
- Table 84 Spain: PaaS Market, by Deployment Mode, 2021-2030 (USD Million)
- Table 85 Spain: PaaS Market, by Sector, 2021-2030 (USD Million)
- Table 86 Rest of Europe: PaaS Market, by Type, 2021-2030 (USD Million)
- Table 87 Rest of Europe: PaaS Market, by Organization Size, 2021-2030 (USD Million)
- Table 88 Rest of Europe: PaaS Market, by Deployment Mode, 2021-2030 (USD Million)
- Table 89 Rest of Europe: PaaS Market, by Sector, 2021-2030 (USD Million)
- Table 90 MEA: PaaS Market, by Country, 2021-2030 (USD Million)
- Table 91 MEA: PaaS Market, by Type, 2021-2030 (USD Million)
- Table 92 MEA: PaaS Market, by Organization Size, 2021-2030 (USD Million)
- Table 93 MEA: PaaS Market, by Deployment Mode, 2021-2030 (USD Million)
- Table 94 MEA: PaaS Market, by Sector, 2021-2030 (USD Million)
- Table 95 UAE: PaaS Market, by Type, 2021-2030 (USD Million)
- Table 96 UAE: PaaS Market, by Organization Size, 2021-2030 (USD Million)
- Table 97 UAE: PaaS Market, by Deployment Mode, 2021-2030 (USD Million)
- Table 98 UAE: PaaS Market, by Sector, 2021-2030 (USD Million)
- Table 99 Israel: PaaS Market, by Type, 2021-2030 (USD Million)
- Table 100 Israel: PaaS Market, by Organization Size, 2021-2030 (USD Million)
- Table 101 Israel: PaaS Market, by Deployment Mode, 2021-2030 (USD Million)
- Table 102 Israel: PaaS Market, by Sector, 2021-2030 (USD Million)
- Table 103 Rest of MEA: PaaS Market, by Type, 2021-2030 (USD Million)
- Table 104 Rest of MEA: PaaS Market, by Organization Size, 2021-2030 (USD Million)
- Table 105 Rest of MEA: PaaS Market, by Deployment Mode, 2021-2030 (USD Million)
- Table 106 Rest of MEA: PaaS Market, by Sector, 2021-2030 (USD Million)
- Table 107 Latin America: PaaS Market, by Country, 2021-2030 (USD Million)
- Table 108 Latin America: PaaS Market, by Type, 2021-2030 (USD Million)
- Table 109 Latin America: PaaS Market, by Organization Size, 2021-2030 (USD Million)
- Table 110 Latin America: PaaS Market, by Deployment Mode, 2021-2030 (USD Million)
- Table 111 Latin America: PaaS Market, by Sector, 2021-2030 (USD Million)
- Table 112 Brazil: PaaS Market, by Type, 2021-2030 (USD Million)
- Table 113 Brazil: PaaS Market, by Organization Size, 2021-2030 (USD Million)
- Table 114 Brazil: PaaS Market, by Deployment Mode, 2021-2030 (USD Million)
- Table 115 Brazil: PaaS Market, by Sector, 2021-2030 (USD Million)
- Table 116 Mexico: PaaS Market, by Type, 2021-2030 (USD Million)
- Table 117 Mexico: PaaS Market, by Organization Size, 2021-2030 (USD Million)
- Table 118 Mexico: PaaS Market, by Deployment Mode, 2021-2030 (USD Million)
- Table 119 Mexico: PaaS Market, by Sector, 2021-2030 (USD Million)
- Table 120 Rest of Latin America: PaaS Market, by Type, 2021-2030 (USD Million)
- Table 121 Rest of Latin America: PaaS Market, by Organization Size, 2021-2030 (USD Million)
- Table 122 Rest of Latin America: PaaS Market, by Deployment Mode, 2021-2030 (USD Million)
- Table 123 Rest of Latin America: PaaS Market, by Sector, 2021-2030 (USD Million)
- Table 124 Recent Developments, by Company, 2020-2023
List of Figures
- Figure 1 Market Ecosystem
- Figure 2 Key Stakeholders
- Figure 3 Research Process
- Figure 4 Secondary Sources Referenced for this Study
- Figure 5 Primary Research Techniques
- Figure 6 Key Executives Interviewed
- Figure 7 Breakdown of Primary Interviews (Supply Side & Demand Side)
- Figure 8 Market Sizing and Growth Forecast Approach
- Figure 9 Key Insights
- Figure 10 In 2023, the Database PaaS Segment is Expected to Dominate the Global PaaS Market
- Figure 11 In 2023, the Large Enterprises Segment is Expected to Dominate the Global PaaS Market
- Figure 12 In 2023, the Hybrid PaaS Segment is Expected to Dominate the Global PaaS Market
- Figure 13 In 2023, the IT & Telecom Segment is Expected to Dominate the Global PaaS Market
- Figure 14 PaaS Market, by Region
- Figure 15 Impact Analysis of Market Drivers, Restraints, Opportunities, And Challenges
- Figure 16 Porter's Five Forces Analysis
- Figure 17 Global PaaS Market Size, by Type, 2023 Vs. 2030 (USD Million)
- Figure 18 Global PaaS Market, by Organization Size, 2023 Vs. 2030 (USD Million)
- Figure 19 Global PaaS Market, by Deployment Mode, 2023 Vs. 2030 (USD Million)
- Figure 20 Global PaaS Market, by Sector, 2023 Vs. 2030 (USD Million)
- Figure 21 Global PaaS Market, by Geography, 2023 Vs. 2030 (USD Million)
- Figure 22 North America: PaaS Market Snapshot
- Figure 23 Asia-Pacific: PaaS Market Snapshot
- Figure 24 Europe: PaaS Market Snapshot
- Figure 25 MEA: PaaS Market Snapshot
- Figure 26 Latin America: PaaS Market Snapshot
- Figure 27 Key Growth Strategies Adopted by Leading Players, 2020-2023
- Figure 28 Competitive Dashboard: PaaS Market
- Figure 29 Vendor Market Positioning Analysis (2020-2023)
- Figure 30 Market Share Analysis: PaaS Market, 2022
- Figure 31 Microsoft Corporation: Financial Overview (2022)
- Figure 32 Oracle Corporation: Financial Overview (2022)
- Figure 33 Salesforce, Inc.: Financial Overview (2022)
- Figure 34 SAP SE: Financial Overview (2022)
- Figure 35 Amazon.com, Inc.: Financial Overview (2021)
- Figure 36 Alphabet Inc.: Financial Overview (2022)
- Figure 37 VMware, Inc.: Financial Overview (2021)
- Figure 38 ServiceNow, Inc.: Financial Overview (2022)
- Figure 39 Alibaba Group Holding Limited: Financial Overview (2021)
- Figure 40 Software AG: Financial Overview (2021)
- Figure 41 Cisco Systems, Inc.: Financial Overview (2021)
- Figure 42 Atos SE: Financial Overview (2021)
- Figure 43 IBM Corporation: Financial Overview (2022)
Platform-as-a-Service Market by Type (Application PaaS, Integration PaaS, Database PaaS), Deployment Mode (Private, Public, Hybrid), Sector (IT & Telecom, Retail & E-commerce, Healthcare, BFSI, Manufacturing, Government & Defense) - Global Forecast to 2030
The research report titled, 'Platform-as-a-Service Market by Type (Application PaaS, Integration PaaS, Database PaaS), Deployment Mode (Private, Public, Hybrid), Sector (IT & Telecom, Retail & E-commerce, Healthcare, BFSI, Manufacturing, Government & Defense) - Global Forecast to 2030,' provides in-depth analysis of Platform-as-a-Service market across six major geographies and emphasizes on the current market trends, sizes, and shares, recent developments, and forecasts till 2030.
The Platform-as-a-Service market is projected to reach $227.5 billion by 2030, at a CAGR of 16.8% during the forecast period of 2023-2030.
The growth of this market is driven by the increasing adoption of cloud computing technology, the growing implementation of IoT technology, and the rising need to reduce time to market and application development costs. However, data security & privacy concerns restrain the growth of this market. The increasing penetration of Artificial Intelligence (AI) and Machine Learning (ML) technologies and the growing demand for video PaaS are expected to create growth opportunities for the stakeholders in this market. However, cloud migration and vendor lock-in are major challenges for market growth.
Based on type, the Platform-as-a-Service market is segmented into application PaaS (aPaaS), integration PaaS (iPaaS), database PaaS (dbPaaS), and other PaaS. In 2023, the database PaaS segment is expected to account for the largest share of the global Platform-as-a-Service market. This segment is also expected to register the highest CAGR during the forecast period. The growth of this segment is attributed to the benefits of dbPaaS, such as improved database management processes, reduced cost and complexity of building and maintaining databases, and accelerated time to market. It can also help organizations enhance the scalability and reliability of their databases by providing access to cloud-based infrastructure and advanced features.
Based on deployment mode, the market is segmented into private PaaS, public PaaS, and hybrid PaaS. In 2023, the hybrid PaaS segment is expected to account for the largest share of the global PaaS market. The large market share of this segment is attributed to the possibility of organizations deploying and managing applications on public and private cloud infrastructure and the benefits of both deployment models, private and public. Further, this segment is also projected to register the highest CAGR during the forecast period. Also, when an organization plans to expand its geographic reach or launch its product in the market quickly, hybrid PaaS is the preferred choice of clients.
Based on organization size, the market is segmented into large enterprises and small & medium enterprises (SMEs). In 2023, the large enterprises segment is expected to account for the largest share of the global PaaS market. The large market share of this segment is attributed to the higher capital availability to invest in cloud computing and the rapid adoption of cloud computing by large enterprises. However, the SMEs segment is projected to register the highest growth rate during the forecast period. The impact of COVID-19 and the benefits of customized pricing models such as pay-per-use, spot pricing, reserved instance pricing, and volume discount (Tier-based pricing) are expected to drive the demand for PaaS from SMEs.
Based on sector, the market is segmented into BFSI, retail & e-commerce, IT & telecom, manufacturing, healthcare, energy & utility, government & defense, and other sectors. In 2023, the IT & telecom sector is expected to account for the largest share of the global PaaS market. The large market share of this segment is attributed to the increasing adoption of PaaS by IT enterprises to develop applications, as well as the expansion of 5G networks. Further, the same sector is projected to register the highest CAGR during the forecast period due to the rapid adoption of cloud technologies and the growing need for modernizing IT & telecom applications, 5G networks, and improving customer interactions.
Geographic Review:
Based on geography, the global PaaS market is segmented into North America, Europe, Asia-Pacific, Latin America, and Middle East & Africa (MEA), with a further analysis of major countries in these regions. In 2023, North America is expected to account for the largest share of the global PaaS market. The large share of this market is mainly attributed to the large number of cloud service providers in the region and the growing adoption of cloud services among the regional industries. However, Asia-Pacific is slated to register the highest CAGR during the forecast period. The rapid growth of IT infrastructure across countries like India, China, and South Korea, the growing adoption of advanced application technology, and the awareness about the importance of PaaS among SMEs are creating huge opportunities for the PaaS market in Asia-Pacific.
Key Players:
The key players operating in the global PaaS market are Microsoft Corporation (U.S.), Oracle Corporation (U.S.), Salesforce, Inc. (U.S.), SAP SE (Germany), Amazon Web Services, Inc. (U.S.), Google LLC (U.S.), Mendix Technology BV (Netherlands), Zoho Corporation Pvt. Ltd. (India), VMware, Inc. (U.S.), ServiceNow, Inc. (U.S.), Alibaba Group Holding Limited (China), Software AG (Germany), Cisco Systems, Inc. (U.S.), Atos SE (France), and IBM Corporation (U.S.), among others.
Key questions answered in the report:
- Which are the high-growth market segments in terms of type, deployment mode, organization size, sector, and country/region?
- What is the historical market for Platform-as-a-Service across the globe?
- What are the market forecasts and estimates from 2023-2030?
- What are the major drivers, restraints, opportunities, challenges, and trends in the global Platform-as-a-Service market?
- Who are the major players in the Platform-as-a-Service market, and what are their market shares?
- How is the competitive landscape?
- What are the recent developments in the Platform-as-a-Service market?
- What are the different growth strategies adopted by the major players in the Platform-as-a-Service market?
- What are the geographical trends and high-growth countries?
- Who are the local emerging players in the Platform-as-a-Service market and how do they compete with other players?
Scope of the Report:
Platform-as-a-Service Market, by Type
- Application PaaS
- Integration PaaS
- Database PaaS
- Other PaaS
Platform-as-a-Service Market, by Deployment Mode
- Private PaaS
- Public PaaS
- Hybrid PaaS
Platform-as-a-Service Market, by Organization Size
- Small & Medium Enterprises (SMEs)
- Large Enterprises
Platform-as-a-Service Market, by Sector
- IT & Telecom
- Retail & E-commerce
- BFSI
- Healthcare
- Manufacturing
- Energy & Utility
- Government & Defense
- Other Sectors
Platform-as-a-Service Market, by Geography
- North America
- U.S.
- Canada
- Europe
- Germany
- U.K.
- France
- Italy
- Spain
- Rest of Europe
- Asia-Pacific
- China
- India
- Japan
- South Korea
- Rest of Asia-Pacific
- Latin America
- Brazil
- Mexico
- Rest of Latin America
- Middle East
- Israel
- UAE
- Rest of Middle East
TABLE OF CONTENTS
1. Introduction
- 1.1. Currency and Limitations
- 1.1.1. Currency
- 1.1.2. Limitations
2. Research Methodology
- 2.1. Research Approach
- 2.2. Process of Data Collection And Validation
- 2.2.1. Secondary Research
- 2.2.2. Primary Research/Interviews with Key Opinion Leaders of The Industry
- 2.3. Market Sizing And Forecast
- 2.3.1. Market Size Estimation Approach
- 2.3.2. Growth Forecast Approach
- 2.4. Assumptions for the Study
3. Executive Summary
4. Market Insights
- 4.1. Introduction
- 4.2. Factors Affecting Market Growth
- 4.3. Market Trends
- 4.4. Case Studies
- 4.5. Porter's Five Forces Analysis
- 4.5.1. Bargaining Power of Buyers
- 4.5.2. Bargaining Power of Suppliers
- 4.5.3. Threat of Substitutes
- 4.5.4. Threat of New Entrants
- 4.5.5. Degree of Competition
5. Global PaaS Market Assessment-by Type
- 5.1. Overview
- 5.2. Database PaaS
- 5.3. Application PaaS
- 5.4. Integration PaaS
- 5.5. Other PaaS
6. Global PaaS Market Assessment-by Organization Size
- 6.1. Overview
- 6.2. Large Enterprises
- 6.3. Small & Medium Enterprises (SMEs)
7. Global PaaS Market Assessment-by Deployment Mode
- 7.1. Overview
- 7.2. Hybrid PaaS
- 7.3. Public PaaS
- 7.4. Private PaaS
8. Global PaaS Market Assessment-by Sector
- 8.1. Overview
- 8.2. IT & Telecom
- 8.3. Retail & E-Commerce
- 8.4. BFSI
- 8.5. Healthcare
- 8.6. Manufacturing
- 8.7. Government & Defense
- 8.8. Energy & Utility
- 8.9. Other Sectors
9. PaaS Market Assessment-by Geography
- 9.1. Overview
- 9.2. North America
- 9.2.1. U.S.
- 9.2.2. Canada
- 9.3. Asia-Pacific
- 9.3.1. China
- 9.3.2. South Korea
- 9.3.3. Japan
- 9.3.4. India
- 9.3.5. Rest of Asia-Pacific
- 9.4. Europe
- 9.4.1. Germany
- 9.4.2. France
- 9.4.3. U.K.
- 9.4.4. Italy
- 9.4.5. Spain
- 9.4.6. Rest of Europe
- 9.5. Middle East & Africa (MEA)
- 9.5.1. UAE
- 9.5.2. Israel
- 9.5.3. Rest of MEA
- 9.6. Latin America
- 9.6.1. Brazil
- 9.6.2. Mexico
- 9.6.3. Rest of Latin America
10. Competitive Landscape
- 10.1. Introduction
- 10.2. Key Growth Strategies
- 10.3. Competitive Benchmarking
- 10.3.1. Industry Leaders
- 10.3.2. Market Differentiator
- 10.3.3. Vanguards
- 10.3.4. Emerging Companies
- 10.4. Market Share Analysis (2022)
- 10.4.1. Amazon Web Services, Inc.
- 10.4.2. Microsoft Corporation
- 10.4.3. Google LLC
- 10.4.4. SAP SE
11. Company Profiles
- 11.1. Amazon Web Services, Inc. (Amazon.com, Inc.)
- 11.1.1. Business Overview
- 11.1.2. Financial Overview
- 11.1.3. Service Portfolio
- 11.1.4. Strategic Developments
- 11.2. Microsoft Corporation
- 11.2.1. Business Overview
- 11.2.2. Financial Overview
- 11.2.3. Service Portfolio
- 11.2.4. Strategic Developments
- 11.3. Google LLC (Alphabet, Inc.)
- 11.3.1. Business Overview
- 11.3.2. Financial Overview
- 11.3.3. Service Portfolio
- 11.3.4. Strategic Developments
- 11.4. SAP SE
- 11.4.1. Business Overview
- 11.4.2. Financial Overview
- 11.4.3. Service Portfolio
- 11.4.4. Strategic Developments
- 11.5. Oracle Corporation
- 11.5.1. Business Overview
- 11.5.2. Financial Overview
- 11.5.3. Service Portfolio
- 11.5.4. Strategic Developments
- 11.6. Salesforce, Inc.
- 11.6.1. Business Overview
- 11.6.2. Financial Overview
- 11.6.3. Service Portfolio
- 11.6.4. Strategic Developments
- 11.7. VMware, Inc. (EMC Corporation)
- 11.7.1. Business Overview
- 11.7.2. Financial Overview
- 11.7.3. Service Portfolio
- 11.7.4. Strategic Developments
- 11.8. ServiceNow, Inc.
- 11.8.1. Business Overview
- 11.8.2. Financial Overview
- 11.8.3. Service Portfolio
- 11.8.4. Strategic Developments
- 11.9. Alibaba Group Holding Limited
- 11.9.1. Business Overview
- 11.9.2. Financial Overview
- 11.9.3. Service Portfolio
- 11.9.4. Strategic Developments
- 11.10. Software AG
- 11.10.1. Business Overview
- 11.10.2. Financial Overview
- 11.10.3. Service Portfolio
- 11.10.4. Strategic Developments
- 11.11. Cisco Systems, Inc.
- 11.11.1. Business Overview
- 11.11.2. Financial Overview
- 11.11.3. Service Portfolio
- 11.11.4. Strategic Developments
- 11.12. Mendix Technology BV (Siemens AG)
- 11.12.1. Business Overview
- 11.12.2. Service Portfolio
- 11.13. Zoho Corporation Pvt. Ltd.
- 11.13.1. Business Overview
- 11.13.2. Service Portfolio
- 11.13.3. Strategic Developments
- 11.14. Atos SE
- 11.14.1. Business Overview
- 11.14.2. Financial Overview
- 11.14.3. Service Portfolio
- 11.14.4. Strategic Developments
- 11.15. IBM Corporation
- 11.15.1. Business Overview
- 11.15.2. Financial Overview
- 11.15.3. Service Portfolio
- 11.15.4. Strategic Developments
12. Appendix
- 12.1. Related Report
- 12.2. Available Customization