|
|
市場調査レポート
商品コード
1277028
スマート商業ビルにおけるIoT (モノのインターネット):市場規模計測と競合情勢 (2023年~2028年)The Internet of Things in Smart Commercial Buildings 2023 to 2028: Market Sizing & Competitive Landscape |
||||||
|
|
|||||||
|
|||||||


| スマート商業ビルにおけるIoT (モノのインターネット):市場規模計測と競合情勢 (2023年~2028年) |
|
出版日: 2023年05月30日
発行: Memoori
ページ情報: 英文 236 Pages; 26 Charts & Tables
納期: 即日から翌営業日
|

- 全表示
- 概要
- 図表
- 目次
本レポートは、世界の商業建築物向けIoTの市場規模 (2028年まで) や競合情勢に関する最新の分析結果を取りまとめてお届けいたします。
当レポートでは、商業用不動産市場に焦点を絞り、IoT市場の市場規模・用途・機会や、主な促進・阻害要因について包括的に評価しています。
主な質問
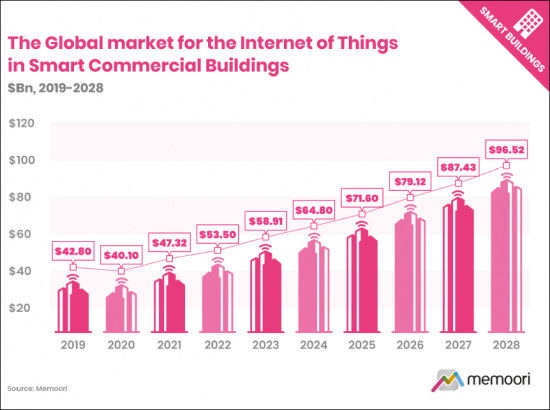
- スマート商業ビル (BIoT) 向けのIoT (モノのインターネット) の市場規模はどれだけか?:最新の分析結果では、2022年のBIoT市場は535億米ドルに成長し、2021年から13%の上昇を示しました。予想よりも遅い全体的な景気回復、チップセットの不足、サプライチェーンの混乱など、いくつかの要因から、業績は13.8%という当社の予測からわずかに下回りました。BIoTの市場規模は、2022年から2028年の間にCAGR10.33%のCAGRで成長し、965億米ドルに達すると予測されています。
- BIoT市場導入の促進要因は?:不動産関係者は、資産の持続可能性を高めるだけでなく、その業績を向上させ、賃料や利回りを向上させるために投資を行っています。エネルギーコストの上昇は今後も続くと予想されるため、エネルギー効率の高い技術や持続可能なソリューションへの注力は、多くの企業にとって重要な優先事項であり続けると思われます。
- BIoT市場が直面する課題と障壁とは?:サイバーセキュリティは、サイバー攻撃を受けやすくなっているスマートビルディングの増加にとって極めて重要な検討事項です。スマートビルのシステムや機器には動的なパッチ適用機能がないことが多く、施設管理チームはサイバーセキュリティを管理するのに必要なITスキルが不足している場合があります。
建築物業界は、持続可能な開発とエネルギー消費の削減に向けて前進しています。The EIAの2018年CBECS消費・支出調査によると、商業建築物の床面積1平方フィートあたりのエネルギー消費量は、2012年に比べて2018年は12%減少しました。しかし、建築物やビル建設は、世界のエネルギー消費の3分の1、CO2排出量の40%近くを占めているため、建築物部門は将来の持続可能な開発に必要な目標にまだ達していません。
2050年までにネットゼロを達成するためには、建築物の所有者と運営者は、新築と改修において努力を重ねる必要があります。IEAは現在1%未満である改修率を、2030年までに毎年2.5%増加させるよう求めています。
当レポートで言及されたIoT関連企業: (一部)
|
|
目次
序文
エグゼクティブサマリー
第1章 イントロダクション
- スマート商業建築物向けIoT市場の概要
- BIOTのサプライチェーン
第2章 市場規模計測と地域分析
- 世界のBIoT市場の予測
- 市場収益:ハードウェア別・ソフトウェア別・サービス別
- 市場収益:業種別
- 市場収益:用途別
- BIoT市場の分析:地域別
- 地域別の比較
- 北米
- ラテンアメリカ
- アジア太平洋
- 欧州
- 中東・アフリカ
第3章 BIoT市場の用途
- セキュリティ・アクセス制御
- ビデオ監視
- ビデオ管理システム (VMS)
- VSaaS (サービスとしてのビデオ監視)
- アクセス制御
- セキュリティとアクセス制御のためのAIアプリケーション
- エネルギー管理と環境制御
- エネルギー管理におけるIoTとAIの役割
- リアルタイムのエネルギー追跡・分析
- HVACの最適化
- 優先順位のバランスをとり、複数のシステムを統合する
- エネルギー管理と環境制御の将来性
- グリッドインタラクティブな建築物
- デマンドレスポンスと負荷管理
- 需要サイドの管理戦略
- 負荷制限とピークシェービング
- 再生可能エネルギーとPEVの統合
- グリッドインタラクティブビルディングの主要企業
- スマート運用・整備
- 空間・占有率・人の移動
- 大気質
- 衛生・健康・ウェルネス
- スマート照明
- テナントと職場での経験
- 火災と安全
- 廃棄物と水の管理
- 水管理
- 廃棄物管理
- デジタルツイン
- デジタルツインの定義
- デジタルツイン・BIM (建築物情報モデリング)・IoTの関係
- デジタルツインの3Dモデリング
- 課題と批判
- デジタルツインを成功させるための前提条件
- 市場の認識と導入率
- デジタルツインのベンダー
第4章 スマートビルディング向けIoTのプラットフォーム
- IoTプラットフォーム
- BIoTプラットフォームのエコシステム
- BIoTプラットフォームの製品
第5章 市場の展望と利用事例:市場分野別
- 商業オフィス
- 小売業
- 小売業の業績
- 小売業の将来性
- 小売業でのIoTの機会
- ホスピタリティ
- ホテル
- レストラン・フードサービス
- データセンター
- その他の業種
- 輸送
- 公共の集会/会場
- 倉庫
- 小規模な建築物
第6章 BIoT市場 - 普及の促進要因
- 経済面・ビジネス面での促進要因
- 運用コストの削減と効率の向上
- テナントの優先順位と資産価値
- 職場の要求と期待
- 技術面での促進要因
- 技術コスト
- データ量とアクセシビリティ
- 新技術
- エネルギー効率と持続可能性の原動力
- 商業建築物部門における持続可能性の実績
- 改修の重要性
- 企業の姿勢・投資・取り組み
- エネルギーコストに関連する要因
- ESGレポート
- IoTの悪影響への対応
- 健康面・福祉面での促進要因
- 政府の政策と規制
- 環境および持続可能性に関する規制
- 政府の奨励金と補助金
- IoT、データ、サイバーセキュリティ規制
- その他の投資面・政策面での促進要因
- 規格と認証
- 建築基準・認証情勢の変動
- スマート・デジタル接続
- 持続可能性、エネルギー、ESGの実績
- 健康と福祉
- サイバーセキュリティの基準と要件
第7章 BIoT市場:課題と障壁
- 技術面での課題
- サイバーセキュリティ
- サイバー保険
- データのプライバシー
- システムの複雑性と相互運用性
- データ関連の課題
- 変化への抵抗と業界の進化
- CRE業界における変化への抵抗
- 業界の進化と移行の促進要因
- リーダーシップ・試運転・調達
- IoTプロジェクトのリーダーと意思決定者
- ライフサイクルの構築
- 試運転、調達、関係者の調整
- 試運転と調達の課題
- 建物のライフサイクル全体にわたるステークホルダーの優先事項
- 関係者の調整の達成
- IoT技術と建物設計の効果的な統合
- IT・OTの利害関係者
- 家主/テナントごとのインセンティブ
- コストとビジネスケースの動向
- IoTプロジェクトのコスト
- ビジネスケースの動向
第8章 競合情勢
List of Charts and Figures
- Fig 1.1 - The Internet of Things in Smart Commercial Buildings 2023 v5.1
- Fig 1.2 - The BIoT Supply Chain
- Fig 2.1 - The Global Market for the Internet of Things in Smart Commercial Buildings, $Bn 2019-2028
- Fig 2.2 - The Global Market for the Internet of Things in Smart Commercial Buildings, Breakdown by Hardware, Software, & Services, $Bn 2022-2028
- Fig 2.3 - Market Breakdown by Hardware, Software & Services, Market Size $Bn, % of Total Market
- Fig 2.4 - The Market for the Internet of Things in Smart Commercial Buildings Market by Vertical, $Bn 2022 & 2028
- Fig 2.5 - The Market for the Internet of Things in Smart Commercial Buildings Market by Application, $Bn 2022 & 2028
- Fig 2.6 - Regional Growth Indicators
- Fig 2.7 - The Market for the Internet of Things in Smart Commercial Buildings Market by Region 2022 to 2028, % of Global Market
- Fig 2.8 - BIoT Related Patent Applications by Country, May 2023
- Fig 2.9 - Percentage Share of Academic Publications, Selected Technologies
- Fig 2.10 - Frontier Technology Readiness by Region
- Fig 2.11 - The Market for the Internet of Things in Smart Commercial Buildings North America, $Bn 2022 - 2028
- Fig 2.12 - The Market for the Internet of Things in Smart Commercial Buildings Latin America, $Bn 2022 - 2028
- Fig 2.13 - The Market for the Internet of Things in Smart Commercial Buildings Asia Pacific, $Bn 2022 - 2028
- Fig 2.14 - The Market for the Internet of Things in Smart Commercial Buildings Europe, $Bn 2022 - 2028
- Fig 2.15 - The Market for the Internet of Things in Smart Commercial Buildings Middle East & Africa, $Bn 2022 - 2028
- Fig 4.1 - Typical IoT Platform Functionality
- Fig 6.1 - Price Inflation for Information Technology, Hardware & Services since 1988
- Fig 6.2 - Non-Residential Building Sector CO2 Emissions 2010 - 2030
- Fig 6.3 - Buildings Share of Global Final Energy & CO2 Emissions 2021
- Fig 6.4 - Average Electricity & Gas Prices for Non-Household Consumers
- Fig 7.1 - Building Component Life Cycles
- Fig 7.2 - Aligning Stakeholder Priorities Across the Building Life Cycle
This Report is a new 2023 Study which Makes an Objective Assessment of the Commercial Building IoT Market Size & Competitive Landscape to 2028
Our new report focuses on market sizing, applications and opportunities in the Internet of Things market, as well as a comprehensive evaluation of the drivers and barriers to adoption that are specific to the Commercial Real Estate sector.
New for 2023, it INCLUDES at no extra cost, a spreadsheet containing the data from the report AND high-resolution presentation charts showing the key findings. It is the second instalment of a two-part series, with the first report (published last month) covering IoT Device Projections, Adoption & Meta-Trends Analysis. These reports are included in our 2023 Premium Subscription Service.
KEY QUESTIONS ADDRESSED:
- What is the Size of the Internet of Things Market in Smart Commercial Buildings (BIoT)? Our latest analysis indicates that the BIoT market grew to $53.5 billion in 2022, representing a 13% rise from 2021. Performance was slightly down from our forecast of 13.8% for the year due to several factors, including a slower-than-anticipated overall economic recovery, a lack of chipsets, and disrupted supply chains. Memoori forecasts that the BIoT market size will grow at a CAGR of 10.33% to $96.5 billion between 2022 and 2028.
- What is Driving BIoT Market Adoption? Real estate stakeholders are investing not only to improve the sustainability credentials of their assets but also to enhance their performance, resulting in better rent and yields. As rising energy costs are expected to continue increasing, the focus on energy-efficient technologies and sustainable solutions is likely to remain a significant priority for many companies.
- What Challenges & Barriers Does the BIoT Market Face? Cybersecurity is a crucial consideration for the growing number of smart buildings, which are increasingly susceptible to cyber attacks. Smart building systems and devices often lack dynamic patching capabilities, and facilities management teams may lack the IT skills required to manage cybersecurity.
The building sector is making progress towards sustainable development and reducing energy consumption. The EIA's 2018 CBECS consumption and expenditures survey found that commercial buildings consumed 12% less energy per square foot of floorspace in 2018 than in 2012. However, the building sector still falls short of the targets required for sustainable future development, as buildings and building construction contribute to one-third of global energy consumption and almost 40% of CO2 emissions.
To achieve net zero by 2050, building owners and operators must redouble their efforts in new construction and retrofits. The IEA is now calling for an increase in retrofit rates of 2.5% annually by 2030, up from less than 1% today.
WITHIN ITS 236 PAGES AND 26 CHARTS AND TABLES, THE REPORT FILTERS OUT ALL THE KEY FACTS AND DRAWS CONCLUSIONS, SO YOU CAN UNDERSTAND EXACTLY WHAT IS SHAPING THE FUTURE OF THIS GLOBAL IOT MARKET
- The Building Internet of Things market is complex and multifaceted, involving a wide range of players from traditional building automation companies to specialized manufacturers, ICT vendors, property firms, and software vendors offering middleware, platforms, and cloud-based data analytics services. While some companies offer end-to-end BIoT solutions, others specialize in specific areas such as data intelligence, automation, or energy optimization and analytics.
- The smart building startup landscape is also expanding rapidly, with a 20% increase in the number of new entrants founded since 2021. Consolidation is expected in the wider platforms space, but there remain considerable market opportunities for cloud-based software offerings for specialist applications or vertical markets.
- While the level of fragmentation in the BIoT market can act as a source of confusion and frustration for buyers, leading platform solution providers are beginning to emerge, and the user base seems likely to coalesce around a more limited number of platform providers.
This report provides valuable information to companies so they can improve their strategic planning exercises AND look at the potential for developing their business through mergers, acquisitions and alliances.
WHO SHOULD BUY THIS REPORT?
The information contained in this report will be of value to all those engaged in managing, operating and investing in commercial smart buildings (and their advisers) around the world. In particular, those wishing to understand exactly how the Internet of Things is impacting commercial real estate will find it most useful.
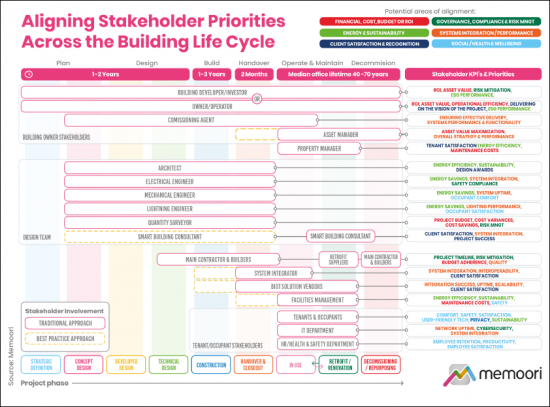
ALIGNING STAKEHOLDER PRIORITIES
The infographic below illustrates key stakeholders in a smart building project, their priorities and KPIs, and the project phases they might be involved in under traditional and best practice approaches. Encouraging collaboration, communication, and standardized practices among stakeholders can help bridge the gap and foster innovation.
The integration of Internet of Things technology into building design is a complex process that requires coordination and alignment among all parties involved. A comprehensive and cohesive design approach involving key stakeholders from the earliest stages leads to improved decision-making and better outcomes .
Internet of Things Companies Mentioned INCLUDE: (but NOT limited to)
|
|
Table of Contents
Preface
The Executive Summary
1. Introduction
- 1.1. Overview of the IoT Market in Smart Commercial Buildings
- 1.2. The BIOT Supply Chain
2. Market Sizing and Regional Analysis
- 2.1. BIoT Global Market Forecasts
- 2.1.1. Market Revenue by Hardware, Software & Services
- 2.1.2. Market Revenue by Vertical
- 2.1.3. Market Revenue by Application
- 2.2. BIoT Market Analysis by Region
- 2.2.1. Regional Comparisons
- 2.2.2. North America
- 2.2.3. Latin America
- 2.2.4. Asia Pacific
- 2.2.5. Europe
- 2.2.6. Middle East & Africa
3. BIoT Market Applications
- 3.1. Security & Access Control
- 3.1.1. Video Surveillance
- 3.1.2. Video Management Systems (VMS)
- 3.1.3. Video Surveillance as a Service (VSaaS)
- 3.1.4. Access Control
- 3.1.5. AI Applications for Security & Access Control
- 3.2. Energy Management & Environmental Control
- 3.2.1. The Role of IoT and AI in Energy Management
- 3.2.2. Real-Time Energy Tracking and Analysis
- 3.2.3. HVAC Optimization
- 3.2.4. Balancing Priorities and Integrating Multiple Systems
- 3.2.5. The Future of Energy Management and Environmental Control
- 3.3. Grid Interactive Buildings
- 3.3.1. Demand Response and Load Management
- 3.3.2. Demand-Side Management Strategies
- 3.3.3. Load Shedding and Peak Shaving
- 3.3.4. Integrating Renewables and PEV's
- 3.3.5. Leading Players in Grid Interactive Buildings
- 3.4. Smart Operations & Maintenance
- 3.5. Space, Occupancy & People Movement
- 3.6. Air Quality
- 3.7. Hygiene, Health & Wellness
- 3.8. Smart Lighting
- 3.9. Tenant & Workplace Experience
- 3.10. Fire & Safety
- 3.11. Waste & Water Management
- 3.11.1. Water Management
- 3.11.2. Waste Management
- 3.12. Digital Twin
- 3.12.1. Defining Digital Twins
- 3.12.2. The Relationship Between Digital Twins, BIM & IoT
- 3.12.3. 3D Modelling for Digital Twins
- 3.12.4. Challenges & Criticisms
- 3.12.5. Prerequisites for Successful Digital Twins
- 3.12.6. Market Perceptions & Adoption Rates
- 3.12.7. Digital Twin Vendors
4. Smart Building IoT Platforms
- 4.1. IoT Platforms
- 4.2. The BIoT Platform Eco-System
- 4.3. BIoT Platform Offerings
5. Prospects & Use Cases by Market Vertical
- 5.1. Commercial Offices
- 5.2. Retail
- 5.2.1. Retail Sector Performance
- 5.2.2. The Future of Retail
- 5.2.3. Retail Sector IoT Opportunities
- 5.3. Hospitality
- 5.3.1. Hotels
- 5.3.2. Restaurants & Food Services
- 5.4. Data Centers
- 5.5. Other Verticals
- 5.5.1. Transport
- 5.5.2. Public Assembly/Venues
- 5.5.3. Warehouses
- 5.6. Smaller Buildings
6. BIoT Market - Adoption Drivers
- 6.1. Economic & Business Drivers
- 6.1.1. Operational Cost Savings and Efficiency Gains
- 6.1.2. Tenant Priorities & Property Value
- 6.1.3. Workplace Demands & Expectations
- 6.2. Technology Drivers
- 6.2.1. Technology Costs
- 6.2.2. Data Volume & Accessibility
- 6.2.3. Emerging Technologies
- 6.3. Energy Efficiency & Sustainability Drivers
- 6.3.1. Sustainability Performance in the Commercial Building Sector
- 6.3.2. The Critical Importance of Retrofits
- 6.3.3. Corporate Attitudes, Investments, and Initiatives
- 6.3.4. Energy Cost-related Drivers
- 6.3.5. ESG Reporting
- 6.3.6. Countering the Adverse Impacts of the IoT
- 6.4. Health & Wellbeing Drivers
- 6.5. Government Policies & Regulations
- 6.5.1. Environmental and Sustainability Regulations
- 6.5.2. Government Incentives and Subsidies
- 6.5.3. IoT, Data & Cybersecurity Regulations
- 6.5.4. Other Investment or Policy Drivers
- 6.6. Standards & Certification
- 6.6.1. The Evolving Landscape of Building Standards & Certifications
- 6.6.2. Smart & Digital connectivity
- 6.6.3. Sustainability, Energy & ESG performance
- 6.6.4. Health & Wellbeing
- 6.6.5. Cybersecurity Standards and Requirements
7. BIoT Market - Challenges & Barriers
- 7.1. Technology Challenges
- 7.1.1. Cybersecurity
- 7.1.2. Cyber Insurance
- 7.1.3. Data Privacy
- 7.1.4. Systems Complexity & Interoperability
- 7.1.5. Data Related Challenges
- 7.2. Resistance to Change and Industry Evolution
- 7.2.1. Resistance to Change in the CRE Industry
- 7.2.2. Industry evolution and transition drivers
- 7.3. Leadership, Commissioning & Procurement
- 7.3.1. IoT Project Leadership & Decision Makers
- 7.4. Building Life Cycles
- 7.5. Commissioning, Procurement & Stakeholder Alignment
- 7.5.1. Commissioning & Procurement Challenges
- 7.5.2. Stakeholder Priorities Across the Building Life Cycle
- 7.5.3. Achieving Stakeholder Alignment
- 7.5.4. Effective Integration of IoT Technology into Building Design
- 7.5.5. IT vs OT Stakeholders
- 7.5.6. Landlord/Tenant split incentives
- 7.6. Costs & Business Case Development
- 7.6.1. IoT Project Costs
- 7.6.2. Business Case Development