|
|
市場調査レポート
商品コード
1463248
構造健全性モニタリングシステムの世界市場:オファリング別、技術別、業界別、実装別、用途別、地域別 - 2029年までの予測Structural health monitoring Market by Offering (Hardware, Software & Services), Technology (Wired, Wireless), Vertical (Civil Infrastructure, Aerospace & Defense, Energy, Mining), Implementation, Application and Region - Global Forecast to 2029 |
||||||
|
|||||||
カスタマイズ可能
|
|||||||

| 構造健全性モニタリングシステムの世界市場:オファリング別、技術別、業界別、実装別、用途別、地域別 - 2029年までの予測 |
|
出版日: 2024年04月10日
発行: MarketsandMarkets
ページ情報: 英文 246 Pages
納期: 即納可能
|

全表示
- 概要
- 目次
世界の構造健全性モニタリングシステムの市場規模は、2024年に25億米ドルとになるとみられ、2029年には41億米ドルに達すると予測されており、予測期間中のCAGRは10.4%と見込まれています。
この市場の成長は、重要インフラの自動メンテナンスと修理の重要性の高まり、人命と資本の損失につながる構造欠陥の遠大な影響、インフラ部門への多額の投資、持続可能な建設慣行を促進する厳しい政府規制、構造健全性モニタリングシステムの採用を促すインフラの老朽化、構造健全性モニタリングシステム業界に関連するコスト効率など、いくつかの重要な要因によってもたらされます。
| 調査範囲 | |
|---|---|
| 調査対象年 | 2020年~2029年 |
| 基準年 | 2023年 |
| 予測期間 | 2024年~2029年 |
| 検討単位 | 金額(10億米ドル) |
| セグメント別 | オファリング別、技術別、業界別、実装別、用途別、地域別 |
| 対象地域 | 北米、欧州、アジア太平洋、その他の地域 |
ハードウェアセグメントは、主に監視下にある構造物の物理的特性を測定する上で不可欠な役割を果たすことから、構造健全性モニタリングシステム市場で最大のシェアを占めると予測されています。ハードウェア分野では、センサーが構造健全性モニタリングシステムのデータ収集に重要な役割を果たしています。センサーとデータ収集システムの物理的接続を伴う有線構造健全性モニタリングシステムシステムは、データ収集の安定性と正確性で知られ、重要なインフラ監視アプリケーションに好ましい選択肢となっています。
構造健全性モニタリングシステムでは、有線技術が大きなシェアを占めています。有線システムは、センサーとデータ収集ユニット間の物理的な接続を確立し、構造物の健全性をモニタリングするための信頼性が高く確立されたアプローチを提供します。この方法は、橋梁、建物、煙突、海上プラットフォーム、原子力施設など、安全性と耐久性の基準が厳しい大規模構造物の監視に頻繁に採用されています。有線ソリューションは、その安定性とデータ収集の正確さが認められており、信頼性と精度が最も重要な重要インフラ監視に適した選択肢となっています。
航空宇宙・防衛産業は、構造健全性モニタリングシステム分野で最も高い市場成長が見込まれています。この成長は、安全性と信頼性を確保するために、航空宇宙産業における重要部品の非破壊検査に起因しています。
当レポートでは、世界の構造健全性モニタリングシステム市場について調査し、オファリング別、技術別、業界別、実装別、用途別、地域別動向、および市場に参入する企業のプロファイルなどをまとめています。
目次
第1章 イントロダクション
第2章 調査手法
第3章 エグゼクティブサマリー
第4章 重要考察
第5章 市場概要
- イントロダクション
- 市場力学
- 顧客のビジネスに影響を与える動向/混乱
- 価格分析
- サプライチェーン分析
- エコシステム分析
- 投資と資金調達のシナリオ
- 技術分析
- 特許分析
- 貿易分析
- 2024年~2025年の主な会議とイベント
- ケーススタディ分析
- 関税と規制状況
- ポーターのファイブフォース分析
- 主な利害関係者と購入基準
第6章 構造健全性モニタリングシステムの実装方法
- イントロダクション
- 新築
- 改造
第7章 構造健全性モニタリングシステムの応用
- イントロダクション
- ひび割れ検出
- 損傷検出
- 影響監視
- 腐食監視
- ひずみモニタリング
- ホットスポット監視
- 状態検知
- マルチモーダルセンシング
- 圧力監視
- 漏れ検出
- たわみ監視
- ハリケーンと地震の監視
第8章 構造健全性モニタリングシステム市場、オファリング別
- イントロダクション
- ハードウェア
- ソフトウェアとサービス
第9章 構造健全性モニタリングシステム市場、技術別
- イントロダクション
- 有線
- 無線
第10章 構造健全性モニタリングシステム市場、業界別
- イントロダクション
- 土木インフラ
- 航空宇宙および防衛
- エネルギー
- 鉱業
- その他
第11章 構造健全性モニタリングシステム市場、地域別
- イントロダクション
- 北米
- 欧州
- アジア太平洋
- その他の地域
第12章 競合情勢
- 概要
- 主要企業が採用する戦略、2020年~2023年
- 主要企業の収益分析、2019年~2023年
- 市場シェア分析、2023年
- 企業価値評価と財務指標
- ブランド/製品比較
- 企業評価マトリックス:主要参入企業、2023年
- 企業評価マトリックス:スタートアップ/中小企業、2023年
- 競合シナリオと動向
第13章 企業プロファイル
- 主要参入企業
- COWI A/S
- CAMPBELL SCIENTIFIC, INC.
- GEOKON
- NOVA METRIX
- SGS SA
- TRIMBLE INC.
- SIXENSE
- STRUCTURAL MONITORING SYSTEMS PLC.
- ACELLENT TECHNOLOGIES, INC.
- DIGITEXX DATA SYSTEMS, INC.
- その他の企業
- FIRST SENSOR AG
- BDI
- SISGEO
- RST INSTRUMENTS LTD.
- AVT RELIABILITY
- GEOMOTION SINGAPORE
- STRAINSTALL(JAMES FISHER AND SONS PLC.)
- HBK
- KINEMETRICS
- FEAC ENGINEERING P.C.
- EFI GLOBAL, INC.
- SENSURON
- INFIBRA TECHNOLOGIES
- SODIS LAB
- SET POINT TECHNOLOGIES
- MISTRAS GROUP
- METIS DESIGN CORPORATION
- GEOSIG LTD.
第14章 付録
The global structural health monitoring market was valued at USD 2.5 billion in 2024 and is projected to reach USD 4.1 billion by 2029; it is expected to register a CAGR of 10.4% during the forecast period. The market's growth is driven by several key factors, including the rising significance of automated maintenance and repair for critical infrastructures, the far-reaching consequences of structural failures leading to loss of lives and capital, substantial investments in the infrastructure sector, stringent government regulations promoting sustainable construction practices, aging infrastructure prompting the adoption of structural health monitoring, and the cost efficiencies associated with the structural health monitoring industry.
| Scope of the Report | |
|---|---|
| Years Considered for the Study | 2020-2029 |
| Base Year | 2023 |
| Forecast Period | 2024-2029 |
| Units Considered | Value (USD Billion) |
| Segments | By Offering, Technology, Vertical, Implementation, Application and Region |
| Regions covered | North America, Europe, APAC, RoW |
"The hardware segment to hold the largest share during the forecast period."
The hardware segment is anticipated to hold the largest share of the structural health monitoring market, primarily due to its integral role in measuring the physical properties of structures under surveillance. Within the hardware segment, sensors play a crucial role in collecting data for structural health monitoring systems. Wired structural health monitoring systems, which involve physical connections between sensors and data acquisition systems, are known for their stability and accuracy in data acquisition, making them a preferred choice for critical infrastructure monitoring applications.
"the wired technology segment to record largest market share during the forecast period."
The wired technology holds a substantial market share in structural health monitoring. Wired systems establish physical connections between sensors and data acquisition units, providing a dependable and well-established approach to monitoring structural integrity. This method is frequently employed for overseeing extensive structures with stringent safety and durability criteria such as bridges, buildings, chimneys, offshore platforms, and nuclear facilities. Wired solutions are recognized for their stability and precision in data collection, making them a favored option for critical infrastructure monitoring where reliability and accuracy are paramount.
"The Aerospace & Defence is likely to grow at the highest CAGR during the forecast period."
The Aerospace & Defense vertical is expected to experience highest market growth in the field of structural health monitoring. This growth is attributed to the non-destructive inspection of critical components in the aerospace industry to ensure safety and reliability. Companies like Testia and CURTISS-WRIGHT are prominent players in this sector, emphasizing the importance of structural health monitoring for aerospace applications. The rise in investments in infrastructure, particularly in the aerospace and defense sectors, is driving the demand for advanced monitoring systems to enhance safety and operational efficiency
"The Europe segment is likely to grow at the third highest CAGR during the forecast period."
The European market for structural health monitoring market is experiencing significant growth, primarily attributed to several factors. The European structural health monitoring (SHM) market is poised for substantial growth due to multiple converging factors. Firstly, aging infrastructure across Europe, including bridges and transportation networks, necessitates proactive management through SHM to detect issues early and prevent costly failures. Secondly, increased government investment in infrastructure renovation projects presents opportunities for integrating SHM solutions to ensure infrastructure longevity and safety. Thirdly, stringent safety regulations drive the demand for SHM by providing continuous monitoring data to ensure compliance and prioritize public safety. Furthermore, SHM contributes to sustainability goals by extending the lifespan of structures and optimizing resource utilization. Technological advancements in sensor technology and digitalization in construction enhance the accessibility and integration of SHM solutions. Additionally, growing awareness and expertise, focus on non-destructive testing, cost benefits, and applications beyond traditional infrastructure further fuel the growth of the SHM market in Europe.
Breakdown of primaries
The study contains insights from various industry experts, ranging from component suppliers to Tier 1 companies and OEMs. The break-up of the primaries is as follows:
- By Company Type - Tier 1 - 50%, Tier 2 - 30%, Tier 3 - 20%
- By Designation- C-level Executives - 35%, Directors - 30%, Others - 35%
- By Region-North America - 40%, Europe - 25%, Asia Pacific - 20%, RoW - 15%
The structural health monitoring market is dominated by a few globally established players such as COWI A/S (Denmark), Campbell Scientific (US), Geokon (US), Nova Metrix LLC (US), SGS SA (Switzerland), Trimble Inc. (US), Structural Monitoring Systems PLC (Australia), Sixense (France), Digitexx Data Systems, Inc. (US), and Acellent Technologies, Inc. (US). The study includes an in-depth competitive analysis of these key players in the structural health monitoring market, with their company profiles, recent developments, and key market strategies.
Research Coverage:
The report segments the structural health monitoring market and forecasts its size by offering, by technology, implementation, application, vertical, and region. The report also discusses the drivers, restraints, opportunities, and challenges pertaining to the market. It gives a detailed view of the market across four main regions-North America, Europe, Asia Pacific, and RoW. Supply chain analysis has been included in the report, along with the key players and their competitive analysis in the structural health monitoring ecosystem.
Key Benefits to Buy the Report:
- Analysis of key drivers (automation in maintenance & repair of infrastructure, loss of life and capital due to structural failures, increasing infrastructure investments,government regulations pertaining to sustainable structures, aging infrastructure and benefits associated with structural health monitoring, reduced costs of structural health monitoring systems). Restraint (high installation and monitoring costs, inaccurate results owing to errors in readings, slow adoption of structural health monitoring in developing countries). Opportunity (integration of advanced solutions for structural health monitoring, growing opportunities in Asia Pacific and GCC countries, advancements in sensor technologies, increasing investments in oil & gas and major energy projects). Challenges (dearth of skilled operators for installation and calibration of instruments, poor site conditions, technical challenges and operational factors, processing and management of large volumes of data)
- Product Development/Innovation: Detailed insights on upcoming technologies, research and development activities, and new productand services launches in the structural health monitoring market.
- Market Development: Comprehensive information about lucrative markets - the report analyses the structural health monitoring market across varied regions
- Market Diversification: Exhaustive information about new products and services, untapped geographies, recent developments, and investments in the structural health monitoring market.
- Competitive Assessment: In-depth assessment of market shares, growth strategies, and service offerings of leading players like COWI A/S (Denmark), Campbell Scientific (US), Geokon (US), Nova Metrix LLC (US), SGS SA (Switzerland), Trimble Inc. (US), Structural Monitoring Systems PLC (Australia), Sixense (France), Digitexx Data Systems, Inc. (US), and Acellent Technologies, Inc. (US) among others in the structural health monitoring market.
TABLE OF CONTENTS
1 INTRODUCTION
- 1.1 STUDY OBJECTIVES
- 1.2 MARKET DEFINITION
- 1.3 STUDY SCOPE
- 1.3.1 MARKETS COVERED
- FIGURE 1 STRUCTURAL HEALTH MONITORING MARKET SEGMENTATION
- 1.3.2 REGIONAL SCOPE
- 1.3.3 YEARS CONSIDERED
- 1.3.4 INCLUSIONS AND EXCLUSIONS
- 1.4 CURRENCY CONSIDERED
- 1.5 UNITS CONSIDERED
- 1.6 LIMITATIONS
- 1.7 STAKEHOLDERS
- 1.8 SUMMARY OF CHANGES
- 1.9 IMPACT OF RECESSION
2 RESEARCH METHODOLOGY
- 2.1 RESEARCH DATA
- FIGURE 2 STRUCTURAL HEALTH MONITORING MARKET: RESEARCH DESIGN
- 2.1.1 SECONDARY DATA
- 2.1.1.1 List of key secondary sources
- 2.1.1.2 Key data from secondary sources
- 2.1.2 PRIMARY DATA
- 2.1.2.1 List of primary interview participants
- 2.1.2.2 Key data from primary sources
- 2.1.2.3 Key industry insights
- 2.1.2.4 Breakdown of primaries
- 2.1.3 SECONDARY AND PRIMARY RESEARCH
- 2.2 MARKET SIZE ESTIMATION METHODOLOGY
- 2.2.1 BOTTOM-UP APPROACH
- 2.2.1.1 Approach to arrive at market size using bottom-up analysis (demand side)
- FIGURE 3 STRUCTURAL HEALTH MONITORING MARKET: BOTTOM-UP APPROACH
- FIGURE 4 STRUCTURAL HEALTH MONITORING MARKET SIZE ESTIMATION: DEMAND-SIDE ANALYSIS
- 2.2.2 TOP-DOWN APPROACH
- 2.2.2.1 Approach to arrive at market size using top-down analysis (supply side)
- FIGURE 5 STRUCTURAL HEALTH MONITORING MARKET: TOP-DOWN APPROACH
- FIGURE 6 STRUCTURAL HEALTH MONITORING MARKET SIZE ESTIMATION: SUPPLY-SIDE ANALYSIS
- 2.2.1 BOTTOM-UP APPROACH
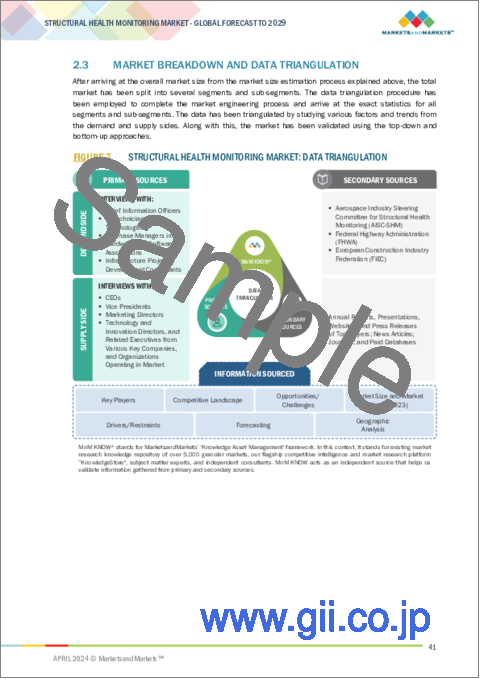
- 2.3 MARKET BREAKDOWN AND DATA TRIANGULATION
- FIGURE 7 STRUCTURAL HEALTH MONITORING MARKET: DATA TRIANGULATION
- 2.4 RESEARCH ASSUMPTIONS
- TABLE 1 STRUCTURAL HEALTH MONITORING MARKET: RESEARCH ASSUMPTIONS
- 2.5 RISK ASSESSMENT
- TABLE 2 STRUCTURAL HEALTH MONITORING MARKET: RISK ASSESSMENT
- 2.6 RECESSION IMPACT
- TABLE 3 STRUCTURAL HEALTH MONITORING MARKET: RECESSION IMPACT
- 2.7 RESEARCH LIMITATIONS
- FIGURE 8 STRUCTURAL HEALTH MONITORING MARKET: RESEARCH LIMITATIONS
3 EXECUTIVE SUMMARY
- FIGURE 9 STRUCTURAL HEALTH MONITORING MARKET SIZE, 2020-2029 (USD MILLION)
- FIGURE 10 HARDWARE OFFERINGS TO ACCOUNT FOR LARGER MARKET SHARE IN 2024
- FIGURE 11 WIRED TECHNOLOGY TO DOMINATE STRUCTURAL HEALTH MONITORING MARKET BETWEEN 2024 AND 2029
- FIGURE 12 CIVIL INFRASTRUCTURE VERTICAL TO HOLD LARGEST MARKET SHARE IN 2029
- FIGURE 13 ASIA PACIFIC TO EXHIBIT HIGHEST CAGR IN STRUCTURAL HEALTH MONITORING MARKET FROM 2024 TO 2029
4 PREMIUM INSIGHTS
- 4.1 ATTRACTIVE OPPORTUNITIES FOR PLAYERS IN STRUCTURAL HEALTH MONITORING MARKET
- FIGURE 14 RISING NEED TO MONITOR AGING INFRASTRUCTURE TO PROVIDE LUCRATIVE OPPORTUNITIES FOR PLAYERS IN STRUCTURAL HEALTH MONITORING MARKET
- 4.2 STRUCTURAL HEALTH MONITORING MARKET, BY OFFERING
- FIGURE 15 HARDWARE TO ACCOUNT FOR LARGER SHARE OF STRUCTURAL HEALTH MONITORING MARKET, BY OFFERING, IN 2029
- 4.3 STRUCTURAL HEALTH MONITORING MARKET, BY VERTICAL
- FIGURE 16 CIVIL INFRASTRUCTURE TO DOMINATE MARKET FROM 2024 TO 2029
- 4.4 STRUCTURAL HEALTH MONITORING MARKET, BY TECHNOLOGY
- FIGURE 17 WIRED TECHNOLOGY TO ACCOUNT FOR LARGER MARKET SHARE THAN WIRELESS TECHNOLOGY IN 2029
- 4.5 STRUCTURAL HEALTH MONITORING MARKET, BY REGION
- FIGURE 18 NORTH AMERICA TO DOMINATE STRUCTURAL HEALTH MONITORING MARKET DURING FORECAST PERIOD
5 MARKET OVERVIEW
- 5.1 INTRODUCTION
- 5.2 MARKET DYNAMICS
- FIGURE 19 STRUCTURAL HEALTH MONITORING MARKET: DRIVERS, RESTRAINTS, OPPORTUNITIES, AND CHALLENGES
- 5.2.1 DRIVERS
- 5.2.1.1 Rising automation of structural repair and maintenance processes
- 5.2.1.2 Increasing number of structurally deficient bridges
- FIGURE 20 NUMBER OF STRUCTURALLY DEFICIENT BRIDGES IN US, 2019-2023
- 5.2.1.3 Surging investment in infrastructure development projects
- 5.2.1.4 Increasing focus on developing advanced tools to ensure building safety
- 5.2.1.5 Growing concern about aging infrastructure
- 5.2.1.6 Rising adoption of micro-electromechanical systems and fiber optic sensors
- FIGURE 21 IMPACT ANALYSIS: DRIVERS
- 5.2.2 RESTRAINTS
- 5.2.2.1 High installation and monitoring costs
- 5.2.2.2 Inaccurate readings due to design & calibration errors
- TABLE 4 DESIGN AND CALIBRATION ERRORS AND CORRECTIVE MEASURES
- 5.2.2.3 Insufficient infrastructure investments in developing countries
- FIGURE 22 IMPACT ANALYSIS: RESTRAINTS
- 5.2.3 OPPORTUNITIES
- 5.2.3.1 Introduction of AI-powered infrastructure asset management solutions
- 5.2.3.2 Population growth in emerging economies
- 5.2.3.3 Rapid advancement in sensor technologies
- 5.2.3.4 Increased funding for oil & gas projects
- FIGURE 23 IMPACT ANALYSIS: OPPORTUNITIES
- 5.2.4 CHALLENGES
- 5.2.4.1 Shortage of highly skilled operators
- 5.2.4.2 Harsh weather and adverse site conditions
- 5.2.4.3 Complex installation processes
- 5.2.4.4 Difficulties in managing large volumes of data
- FIGURE 24 IMPACT ANALYSIS: CHALLENGES
- 5.3 TRENDS/DISRUPTIONS IMPACTING CUSTOMERS' BUSINESSES
- FIGURE 25 STRUCTURAL HEALTH MONITORING MARKET: TRENDS/DISRUPTIONS IMPACTING CUSTOMERS' BUSINESSES
- 5.4 PRICING ANALYSIS
- 5.4.1 AVERAGE SELLING PRICE OF STRUCTURAL HEALTH MONITORING SENSORS OFFERED BY KEY PLAYERS, BY TYPE
- FIGURE 26 AVERAGE SELLING PRICE OF STRUCTURAL HEALTH MONITORING SENSORS OFFERED BY KEY PLAYERS, BY TYPE (USD)
- TABLE 5 AVERAGE SELLING PRICE OF STRUCTURAL HEALTH MONITORING SENSORS OFFERED BY KEY PLAYERS, BY TYPE (USD)
- 5.4.2 AVERAGE SELLING PRICE OF STRUCTURAL HEALTH MONITORING HARDWARE PRODUCTS, BY REGION
- FIGURE 27 AVERAGE SELLING PRICE OF STRUCTURAL HEALTH MONITORING HARDWARE PRODUCTS, BY REGION (USD)
- 5.5 SUPPLY CHAIN ANALYSIS
- FIGURE 28 STRUCTURAL HEALTH MONITORING MARKET: SUPPLY CHAIN ANALYSIS
- 5.6 ECOSYSTEM ANALYSIS
- TABLE 6 ROLE OF COMPANIES IN STRUCTURAL HEALTH MONITORING ECOSYSTEM
- 5.7 INVESTMENT AND FUNDING SCENARIO
- FIGURE 29 STRUCTURAL HEALTH MONITORING MARKET: INVESTMENT AND FUNDING SCENARIO
- 5.8 TECHNOLOGY ANALYSIS
- 5.8.1 KEY TECHNOLOGY
- 5.8.1.1 Data acquisition systems (DAS)
- 5.8.2 COMPLEMENTARY TECHNOLOGIES
- 5.8.2.1 Non-destructive testing (NDT)
- 5.8.2.2 Building information modeling (BIM)
- 5.8.3 ADJACENT TECHNOLOGIES
- 5.8.3.1 Digital twins
- 5.8.3.2 Robotics and drones
- 5.8.1 KEY TECHNOLOGY
- 5.9 PATENT ANALYSIS
- FIGURE 30 STRUCTURAL HEALTH MONITORING MARKET: PATENTS APPLIED AND GRANTED, 2014-2023
- FIGURE 31 STRUCTURAL HEALTH MONITORING MARKET: ANALYSIS OF PATENTS GRANTED IN US AND EUROPE
- TABLE 7 STRUCTURAL HEALTH MONITORING MARKET: LIST OF PATENTS, 2020-2023
- 5.10 TRADE ANALYSIS
- 5.10.1 IMPORT SCENARIO
- FIGURE 32 IMPORT DATA FOR HS CODE 9015-COMPLIANT MEASURING AND SURVEYING INSTRUMENTS, 2018-2022
- 5.10.2 EXPORT SCENARIO
- FIGURE 33 EXPORT DATA FOR HS CODE 9015-COMPLIANT MEASURING AND SURVEYING INSTRUMENTS, 2018-2022
- 5.11 KEY CONFERENCES AND EVENTS, 2024-2025
- TABLE 8 STRUCTURAL HEALTH MONITORING MARKET: LIST OF KEY CONFERENCES AND EVENTS, 2024-2025
- 5.12 CASE STUDY ANALYSIS
- 5.12.1 KSEB PLANS TO INSTALL SAFETY AND RISK MANAGEMENT SOLUTIONS TO AVOID DAM FAILURE
- 5.12.2 ENCARDIO RITE OBTAINS CONTRACT TO PROVIDE ROCK MONITORING SOLUTIONS FOR IDENTIFYING FAULT ZONES
- 5.12.3 GEOCOMP PROVIDES MONITORING SERVICES TO EVALUATE IMPACT OF BRIDGE CONSTRUCTION ON ADJACENT STRUCTURES
- 5.13 TARIFF AND REGULATORY LANDSCAPE
- 5.13.1 TARIFF ANALYSIS
- TABLE 9 MFN TARIFF FOR HS CODE 9015-COMPLIANT PRODUCTS EXPORTED BY US, 2023
- 5.13.2 REGULATORY BODIES, GOVERNMENT AGENCIES, AND OTHER ORGANIZATIONS
- TABLE 10 NORTH AMERICA: LIST OF REGULATORY BODIES, GOVERNMENT AGENCIES, AND OTHER ORGANIZATIONS
- TABLE 11 EUROPE: LIST OF REGULATORY BODIES, GOVERNMENT AGENCIES, AND OTHER ORGANIZATIONS
- TABLE 12 ASIA PACIFIC: LIST OF REGULATORY BODIES, GOVERNMENT AGENCIES, AND OTHER ORGANIZATIONS
- TABLE 13 ROW: LIST OF REGULATORY BODIES, GOVERNMENT AGENCIES, AND OTHER ORGANIZATIONS
- 5.14 PORTER'S FIVE FORCES ANALYSIS
- FIGURE 34 STRUCTURAL HEALTH MONITORING MARKET: PORTER'S FIVE FORCES ANALYSIS
- FIGURE 35 STRUCTURAL HEALTH MONITORING MARKET: PORTER'S FIVE FORCES IMPACT ANALYSIS
- TABLE 14 STRUCTURAL HEALTH MONITORING MARKET: PORTER'S FIVE FORCES ANALYSIS, 2023
- 5.14.1 THREAT OF NEW ENTRANTS
- 5.14.2 THREAT OF SUBSTITUTES
- 5.14.3 BARGAINING POWER OF SUPPLIERS
- 5.14.4 BARGAINING POWER OF BUYERS
- 5.14.5 INTENSITY OF COMPETITIVE RIVALRY
- 5.15 KEY STAKEHOLDERS AND BUYING CRITERIA
- 5.15.1 KEY STAKEHOLDERS IN BUYING PROCESS
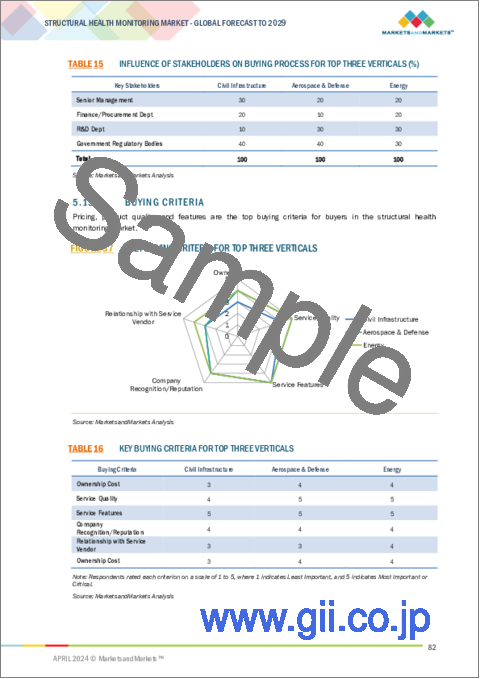
- FIGURE 36 INFLUENCE OF STAKEHOLDERS ON BUYING PROCESS FOR TOP THREE VERTICALS
- TABLE 15 INFLUENCE OF STAKEHOLDERS ON BUYING PROCESS FOR TOP THREE VERTICALS (%)
- 5.15.2 BUYING CRITERIA
- FIGURE 37 KEY BUYING CRITERIA FOR TOP THREE VERTICALS
- TABLE 16 KEY BUYING CRITERIA FOR TOP THREE VERTICALS
6 IMPLEMENTATION METHODS FOR STRUCTURAL HEALTH MONITORING SYSTEMS
- 6.1 INTRODUCTION
- FIGURE 38 IMPLEMENTATION METHODS OF STRUCTURAL HEALTH MONITORING SYSTEMS
- 6.2 NEW CONSTRUCTION
- 6.3 RETROFITTING
7 APPLICATIONS OF STRUCTURAL HEALTH MONITORING SYSTEMS
- 7.1 INTRODUCTION
- FIGURE 39 APPLICATIONS OF STRUCTURAL HEALTH MONITORING SYSTEMS
- TABLE 17 APPLICATIONS, MONITORING PURPOSE, AND INSTRUMENTS USED IN STRUCTURAL HEALTH MONITORING
- 7.2 CRACK DETECTION
- 7.3 DAMAGE DETECTION
- 7.4 IMPACT MONITORING
- 7.5 CORROSION MONITORING
- 7.6 STRAIN MONITORING
- 7.7 HOTSPOT MONITORING
- 7.8 STATE SENSING
- 7.9 MULTI-MODAL SENSING
- 7.10 PRESSURE MONITORING
- 7.11 LEAKAGE DETECTION
- 7.12 DEFLECTION MONITORING
- 7.13 HURRICANE & EARTHQUAKE MONITORING
8 STRUCTURAL HEALTH MONITORING MARKET, BY OFFERING
- 8.1 INTRODUCTION
- FIGURE 40 STRUCTURAL HEALTH MONITORING MARKET, BY OFFERING
- TABLE 18 STRUCTURAL HEALTH MONITORING MARKET, BY OFFERING, 2020-2023 (USD MILLION)
- TABLE 19 STRUCTURAL HEALTH MONITORING MARKET, BY OFFERING, 2024-2029 (USD MILLION)
- FIGURE 41 HARDWARE SEGMENT TO ACCOUNT FOR LARGER MARKET SHARE IN 2029
- 8.2 HARDWARE
- TABLE 20 HARDWARE: STRUCTURAL HEALTH MONITORING MARKET, BY REGION, 2020-2023 (USD MILLION)
- TABLE 21 HARDWARE: STRUCTURAL HEALTH MONITORING MARKET, BY REGION, 2024-2029 (USD MILLION)
- TABLE 22 HARDWARE: STRUCTURAL HEALTH MONITORING MARKET, BY TYPE, 2020-2023 (USD MILLION)
- TABLE 23 HARDWARE: STRUCTURAL HEALTH MONITORING MARKET, BY TYPE, 2024-2029 (USD MILLION)
- FIGURE 42 SENSORS TO DOMINATE MARKET FOR HARDWARE DURING FORECAST PERIOD
- 8.2.1 SENSORS
- TABLE 24 HARDWARE: STRUCTURAL HEALTH MONITORING MARKET FOR SENSORS, BY REGION, 2020-2023 (USD MILLION)
- TABLE 25 HARDWARE: STRUCTURAL HEALTH MONITORING MARKET FOR SENSORS, BY REGION, 2024-2029 (USD MILLION)
- TABLE 26 HARDWARE: STRUCTURAL HEALTH MONITORING MARKET FOR SENSORS, BY SENSOR TYPE, 2020-2023 (USD MILLION)
- TABLE 27 HARDWARE: STRUCTURAL HEALTH MONITORING MARKET FOR SENSORS, BY SENSOR TYPE, 2024-2029 (USD MILLION)
- TABLE 28 HARDWARE: STRUCTURAL HEALTH MONITORING MARKET FOR SENSORS, BY SENSOR TYPE, 2020-2023 (THOUSAND UNITS)
- TABLE 29 HARDWARE: STRUCTURAL HEALTH MONITORING MARKET FOR SENSORS, BY SENSOR TYPE, 2024-2029 (THOUSAND UNITS)
- 8.2.1.1 Accelerometers
- 8.2.1.1.1 Need to measure gravity or dynamic loads and vibrations due to forces to fuel segmental growth
- 8.2.1.2 Displacement sensors
- 8.2.1.2.1 Adoption of linear variable differential transformers to monitor crack displacement to augment segmental growth
- 8.2.1.3 Tilt meters & inclinometers
- 8.2.1.3.1 Application of tilt meters & inclinometers in parallel displacement measurement to foster segmental growth
- 8.2.1.4 Strain gauges
- 8.2.1.4.1 Use of strain gauges to detect variations in strain distribution across structures to contribute to segmental growth
- 8.2.1.5 Corrosion sensors
- 8.2.1.5.1 Implementation of corrosion sensors for predictive maintenance analysis to facilitate segmental growth
- 8.2.1.6 Temperature sensors
- 8.2.1.6.1 Need to reduce cracking and spalling of structures due to sudden temperature changes to expedite segmental growth
- 8.2.1.7 Other sensor types
- 8.2.1.1 Accelerometers
- 8.2.2 DATA ACQUISITION SYSTEMS
- 8.2.2.1 Adoption of data acquisition systems for real-time, remote monitoring of structures to accelerate market growth
- TABLE 30 DATA ACQUISITION SYSTEMS: STRUCTURAL HEALTH MONITORING MARKET, BY REGION, 2020-2023 (USD MILLION)
- TABLE 31 DATA ACQUISITION SYSTEMS: STRUCTURAL HEALTH MONITORING MARKET, BY REGION, 2024-2029 (USD MILLION)
- 8.2.3 OTHER HARDWARE TYPES
- TABLE 32 OTHER HARDWARE TYPES: STRUCTURAL HEALTH MONITORING MARKET, BY REGION, 2020-2023 (USD MILLION)
- TABLE 33 OTHER HARDWARE TYPES: STRUCTURAL HEALTH MONITORING MARKET, BY REGION, 2024-2029 (USD MILLION)
- 8.3 SOFTWARE & SERVICES
- 8.3.1 REQUIREMENT FOR SOFTWARE AND SERVICES FOR EARLY STRUCTURAL DAMAGE DETECTION TO FOSTER SEGMENTAL GROWTH
- 8.3.2 PRE-INSTALLATION SERVICES
- 8.3.3 POST-INSTALLATION SERVICES
- TABLE 34 SOFTWARE & SERVICES: STRUCTURAL HEALTH MONITORING MARKET, BY REGION, 2020-2023 (USD MILLION)
- TABLE 35 SOFTWARE & SERVICES: STRUCTURAL HEALTH MONITORING MARKET, BY REGION, 2024-2029 (USD MILLION)
9 STRUCTURAL HEALTH MONITORING MARKET, BY TECHNOLOGY
- 9.1 INTRODUCTION
- FIGURE 43 STRUCTURAL HEALTH MONITORING MARKET, BY TECHNOLOGY
- TABLE 36 STRUCTURAL HEALTH MONITORING MARKET, BY TECHNOLOGY, 2020-2023 (USD MILLION)
- TABLE 37 STRUCTURAL HEALTH MONITORING MARKET, BY TECHNOLOGY, 2024-2029 (USD MILLION)
- FIGURE 44 WIRED TECHNOLOGY TO HOLD LARGER SHARE OF STRUCTURAL HEALTH MONITORING MARKET IN 2029
- 9.2 WIRED
- 9.2.1 LOW RISK OF DATA LOSS TO BOOST ADOPTION OF WIRED STRUCTURAL HEALTH MONITORING SYSTEMS
- TABLE 38 WIRED: STRUCTURAL HEALTH MONITORING MARKET, BY REGION, 2020-2023 (USD MILLION)
- TABLE 39 WIRED: STRUCTURAL HEALTH MONITORING MARKET, BY REGION, 2024-2029 (USD MILLION)
- 9.3 WIRELESS
- 9.3.1 HIGH EFFICIENCY AND LOW MAINTENANCE COSTS TO FUEL DEMAND FOR WIRELESS STRUCTURAL HEALTH MANAGEMENT SYSTEMS
- TABLE 40 WIRELESS: STRUCTURAL HEALTH MONITORING MARKET, BY REGION, 2020-2023 (USD MILLION)
- TABLE 41 WIRELESS: STRUCTURAL HEALTH MONITORING MARKET, BY REGION, 2024-2029 (USD MILLION)
10 STRUCTURAL HEALTH MONITORING MARKET, BY VERTICAL
- 10.1 INTRODUCTION
- FIGURE 45 STRUCTURAL HEALTH MONITORING MARKET, BY VERTICAL
- FIGURE 46 CIVIL INFRASTRUCTURE VERTICAL TO ACCOUNT FOR LARGEST MARKET SHARE IN 2029
- TABLE 42 STRUCTURAL HEALTH MONITORING MARKET, BY VERTICAL, 2020-2023 (USD MILLION)
- TABLE 43 STRUCTURAL HEALTH MONITORING MARKET, BY VERTICAL, 2024-2029 (USD MILLION)
- 10.2 CIVIL INFRASTRUCTURE
- 10.2.1 REQUIREMENT FOR REGULAR MONITORING OF CIVIL INFRASTRUCTURE TO CURB REPLACEMENT COSTS TO FUEL SEGMENTAL GROWTH
- 10.2.2 BRIDGES
- 10.2.3 TUNNELS
- 10.2.4 DAMS
- 10.2.5 BUILDINGS & STADIUMS
- TABLE 44 MAJOR CIVIL INFRASTRUCTURE PROJECTS
- FIGURE 47 CIVIL INFRASTRUCTURE TO RECORD HIGHEST CAGR IN STRUCTURAL HEALTH MONITORING MARKET IN ASIA PACIFIC DURING FORECAST PERIOD
- TABLE 45 CIVIL INFRASTRUCTURE: STRUCTURAL HEALTH MONITORING MARKET, BY REGION, 2020-2023 (USD MILLION)
- TABLE 46 CIVIL INFRASTRUCTURE: STRUCTURAL HEALTH MONITORING MARKET, BY REGION, 2024-2029 (USD MILLION)
- 10.3 AEROSPACE & DEFENSE
- 10.3.1 NEED TO MINIMIZE RISK OF AIRCRAFT STRUCTURAL FAILURES TO ACCELERATE SEGMENTAL GROWTH
- TABLE 47 MAJOR AEROSPACE & DEFENSE PROJECTS
- FIGURE 48 AEROSPACE & DEFENSE VERTICAL TO ACCOUNT FOR LARGEST SHARE OF NORTH AMERICAN MARKET IN 2029
- TABLE 48 AEROSPACE & DEFENSE: STRUCTURAL HEALTH MONITORING MARKET, BY REGION, 2020-2023 (USD MILLION)
- TABLE 49 AEROSPACE & DEFENSE: STRUCTURAL HEALTH MONITORING MARKET, BY REGION, 2024-2029 (USD MILLION)
- 10.4 ENERGY
- 10.4.1 DEVELOPMENT OF WIND AND NUCLEAR ENERGY PROJECTS TO BOOST SEGMENTAL GROWTH
- TABLE 50 MAJOR ENERGY PROJECTS
- FIGURE 49 ENERGY VERTICAL TO EXHIBIT HIGHEST CAGR IN STRUCTURAL HEALTH MONITORING MARKET IN ASIA PACIFIC DURING FORECAST PERIOD
- TABLE 51 ENERGY: STRUCTURAL HEALTH MONITORING MARKET, BY REGION, 2020-2023 (USD MILLION)
- TABLE 52 ENERGY: STRUCTURAL HEALTH MONITORING MARKET, BY REGION, 2024-2029 (USD MILLION)
- 10.5 MINING
- 10.5.1 USE OF HEAVY ROTATING MACHINES IN MINING OPERATIONS TO FACILITATE SEGMENTAL GROWTH
- TABLE 53 MAJOR MINING PROJECTS
- FIGURE 50 MINING VERTICAL TO HOLD LARGEST SHARE OF STRUCTURAL HEALTH MONITORING MARKET IN EUROPE IN 2029
- TABLE 54 MINING: STRUCTURAL HEALTH MONITORING MARKET, BY REGION, 2020-2023 (USD MILLION)
- TABLE 55 MINING: STRUCTURAL HEALTH MONITORING MARKET, BY REGION, 2024-2029 (USD MILLION)
- 10.6 OTHER VERTICALS
- TABLE 56 MAJOR INDUSTRIAL MACHINERY, MARINE, AND AUTOMOTIVE & TRANSPORTATION PROJECTS
- FIGURE 51 OTHER VERTICALS TO DOMINATE MARKET IN NORTH AMERICA BETWEEN 2024 AND 2029
- TABLE 57 OTHER VERTICALS: STRUCTURAL HEALTH MONITORING MARKET, BY REGION, 2020-2023 (USD MILLION)
- TABLE 58 OTHER VERTICALS: STRUCTURAL HEALTH MONITORING MARKET, BY REGION, 2024-2029 (USD MILLION)
11 STRUCTURAL HEALTH MONITORING MARKET, BY REGION
- 11.1 INTRODUCTION
- FIGURE 52 STRUCTURAL HEALTH MONITORING MARKET, BY REGION
- FIGURE 53 INDIA TO EXHIBIT HIGHEST CAGR IN GLOBAL STRUCTURAL HEALTH MONITORING MARKET DURING FORECAST PERIOD
- FIGURE 54 NORTH AMERICA TO DOMINATE STRUCTURAL HEALTH MONITORING MARKET FROM 2024 TO 2029
- TABLE 59 STRUCTURAL HEALTH MONITORING MARKET, BY REGION, 2020-2023 (USD MILLION)
- TABLE 60 STRUCTURAL HEALTH MONITORING MARKET, BY REGION, 2024-2029 (USD MILLION)
- 11.2 NORTH AMERICA
- 11.2.1 RECESSION IMPACT ON STRUCTURAL HEALTH MONITORING MARKET IN NORTH AMERICA
- FIGURE 55 NORTH AMERICA: RECESSION IMPACT ANALYSIS
- FIGURE 56 NORTH AMERICA: STRUCTURAL HEALTH MONITORING MARKET SNAPSHOT
- TABLE 61 NORTH AMERICA: STRUCTURAL HEALTH MONITORING MARKET, BY COUNTRY, 2020-2023 (USD MILLION)
- TABLE 62 NORTH AMERICA: STRUCTURAL HEALTH MONITORING MARKET, BY COUNTRY, 2024-2029 (USD MILLION)
- TABLE 63 NORTH AMERICA: STRUCTURAL HEALTH MONITORING MARKET, BY VERTICAL, 2020-2023 (USD MILLION)
- TABLE 64 NORTH AMERICA: STRUCTURAL HEALTH MONITORING MARKET, BY VERTICAL, 2024-2029 (USD MILLION)
- TABLE 65 NORTH AMERICA: STRUCTURAL HEALTH MONITORING MARKET, BY TECHNOLOGY, 2020-2023 (USD MILLION)
- TABLE 66 NORTH AMERICA: STRUCTURAL HEALTH MONITORING MARKET, BY TECHNOLOGY, 2024-2029 (USD MILLION)
- TABLE 67 NORTH AMERICA: STRUCTURAL HEALTH MONITORING MARKET, BY OFFERING, 2020-2023 (USD MILLION)
- TABLE 68 NORTH AMERICA: STRUCTURAL HEALTH MONITORING MARKET, BY OFFERING, 2024-2029 (USD MILLION)
- TABLE 69 NORTH AMERICA: STRUCTURAL HEALTH MONITORING MARKET FOR HARDWARE, BY TYPE, 2020-2023 (USD MILLION)
- TABLE 70 NORTH AMERICA: STRUCTURAL HEALTH MONITORING MARKET FOR HARDWARE, BY TYPE, 2024-2029 (USD MILLION)
- 11.2.2 US
- 11.2.2.1 Rising infrastructure and economic developments to drive market
- TABLE 71 US: STRUCTURAL HEALTH MONITORING MARKET, BY TECHNOLOGY, 2020-2023 (USD MILLION)
- TABLE 72 US: STRUCTURAL HEALTH MONITORING MARKET, BY TECHNOLOGY, 2024-2029 (USD MILLION)
- 11.2.3 CANADA
- 11.2.3.1 Increasing investments in highway construction to contribute to market growth
- TABLE 73 CANADA: STRUCTURAL HEALTH MONITORING MARKET, BY TECHNOLOGY, 2020-2023 (USD MILLION)
- TABLE 74 CANADA: STRUCTURAL HEALTH MONITORING MARKET, BY TECHNOLOGY, 2024-2029 (USD MILLION)
- 11.2.4 MEXICO
- 11.2.4.1 Growing emphasis on new infrastructure development to foster market growth
- TABLE 75 MEXICO: STRUCTURAL HEALTH MONITORING MARKET, BY TECHNOLOGY, 2020-2023 (USD MILLION)
- TABLE 76 MEXICO: STRUCTURAL HEALTH MONITORING MARKET, BY TECHNOLOGY, 2024-2029 (USD MILLION)
- 11.3 EUROPE
- 11.3.1 RECESSION IMPACT ON STRUCTURAL HEALTH MONITORING MARKET IN EUROPE
- FIGURE 57 EUROPE: RECESSION IMPACT ANALYSIS
- FIGURE 58 EUROPE: STRUCTURAL HEALTH MONITORING MARKET SNAPSHOT
- TABLE 77 EUROPE: STRUCTURAL HEALTH MONITORING MARKET, BY COUNTRY, 2020-2023 (USD MILLION)
- TABLE 78 EUROPE: STRUCTURAL HEALTH MONITORING MARKET, BY COUNTRY, 2024-2029 (USD MILLION)
- TABLE 79 EUROPE: STRUCTURAL HEALTH MONITORING MARKET, BY VERTICAL, 2020-2023 (USD MILLION)
- TABLE 80 EUROPE: STRUCTURAL HEALTH MONITORING MARKET, BY VERTICAL, 2024-2029 (USD MILLION)
- TABLE 81 EUROPE: STRUCTURAL HEALTH MONITORING MARKET, BY TECHNOLOGY, 2020-2023 (USD MILLION)
- TABLE 82 EUROPE: STRUCTURAL HEALTH MONITORING MARKET, BY TECHNOLOGY, 2024-2029 (USD MILLION)
- TABLE 83 EUROPE: STRUCTURAL HEALTH MONITORING MARKET, BY OFFERING, 2020-2023 (USD MILLION)
- TABLE 84 EUROPE: STRUCTURAL HEALTH MONITORING MARKET, BY OFFERING, 2024-2029 (USD MILLION)
- TABLE 85 EUROPE: STRUCTURAL HEALTH MONITORING MARKET FOR HARDWARE, BY TYPE, 2020-2023 (USD MILLION)
- TABLE 86 EUROPE: STRUCTURAL HEALTH MONITORING MARKET FOR HARDWARE, BY TYPE, 2024-2029 (USD MILLION)
- 11.3.2 UK
- 11.3.2.1 Surging adoption of advanced monitoring systems to detect structural failures at early stage to augment market growth
- TABLE 87 UK: STRUCTURAL HEALTH MONITORING MARKET, BY TECHNOLOGY, 2020-2023 (USD MILLION)
- TABLE 88 UK: STRUCTURAL HEALTH MONITORING MARKET, BY TECHNOLOGY, 2024-2029 (USD MILLION)
- 11.3.3 GERMANY
- 11.3.3.1 Growing population and new construction projects to facilitate market growth
- TABLE 89 GERMANY: STRUCTURAL HEALTH MONITORING MARKET, BY TECHNOLOGY, 2020-2023 (USD MILLION)
- TABLE 90 GERMANY: STRUCTURAL HEALTH MONITORING MARKET, BY TECHNOLOGY, 2024-2029 (USD MILLION)
- 11.3.4 FRANCE
- 11.3.4.1 Rising investments in transport and industrial sectors to fuel market growth
- TABLE 91 FRANCE: STRUCTURAL HEALTH MONITORING MARKET, BY TECHNOLOGY, 2020-2023 (USD MILLION)
- TABLE 92 FRANCE: STRUCTURAL HEALTH MONITORING MARKET, BY TECHNOLOGY, 2024-2029 (USD MILLION)
- 11.3.5 ITALY
- 11.3.5.1 Increasing number of large construction projects to propel market
- TABLE 93 ITALY: STRUCTURAL HEALTH MONITORING MARKET, BY TECHNOLOGY, 2020-2023 (USD MILLION)
- TABLE 94 ITALY: STRUCTURAL HEALTH MONITORING MARKET, BY TECHNOLOGY, 2024-2029 (USD MILLION)
- 11.3.6 NETHERLANDS
- 11.3.6.1 Growing concern about aging infrastructure to boost demand
- TABLE 95 NETHERLANDS: STRUCTURAL HEALTH MONITORING MARKET, BY TECHNOLOGY, 2020-2023 (USD MILLION)
- TABLE 96 NETHERLANDS: STRUCTURAL HEALTH MONITORING MARKET, BY TECHNOLOGY, 2024-2029 (USD MILLION)
- 11.3.7 REST OF EUROPE
- TABLE 97 REST OF EUROPE: STRUCTURAL HEALTH MONITORING MARKET, BY TECHNOLOGY, 2020-2023 (USD MILLION)
- TABLE 98 REST OF EUROPE: STRUCTURAL HEALTH MONITORING MARKET, BY TECHNOLOGY, 2024-2029 (USD MILLION)
- 11.4 ASIA PACIFIC
- 11.4.1 RECESSION IMPACT ON STRUCTURAL HEALTH MONITORING MARKET IN ASIA PACIFIC
- FIGURE 59 ASIA PACIFIC: RECESSION IMPACT ANALYSIS
- FIGURE 60 ASIA PACIFIC: STRUCTURAL HEALTH MONITORING MARKET SNAPSHOT
- TABLE 99 ASIA PACIFIC: STRUCTURAL HEALTH MONITORING MARKET, BY COUNTRY, 2020-2023 (USD MILLION)
- TABLE 100 ASIA PACIFIC: STRUCTURAL HEALTH MONITORING MARKET, BY COUNTRY, 2024-2029 (USD MILLION)
- TABLE 101 ASIA PACIFIC: STRUCTURAL HEALTH MONITORING MARKET, BY VERTICAL, 2020-2023 (USD MILLION)
- TABLE 102 ASIA PACIFIC: STRUCTURAL HEALTH MONITORING MARKET, BY VERTICAL, 2024-2029 (USD MILLION)
- TABLE 103 ASIA PACIFIC: STRUCTURAL HEALTH MONITORING MARKET, BY TECHNOLOGY, 2020-2023 (USD MILLION)
- TABLE 104 ASIA PACIFIC: STRUCTURAL HEALTH MONITORING MARKET, BY TECHNOLOGY, 2024-2029 (USD MILLION)
- TABLE 105 ASIA PACIFIC: STRUCTURAL HEALTH MONITORING MARKET, BY OFFERING, 2020-2023 (USD MILLION)
- TABLE 106 ASIA PACIFIC: STRUCTURAL HEALTH MONITORING MARKET, BY OFFERING, 2024-2029 (USD MILLION)
- TABLE 107 ASIA PACIFIC: STRUCTURAL HEALTH MONITORING MARKET FOR HARDWARE, BY TYPE, 2020-2023 (USD MILLION)
- TABLE 108 ASIA PACIFIC: STRUCTURAL HEALTH MONITORING MARKET FOR HARDWARE, BY TYPE, 2024-2029 (USD MILLION)
- 11.4.2 CHINA
- 11.4.2.1 Enforcement of strict regulations to ensure structural safety to drive market
- TABLE 109 CHINA: STRUCTURAL HEALTH MONITORING MARKET, BY TECHNOLOGY, 2020-2023 (USD MILLION)
- TABLE 110 CHINA: STRUCTURAL HEALTH MONITORING MARKET, BY TECHNOLOGY, 2024-2029 (USD MILLION)
- 11.4.3 JAPAN
- 11.4.3.1 High investments in large-scale infrastructure projects to expedite market growth
- TABLE 111 JAPAN: STRUCTURAL HEALTH MONITORING MARKET, BY TECHNOLOGY, 2020-2023 (USD MILLION)
- TABLE 112 JAPAN: STRUCTURAL HEALTH MONITORING MARKET, BY TECHNOLOGY, 2024-2029 (USD MILLION)
- 11.4.4 SOUTH KOREA
- 11.4.4.1 Increased skyscraper construction to contribute to market growth
- TABLE 113 SOUTH KOREA: STRUCTURAL HEALTH MONITORING MARKET, BY TECHNOLOGY, 2020-2023 (USD MILLION)
- TABLE 114 SOUTH KOREA: STRUCTURAL HEALTH MONITORING MARKET, BY TECHNOLOGY, 2024-2029 (USD MILLION)
- 11.4.5 INDIA
- 11.4.5.1 Government-led infrastructure investments to accelerate market growth
- TABLE 115 INDIA: STRUCTURAL HEALTH MONITORING MARKET, BY TECHNOLOGY, 2020-2023 (USD MILLION)
- TABLE 116 INDIA: STRUCTURAL HEALTH MONITORING MARKET, BY TECHNOLOGY, 2024-2029 (USD MILLION)
- 11.4.6 SINGAPORE
- 11.4.6.1 Construction of new subway lines to expedite market growth
- TABLE 117 SINGAPORE: STRUCTURAL HEALTH MONITORING MARKET, BY TECHNOLOGY, 2020-2023 (USD MILLION)
- TABLE 118 SINGAPORE: STRUCTURAL HEALTH MONITORING MARKET, BY TECHNOLOGY, 2024-2029 (USD MILLION)
- 11.4.7 REST OF ASIA PACIFIC
- TABLE 119 REST OF ASIA PACIFIC: STRUCTURAL HEALTH MONITORING MARKET, BY TECHNOLOGY, 2020-2023 (USD MILLION)
- TABLE 120 REST OF ASIA PACIFIC: STRUCTURAL HEALTH MONITORING MARKET, BY TECHNOLOGY, 2024-2029 (USD MILLION)
- 11.5 ROW
- 11.5.1 RECESSION IMPACT ON STRUCTURAL HEALTH MONITORING MARKET IN ROW
- FIGURE 61 ROW: RECESSION IMPACT ANALYSIS
- FIGURE 62 ROW: STRUCTURAL HEALTH MONITORING MARKET SNAPSHOT
- TABLE 121 ROW: STRUCTURAL HEALTH MONITORING MARKET, BY REGION, 2020-2023 (USD MILLION)
- TABLE 122 ROW: STRUCTURAL HEALTH MONITORING MARKET, BY REGION, 2024-2029 (USD MILLION)
- TABLE 123 ROW: STRUCTURAL HEALTH MONITORING MARKET, BY VERTICAL, 2020-2023 (USD MILLION)
- TABLE 124 ROW: STRUCTURAL HEALTH MONITORING MARKET, BY VERTICAL, 2024-2029 (USD MILLION)
- TABLE 125 ROW: STRUCTURAL HEALTH MONITORING MARKET, BY TECHNOLOGY, 2020-2023 (USD MILLION)
- TABLE 126 ROW: STRUCTURAL HEALTH MONITORING MARKET, BY TECHNOLOGY, 2024-2029 (USD MILLION)
- TABLE 127 ROW: STRUCTURAL HEALTH MONITORING MARKET, BY OFFERING, 2020-2023 (USD MILLION)
- TABLE 128 ROW: STRUCTURAL HEALTH MONITORING MARKET, BY OFFERING, 2024-2029 (USD MILLION)
- TABLE 129 ROW: STRUCTURAL HEALTH MONITORING MARKET FOR HARDWARE, BY TYPE, 2020-2023 (USD MILLION)
- TABLE 130 ROW: STRUCTURAL HEALTH MONITORING MARKET FOR HARDWARE, BY TYPE, 2024-2029 (USD MILLION)
- 11.5.2 SOUTH AMERICA
- 11.5.2.1 Rising construction of dams and bridges to contribute to market growth
- TABLE 131 SOUTH AMERICA: STRUCTURAL HEALTH MONITORING MARKET, BY TECHNOLOGY, 2020-2023 (USD MILLION)
- TABLE 132 SOUTH AMERICA: STRUCTURAL HEALTH MONITORING MARKET, BY TECHNOLOGY, 2024-2029 (USD MILLION)
- 11.5.3 MIDDLE EAST & AFRICA
- TABLE 133 MIDDLE EAST & AFRICA: STRUCTURAL HEALTH MONITORING MARKET, BY TECHNOLOGY, 2020-2023 (USD MILLION)
- TABLE 134 MIDDLE EAST & AFRICA: STRUCTURAL HEALTH MONITORING MARKET, BY TECHNOLOGY, 2024-2029 (USD MILLION)
- TABLE 135 MIDDLE EAST & AFRICA: STRUCTURAL HEALTH MONITORING MARKET, BY GEOGRAPHY, 2020-2023 (USD MILLION)
- TABLE 136 MIDDLE EAST & AFRICA: STRUCTURAL HEALTH MONITORING MARKET, BY GEOGRAPHY, 2024-2029 (USD MILLION)
- 11.5.3.1 GCC countries
- 11.5.3.1.1 Rising focus on managing essential infrastructure assets to propel market
- 11.5.3.2 Rest of Middle East & Africa
- 11.5.3.1 GCC countries
12 COMPETITIVE LANDSCAPE
- 12.1 OVERVIEW
- 12.2 STRATEGIES ADOPTED BY KEY PLAYERS, 2020-2023
- TABLE 137 OVERVIEW OF STRATEGIES ADOPTED BY KEY MID- AND HIGH-LEVEL PLAYERS IN STRUCTURAL HEALTH MONITORING MARKET, 2020-2023
- 12.3 REVENUE ANALYSIS OF KEY PLAYERS, 2019-2023
- FIGURE 63 REVENUE ANALYSIS OF FIVE KEY PLAYERS, 2019-2023
- 12.4 MARKET SHARE ANALYSIS, 2023
- FIGURE 64 STRUCTURAL HEALTH MONITORING MARKET SHARE ANALYSIS, 2023
- TABLE 138 STRUCTURAL HEALTH MONITORING MARKET: DEGREE OF COMPETITION, 2023
- 12.5 COMPANY VALUATION AND FINANCIAL METRICS
- FIGURE 65 COMPANY VALUATION, 2023 (USD BILLION)
- FIGURE 66 FINANCIAL METRICS (EV/EBITDA), 2023
- 12.6 BRAND/PRODUCT COMPARISON
- FIGURE 67 BRAND/PRODUCT COMPARISON
- 12.7 COMPANY EVALUATION MATRIX: KEY PLAYERS, 2023
- FIGURE 68 STRUCTURAL HEALTH MONITORING MARKET: COMPANY EVALUATION MATRIX (KEY PLAYERS), 2023
- 12.7.1 STARS
- 12.7.2 EMERGING LEADERS
- 12.7.3 PERVASIVE PLAYERS
- 12.7.4 PARTICIPANTS
- 12.7.5 COMPANY FOOTPRINT: KEY PLAYERS, 2023
- 12.7.5.1 Overall footprint
- FIGURE 69 STRUCTURAL HEALTH MONITORING MARKET: OVERALL FOOTPRINT
- 12.7.5.2 Offering footprint
- TABLE 139 STRUCTURAL HEALTH MONITORING MARKET: OFFERING FOOTPRINT
- 12.7.5.3 Technology footprint
- TABLE 140 STRUCTURAL HEALTH MONITORING MARKET: TECHNOLOGY FOOTPRINT
- 12.7.5.4 Vertical footprint
- TABLE 141 STRUCTURAL HEALTH MONITORING MARKET: VERTICAL FOOTPRINT
- 12.7.5.5 Region footprint
- TABLE 142 STRUCTURAL HEALTH MONITORING MARKET: REGION FOOTPRINT
- 12.8 COMPANY EVALUATION MATRIX: START-UPS/SMES, 2023
- FIGURE 70 STRUCTURAL HEALTH MONITORING: COMPANY EVALUATION MATRIX (START-UPS/SMES), 2023
- 12.8.1 PROGRESSIVE COMPANIES
- 12.8.2 RESPONSIVE COMPANIES
- 12.8.3 DYNAMIC COMPANIES
- 12.8.4 STARTING BLOCKS
- 12.8.5 COMPETITIVE BENCHMARKING: START-UPS/SMES, 2023
- 12.8.5.1 List of key start-ups/SMEs
- TABLE 143 STRUCTURAL HEALTH MONITORING MARKET: LIST OF KEY START-UPS/SMES
- 12.8.5.2 Competitive benchmarking of key start-ups/SMEs
- TABLE 144 STRUCTURAL HEALTH MONITORING MARKET: COMPETITIVE BENCHMARKING OF KEY START-UPS/SMES
- 12.9 COMPETITIVE SCENARIOS AND TRENDS
- 12.9.1 PRODUCT LAUNCHES
- TABLE 145 STRUCTURAL HEALTH MONITORING MARKET: PRODUCT LAUNCHES, MARCH 2020-DECEMBER 2023
- 12.9.2 DEALS
- TABLE 146 STRUCTURAL HEALTH MONITORING MARKET: DEALS, MARCH 2020-DECEMBER 2023
- 12.9.3 OTHERS
- TABLE 147 STRUCTURAL HEALTH MONITORING MARKET: OTHERS, MARCH 2020-DECEMBER 2023
13 COMPANY PROFILES
(Business Overview, Products/Solutions/Services Offered, Recent Developments, and MnM View (Key strengths/Right to Win, Strategic Choices Made, and Weaknesses and Competitive Threats))**
- 13.1 KEY PLAYERS
- 13.1.1 COWI A/S
- TABLE 148 COWI A/S: COMPANY OVERVIEW
- FIGURE 71 COWI A/S: COMPANY SNAPSHOT
- TABLE 149 COWI A/S: PRODUCTS/SOLUTIONS/SERVICES OFFERED
- TABLE 150 COWI A/S: DEALS
- TABLE 151 COWI A/S: OTHERS
- 13.1.2 CAMPBELL SCIENTIFIC, INC.
- TABLE 152 CAMPBELL SCIENTIFIC, INC.: COMPANY OVERVIEW
- TABLE 153 CAMPBELL SCIENTIFIC, INC.: PRODUCTS/SOLUTIONS/SERVICES OFFERED
- TABLE 154 CAMPBELL SCIENTIFIC, INC.: PRODUCT LAUNCHES
- TABLE 155 CAMPBELL SCIENTIFIC, INC.: DEALS
- 13.1.3 GEOKON
- TABLE 156 GEOKON: COMPANY OVERVIEW
- TABLE 157 GEOKON: PRODUCTS/SOLUTIONS/SERVICES OFFERED
- TABLE 158 GEOKON: PRODUCT LAUNCHES
- TABLE 159 GEOKON: DEALS
- 13.1.4 NOVA METRIX
- TABLE 160 NOVA METRIX: COMPANY OVERVIEW
- TABLE 161 NOVA METRIX: PRODUCTS/SOLUTIONS/SERVICES OFFERED
- TABLE 162 NOVA METRIX: PRODUCT LAUNCHES
- 13.1.5 SGS SA
- TABLE 163 SGS SA: COMPANY OVERVIEW
- FIGURE 72 SGS SA: COMPANY SNAPSHOT
- TABLE 164 SGS SA: PRODUCTS/SOLUTIONS/SERVICES OFFERED
- TABLE 165 SGS SA: DEALS
- 13.1.6 TRIMBLE INC.
- TABLE 166 TRIMBLE INC.: COMPANY OVERVIEW
- FIGURE 73 TRIMBLE INC.: COMPANY SNAPSHOT
- TABLE 167 TRIMBLE INC.: PRODUCTS/SOLUTIONS/SERVICES OFFERED
- TABLE 168 TRIMBLE INC.: PRODUCT LAUNCHES
- TABLE 169 TRIMBLE INC.: DEALS
- 13.1.7 SIXENSE
- TABLE 170 SIXENSE: COMPANY OVERVIEW
- TABLE 171 SIXENSE: PRODUCTS/SOLUTIONS/SERVICES OFFERED
- TABLE 172 SIXENSE: DEALS
- TABLE 173 SIXENSE: OTHERS
- 13.1.8 STRUCTURAL MONITORING SYSTEMS PLC.
- TABLE 174 STRUCTURAL MONITORING SYSTEMS PLC.: COMPANY OVERVIEW
- FIGURE 74 STRUCTURAL MONITORING SYSTEMS PLC.: COMPANY SNAPSHOT
- TABLE 175 STRUCTURAL MONITORING SYSTEMS PLC.: PRODUCTS/SOLUTIONS/SERVICES OFFERED
- 13.1.9 ACELLENT TECHNOLOGIES, INC.
- TABLE 176 ACELLENT TECHNOLOGIES, INC.: COMPANY OVERVIEW
- TABLE 177 ACELLENT TECHNOLOGIES, INC.: PRODUCTS/SOLUTIONS/SERVICES OFFERED
- 13.1.10 DIGITEXX DATA SYSTEMS, INC.
- TABLE 178 DIGITEXX DATA SYSTEMS, INC.: COMPANY OVERVIEW
- TABLE 179 DIGITEXX DATA SYSTEMS, INC.: PRODUCTS/SOLUTIONS/SERVICES OFFERED
- 13.2 OTHER PLAYERS
- 13.2.1 FIRST SENSOR AG
- 13.2.2 BDI
- 13.2.3 SISGEO
- 13.2.4 RST INSTRUMENTS LTD.
- 13.2.5 AVT RELIABILITY
- 13.2.6 GEOMOTION SINGAPORE
- 13.2.7 STRAINSTALL ( JAMES FISHER AND SONS PLC.)
- 13.2.8 HBK
- 13.2.9 KINEMETRICS
- 13.2.10 FEAC ENGINEERING P.C.
- 13.2.11 EFI GLOBAL, INC.
- 13.2.12 SENSURON
- 13.2.13 INFIBRA TECHNOLOGIES
- 13.2.14 SODIS LAB
- 13.2.15 SET POINT TECHNOLOGIES
- 13.2.16 MISTRAS GROUP
- 13.2.17 METIS DESIGN CORPORATION
- 13.2.18 GEOSIG LTD.
- *Details on Business Overview, Products/Solutions/Services Offered, Recent Developments, and MnM View (Key strengths/Right to Win, Strategic Choices Made, and Weaknesses and Competitive Threats) might not be captured in case of unlisted companies.
14 APPENDIX
- 14.1 INSIGHTS FROM INDUSTRY EXPERTS
- 14.2 DISCUSSION GUIDE
- 14.3 KNOWLEDGESTORE: MARKETSANDMARKETS' SUBSCRIPTION PORTAL
- 14.4 CUSTOMIZATION OPTIONS
- 14.5 RELATED REPORTS
- 14.6 AUTHOR DETAILS

