|
|
市場調査レポート
商品コード
1410011
ドライラボ写真印刷の世界市場:製品別、接続性別、印刷幅別、エンドユーザー別、地域別 - 予測(~2029年)Drylab Photo Printing Market by Offering (Printers, After-sales Services), Connectivity (Wired, Wireless), Print Width (Below 4 Inches, 4 Inches-6 Inches, Above 6 Inches), End-user (Consumer, Commercial) and Region - Global Forecast to 2029 |
||||||
|
|
|||||||
|
● お客様のご希望に応じて、既存データの加工や未掲載情報(例:国別セグメント)の追加などの対応が可能です。 詳細はお問い合わせください。 |
|||||||


| ドライラボ写真印刷の世界市場:製品別、接続性別、印刷幅別、エンドユーザー別、地域別 - 予測(~2029年) |
|
出版日: 2024年01月12日
発行: MarketsandMarkets
ページ情報: 英文 180 Pages
納期: 即納可能
|
- 全表示
- 概要
- 目次
レポートの概要
| 調査範囲 | |
|---|---|
| 調査対象年 | 2020年~2029年 |
| 基準年 | 2023年 |
| 予測期間 | 2024年~2029年 |
| 単位 | 10億米ドル |
| セグメント | 提供別、接続性別、印刷幅別、エンドユーザー別、地域別 |
| 対象地域 | 北米、欧州、アジア太平洋、その他の地域 |
世界のドライラボ写真印刷の市場規模は、2024年の3億米ドルから2029年までに4億米ドルに達し、2024年~2029年にCAGRで5.4%の成長が予測されています。
パーソナライズされたギフトに対する需要の増加が、市場の成長に大きく寄与しています。今日、消費者はユニークなカスタマイズされた商品を求めており、この動向は贈答にも及んでいます。カスタムプリントされた写真製品のようなパーソナライズされたギフトは、人々がプレゼントに個性を加えることを可能にし、それらをより意義深く記憶に残るものとします。
ドライラボ写真印刷技術は、この需要に応える上で重要な役割を果たしています。従来のウェットラボ印刷方法とは異なり、ドライラボ写真印刷には、処理時間の短縮、効率の向上、画質の向上などの利点があります。これらの利点により、大規模なパーソナライズされたフォトギフトの作成に理想的な選択肢となっています。
ドライラボ写真印刷市場は、企業や消費者が高品質なカスタマイズされた写真製品の価値を認識するにつれて、人気が急上昇しています。ドライラボ印刷技術は、パーソナライズされたフォトアルバム、キャンバスプリントなどのクリエイティブな商品を、迅速かつ正確に生産することを可能にします。オンラインの注文・印刷サービスにより、パーソナライズされたフォトギフトの作成と注文がこれまで以上に簡単になりました。これにより、ドライラボ写真印刷は消費者にとってさらに魅力的なものとなっています。これらの要因に加え、パーソナライズされたギフトへの需要の向上は、ソーシャルメディアの人気の高まりにも後押しされています。人々は自分の写真をソーシャルメディアで共有する機会が増えており、写真を印刷して友人や家族と共有したいという欲求が高まっています。こうした動向の結果、市場は今後数年間に大きく成長すると予測されます。この成長は、パーソナライズされたフォトギフトに対する需要の増加と、新しく革新的なドライラボ印刷技術の継続的な開発によって促進されます。
「消費者エンドユーザーが予測期間にもっとも高いCAGRで成長する見込みです。」
消費者エンドユーザーセグメントは、パーソナライズされた高品質な印刷体験を求める個人ユーザーからなります。このセグメントでは、消費者はドライラボ技術の能力を活用し、デジタル画像を形のある視覚的に美しい印刷物へと変えます。これは単なる複製にとどまらず、個人がカスタムフォトアルバムを作ったり、大切な思い出を額装したり、家庭装飾向けに芸術的な印刷物を作ったりするクリエイティブなプロセスとも関わっています。オンデマンド印刷の利便性は消費者にとって大きな魅力であり、デジタルファイルを簡単にアップロードし、印刷サイズや材料を選択し、玄関先まで直接印刷物を届けることができます。このセグメントはまた、フォトブックやパーソナライズされたギフトなど、記念品の作成にも表現を見出しており、特別な日のための有意義な記念品として役立っています。消費者エンドユーザーセグメントに含まれるアーティストや写真愛好家は、色やディテールの完全性を維持しながら、芸術作品を高い精度で忠実に再現できるドライラボ印刷を高く評価しています。品質、耐久性、印刷オプションの多様性を重視するドライラボ写真印刷は、視覚的なアイデアに命を吹き込むシームレスでインパクトのある方法を求める消費者に支持されています。
当レポートでは、世界のドライラボ写真印刷市場について調査分析し、主な促進要因と抑制要因、競合情勢、将来の動向などの情報を提供しています。
目次
第1章 イントロダクション
第2章 調査手法
第3章 エグゼクティブサマリー
第4章 重要考察
- ドライラボ写真印刷市場の企業にとって魅力的な機会
- ドライラボ写真印刷市場:エンドユーザー別
- 商用エンドユーザー向けドライラボ写真印刷市場:提供別
- ドライラボ写真印刷市場:地域別
第5章 市場の概要
- イントロダクション
- 市場力学
- 促進要因
- 抑制要因
- 機会
- 課題
- 顧客のビジネスに影響を与える動向/混乱
- 価格分析
- 主な会議とイベント
- サプライチェーン分析
- エコシステム/市場マップ
- 技術分析
- 画像処理技術
- 持続可能性技術
- 特殊効果
- 特許分析
- ケーススタディ分析
- 貿易分析
- 輸入データ
- 輸出データ
- 関税、基準、規制情勢
- 関税
- 規制機関、政府機関、その他の組織
- 規格
- ポーターのファイブフォース分析
- 主なステークホルダーと購入基準
第6章 ドライラボ写真印刷で使用される紙の種類
- イントロダクション
- グロッシー
- ラスター
- シルク
- パール
- その他
- サテン
- マット
- メタリック
第7章 ドライラボ写真印刷市場:提供別
- イントロダクション
- プリンター
- アフターサービス
第8章 ドライラボ写真印刷市場:接続性別
- イントロダクション
- 有線
- 無線
第9章 ドライラボ写真印刷市場:印刷幅別
- イントロダクション
- 4インチ未満
- 4~6インチ
- 6インチ超
第10章 ドライラボ写真印刷市場:エンドユーザー別
- イントロダクション
- 非商用
- 商用
- 小売店
- 写真研究所
- ギフトショップ
- その他
第11章 ドライラボ写真印刷市場:地域別
- イントロダクション
- 北米
- 北米のドライラボ写真印刷市場に対する景気後退の影響
- 米国
- カナダ
- メキシコ
- 欧州
- 欧州のドライラボ写真印刷市場に対する不況の影響
- 英国
- ドイツ
- フランス
- その他の欧州
- アジア太平洋
- アジア太平洋のドライラボ写真印刷市場に対する不況の影響
- 中国
- 日本
- 韓国
- インド
- その他のアジア太平洋
- その他の地域
- その他の地域のドライラボ写真印刷市場に対する不況の影響
- 中東・アフリカ
- 南米
第12章 競合情勢
- 概要
- 主要企業が採用した戦略(2019年~2023年)
- 市場シェア分析(2023年)
- 収益分析(2019年~2023年)
- 企業の評価マトリクス(2023年)
- 競合シナリオと動向
第13章 企業プロファイル
- イントロダクション
- 主要企業
- SEIKO EPSON CORPORATION
- DAI NIPPON PRINTING CO., LTD.
- FUJIFILM CORPORATION
- NORITSU PRECISION CO., LTD.
- KODAK ALARIS INC.
- HITI DIGITAL, INC.
- CANON INC.
- HP DEVELOPMENT COMPANY, L.P.
- SINFONIA TECHNOLOGY CO., LTD.
- CITIZEN SYSTEMS JAPAN CO., LTD.
- その他の企業
- POLAROID CORPORATION
- MITSUBISHI ELECTRIC CORPORATION
- RICOH
第14章 付録
Report Description
| Scope of the Report | |
|---|---|
| Years Considered for the Study | 2020-2029 |
| Base Year | 2023 |
| Forecast Period | 2024-2029 |
| Units Considered | Value (USD Billion) |
| Segments | By Offering, Connectivity, Print Width, End-user, and Region |
| Regions covered | North America, Europe, Asia Pacific, RoW |
The drylab photo printing market is expected to reach USD 0.4 billion by 2029 from 0.3 billion in 2024, at a CAGR of 5.4% during the 2024-2029 period. The increasing demand for personalized gifts has significantly contributed to the growth of the drylab photo printing market. Consumers today seek unique and customized items, and this trend has extended to gift-giving. Personalized gifts, such as custom-printed photo products, allow individuals to add a personal touch to their presents, making them more meaningful and memorable.
Drylab photo printing technology plays a crucial role in meeting this demand. Unlike traditional wet lab printing methods, drylab photo printing offers several advantages, including faster processing times, greater efficiency, and enhanced image quality. These benefits make it an ideal choice for creating personalized photo gifts on a large scale.
The market for drylab photo printing has witnessed a surge in popularity as businesses and consumers alike recognize the value of high-quality, customized photo products. Whether it's personalized photo albums, canvas prints, or other creative items, drylab printing technology enables the production of these goods with speed and precision. Online ordering and printing services have made creating and ordering personalized photo gifts easier than ever. This has made drylab photo printing even more attractive to consumers. In addition to these factors, the rising demand for personalized gifts is also driven by social media's growing popularity. People are increasingly sharing their photos on social media, which has led to a greater desire to print them out and share them with friends and family. As a result of these trends, the drylab photo printing market is expected to grow significantly in the coming years. This growth will be driven by increasing demand for personalized photo gifts and the continued development of new and innovative drylab printing technologies.
"Consumer end user is expected to grow at the highest CAGR in the forecast period."
The consumer end-user segment of drylab photo printing comprises individual users seeking a personalized, high-quality printing experience. In this segment, consumers tap into the capabilities of drylab technology to transform their digital images into tangible and visually stunning prints. This goes beyond mere replication; it involves a creative process where individuals craft custom photo albums, frame cherished memories, and produce artistic prints for home decor. The convenience of on-demand printing is a significant draw for consumers, allowing them to easily upload digital files, select print sizes and materials, and deliver their prints directly to their doorstep. This segment also finds expression in the creation of memorabilia and keepsakes, such as photo books and personalized gifts, serving as meaningful mementos for special occasions. Artists and photography enthusiasts within the consumer end segment appreciate drylab printing for its ability to reproduce their artistic work faithfully with high precision, maintaining the integrity of colors and details. The emphasis on quality, durability, and versatility in print options makes drylab photo printing a favored choice for consumers seeking a seamless and impactful way to bring their visual ideas to life.
"Europe recorded the second highest market share in the drylab photo printing market for 2022."
Europe's drylab photo printing market reflects a dynamic landscape shaped by a convergence of technological innovation, consumer preferences, and environmental considerations. Kodak Alaris Inc. is the leading European company that offers drylab photo printing. The UK, Germany, and France are key contributors to the growth of the European drylab photo printing market.
"After-sales services of drylab photo printing by offering is projected to grow at the highest CAGR during the forecast period."
After-sales services for dry lab photo printers are crucial for ensuring these machines' continued optimal performance and productivity. These services encompass a range of activities aimed at providing comprehensive support to customers, addressing any issues promptly, and maximizing the overall satisfaction with the printer. After-sales services pertaining to drylab photo printers include support services and repair and maintenance service agreements. These services play a significant role in maintaining the low operating costs of printing equipment. In case of an equipment breakdown, on-time support plays a critical role as the printing process may lead to financial losses if held for a longer time. Major manufacturers of drylab photo printers focus on having a strong footprint of offices, sales and distribution networks, and after-sales and support networks worldwide.
Primarily, all drylab photo printer providers give telephonic support. Services of drylab photo printers can be offered at service providers' premises or on the site, depending on the type of printer. Repairing services include servicing and repairing drylab photo printing devices and replacing faulty parts, if required. Most printer providers also sign a maintenance agreement with buyers to provide on-site support for printing equipment and frequent maintenance and repair requirements, among many other services, all included in the agreed periodic maintenance cost.
In addition to these general services, some manufacturers offer extended warranty coverage and on-demand service packages tailored to specific needs and usage patterns. By investing in comprehensive after-sales services, dry lab photo printer owners can maximize their investment and ensure their equipment's long-term reliability and value.
"US is expected to have the largest market share in the North America region for drylab photo printing in the forecast period."
The drylab photo printing market in the US has experienced substantial growth, driven by a combination of technological advancements, shifting consumer preferences, and the dynamic nature of the photography and creative industries. The rapid adoption of digital technologies and the convenience of drylab printing have played a crucial role in the market's expansion. Consumers in the US are drawn to the efficiency and high-quality results that drylab printing provides, aligning with the nation's penchant for cutting-edge technologies. Additionally, the trend towards customization and personalization in photo products has fueled the popularity of drylab printing, offering flexibility in print sizes, formats, and media types. The US market, with its vibrant photography and creative sectors, has seen professionals and enthusiasts alike embracing drylab technology to showcase their work with gallery-quality prints. Moreover, the environmentally conscious practices associated with drylab printing contribute to its appeal in a market where sustainability is gaining prominence. Overall, the US drylab photo printing market reflects technological innovation, consumer preferences, and business opportunities.
In March 2022, FUJIFILM Imaging Colorants, Inc. (US), a significant contributor to inkjet ink technology, disclosed that its parent company, Fujifilm, invested $28 million in a new facility in New Castle, Delaware. This investment aimed to double Fujifilm's US. production capacity of pigment dispersions, addressing the growing global demand for aqueous inkjet dispersions utilized in inkjet printing.
In May 2019, DNP Imagingcomm America Corporation (DNP IAM) has revealed a partnership with Sign Supply (US), designating them as the exclusive authorized distributor in Bogota, Colombia. In this partnership, Sign Supply will provide expert guidance, service, and support for DNP's entire range of acclaimed dye-sublimation printers and accessories. This collaboration aims to cater to the needs of both new and existing customers across the Colombian territory.
The break-up of the profile of primary participants in the drylab photo printing market-
- By Company Type: Tier 1 - 30%, Tier 2 - 50%, Tier 3 - 20%
- By Designation Type: C Level - 25%, Director Level - 35%, Others - 40%
- By Region Type: North America - 35%, Europe -30 %, Asia Pacific - 25%, RoW - 10%,
The major players in the drylab photo printing market are Seiko Epson Corporation (Japan), Dai Nippon Printing Co., Ltd. (Japan), FUJIFILM Corporation (Japan), Noritsu Koki Co., Ltd. (Japan), Kodak Alaris Inc. (UK), HiTi Digital, Inc. (Taiwan), Canon Inc. (Japan), HP Development Company, L.P. (US), Sinfonia Technology Co., Ltd. (Japan), Citizen Systems Japan Co., Ltd. (Japan), Polaroid Corporation (US), Mitsubishi Electric Corporation (Japan), and Ricoh (Japan).
Research Coverage
The report segments the drylab photo printing market and forecasts its size based and region. The report also provides a comprehensive review of drivers, restraints, opportunities, and challenges influencing market growth. The report also covers qualitative aspects in addition to the quantitative aspects of the market.
Reasons to buy the report:
The report will help the market leaders/new entrants with information on the closest approximate revenues for the drylab photo printing market and related segments. This report will help stakeholders understand the competitive landscape and gain more insights to strengthen their position in the market and plan suitable go-to-market strategies. The report also helps stakeholders understand the pulse of the market and provides them with information on key market drivers, restraints, opportunities, and challenges.
The report provides insights on the following pointers:
- Analysis of key drivers (advancement in printing technology), restraints (data security and privacy concerns), opportunities (growing demand for sustainable systems for high-quality photographic printing), and challenges (competition from online services)
- Product Development/Innovation: Detailed insights on upcoming technologies, research and development activities, and new product launches in the drylab photo printing market
- Market Development: Comprehensive information about lucrative markets - the report analyses the drylab photo printing market across varied regions.
- Market Diversification: Exhaustive information about new products, untapped geographies, recent developments, and investments in the drylab photo printing market.
- Competitive Assessment: In-depth assessment of market shares, growth strategies, and product offerings of leading players like FUJIFILM Corporation (Japan), Seiko Epson Corporation (Japan), Dai Nippon Printing Co., Ltd. (Japan), ), Kodak Alaris Inc. (UK), HP Development Company, L.P. (US), and many more.
TABLE OF CONTENTS
1 INTRODUCTION
- 1.1 STUDY OBJECTIVES
- 1.2 MARKET DEFINITION
- 1.2.1 INCLUSIONS AND EXCLUSIONS
- 1.3 STUDY SCOPE
- 1.3.1 MARKETS COVERED
- FIGURE 1 DRYLAB PHOTO PRINTING MARKET: SEGMENTATION
- 1.3.2 REGIONAL SCOPE
- 1.3.3 YEARS CONSIDERED
- 1.3.4 CURRENCY CONSIDERED
- 1.3.5 UNITS CONSIDERED
- 1.4 LIMITATIONS
- 1.5 STAKEHOLDERS
- 1.6 RECESSION IMPACT
2 RESEARCH METHODOLOGY
- 2.1 RESEARCH DATA
- FIGURE 2 DRYLAB PHOTO PRINTING MARKET: RESEARCH DESIGN
- 2.1.1 SECONDARY DATA
- 2.1.1.1 List of key secondary sources
- 2.1.1.2 Key data from secondary sources
- 2.1.2 PRIMARY DATA
- 2.1.2.1 List of key primary interview participants
- 2.1.2.2 Key data from primary sources
- 2.1.2.3 Breakdown of primary interviews
- 2.1.2.4 Key industry insights
- 2.1.3 SECONDARY AND PRIMARY RESEARCH
- 2.2 MARKET SIZE ESTIMATION
- FIGURE 3 MARKET SIZE ESTIMATION METHODOLOGY: APPROACH 1 (SUPPLY SIDE)-REVENUE GENERATED BY KEY PLAYERS IN DRYLAB PHOTO PRINTING MARKET
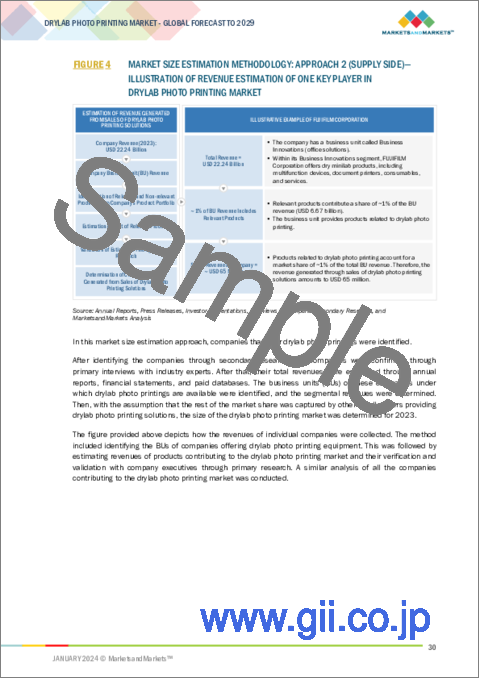
- FIGURE 4 MARKET SIZE ESTIMATION METHODOLOGY: APPROACH 2 (SUPPLY SIDE)-ILLUSTRATION OF REVENUE ESTIMATION OF ONE KEY PLAYER IN DRYLAB PHOTO PRINTING MARKET
- FIGURE 5 MARKET SIZE ESTIMATION METHODOLOGY: APPROACH 3 (DEMAND SIDE)-BOTTOM-UP ESTIMATION OF DRYLAB PHOTO PRINTING MARKET PENETRATION BASED ON REGION
- 2.2.1 BOTTOM-UP APPROACH
- 2.2.1.1 Approach to estimate market size using bottom-up analysis
- FIGURE 6 MARKET SIZE ESTIMATION METHODOLOGY: BOTTOM-UP APPROACH
- 2.2.2 TOP-DOWN APPROACH
- 2.2.2.1 Approach to estimate market size using top-down analysis
- FIGURE 7 MARKET SIZE ESTIMATION METHODOLOGY: TOP-DOWN APPROACH
- 2.3 DATA TRIANGULATION
- FIGURE 8 DATA TRIANGULATION
- 2.4 RISK ASSESSMENT
- TABLE 1 RISK FACTOR ANALYSIS
- 2.5 PARAMETERS CONSIDERED TO ANALYZE IMPACT OF RECESSION ON DRYLAB PHOTO PRINTING MARKET
- 2.6 RESEARCH ASSUMPTIONS AND LIMITATIONS
- 2.6.1 ASSUMPTIONS
- 2.6.2 LIMITATIONS
3 EXECUTIVE SUMMARY
- FIGURE 9 DRYLAB PHOTO PRINTING MARKET, 2020-2029
- FIGURE 10 PRINTERS TO HOLD LARGER MARKET SHARE IN 2029
- FIGURE 11 4 TO 6 INCHES PRINT WIDTH SEGMENT TO ACCOUNT FOR LARGEST MARKET SHARE IN 2029
- FIGURE 12 WIRELESS TECHNOLOGIES TO RECORD HIGHER CAGR DURING FORECAST PERIOD
- FIGURE 13 DRYLAB PHOTO PRINTING MARKET IN ASIA PACIFIC TO EXHIBIT FASTEST GROWTH DURING FORECAST PERIOD
4 PREMIUM INSIGHTS
- 4.1 ATTRACTIVE OPPORTUNITIES FOR PLAYERS IN DRYLAB PHOTO PRINTING MARKET
- FIGURE 14 INCREASING DEMAND FOR PERSONALIZED PHOTO PRINTING IN ASIA PACIFIC TO CREATE LUCRATIVE GROWTH OPPORTUNITIES
- 4.2 DRYLAB PHOTO PRINTING MARKET, BY END USER
- FIGURE 15 COMMERCIAL END USERS SEGMENT TO DOMINATE MARKET IN 2029
- 4.3 DRYLAB PHOTO PRINTING MARKET FOR COMMERCIAL END USERS, BY OFFERING
- FIGURE 16 AFTER-SALES SERVICES SEGMENT TO REGISTER HIGHER CAGR DURING FORECAST PERIOD
- 4.4 DRYLAB PHOTO PRINTING MARKET, BY REGION
- FIGURE 17 DRYLAB PHOTO PRINTING MARKET IN INDIA TO EXHIBIT HIGHEST CAGR DURING FORECAST PERIOD
5 MARKET OVERVIEW
- 5.1 INTRODUCTION
- 5.2 MARKET DYNAMICS
- FIGURE 18 DRYLAB PHOTO PRINTING MARKET: DRIVERS, RESTRAINTS, OPPORTUNITIES, AND CHALLENGES
- 5.2.1 DRIVERS
- FIGURE 19 DRYLAB PHOTO PRINTING MARKET: DRIVERS AND THEIR IMPACT
- 5.2.1.1 Rise in popularity of digital photography
- 5.2.1.2 Low operational cost and high photo printing flexibility
- 5.2.1.3 Heightened demand for personalized products
- 5.2.1.4 Rapid advancements in inkjet technology
- 5.2.2 RESTRAINTS
- FIGURE 20 DRYLAB PHOTO PRINTING MARKET: RESTRAINTS AND THEIR IMPACT
- 5.2.2.1 Data security and privacy concerns
- 5.2.2.2 High initial investment
- 5.2.3 OPPORTUNITIES
- FIGURE 21 DRYLAB PHOTO PRINTING MARKET: OPPORTUNITIES AND THEIR IMPACT
- 5.2.3.1 Growing demand for sustainable solutions for high-quality photographic printing
- 5.2.3.2 Expansion of in-plant printing operations
- 5.2.4 CHALLENGES
- FIGURE 22 DRYLAB PHOTO PRINTING MARKET: CHALLENGES AND THEIR IMPACT
- 5.2.4.1 Emergence of web-based photo printing platforms
- 5.3 TRENDS/DISRUPTIONS IMPACTING CUSTOMERS' BUSINESSES
- FIGURE 23 DRYLAB PHOTO PRINTING MARKET: TRENDS/DISRUPTIONS IMPACTING CUSTOMERS' BUSINESSES
- 5.4 PRICING ANALYSIS
- FIGURE 24 AVERAGE SELLING PRICE OF DRYLAB PHOTO PRINTERS OFFERED BY TOP THREE PLAYERS, 2023 (USD)
- TABLE 2 AVERAGE SELLING PRICE OF DRYLAB PHOTO PRINTERS OFFERED BY TOP THREE PLAYERS, 2020-2023 (USD)
- TABLE 3 INDICATIVE PRICING OF DRYLAB PHOTO PRINTERS, BY REGION, 2023 (USD)
- 5.5 KEY CONFERENCES AND EVENTS
- TABLE 4 DRYLAB PHOTO PRINTING MARKET: LIST OF KEY CONFERENCES AND EVENTS, 2023-2024
- 5.6 SUPPLY CHAIN ANALYSIS
- FIGURE 25 DRYLAB PHOTO PRINTING MARKET: SUPPLY CHAIN ANALYSIS
- 5.7 ECOSYSTEM/MARKET MAP
- FIGURE 26 KEY PLAYERS IN DRYLAB PHOTO PRINTING ECOSYSTEM
- TABLE 5 ROLE OF PARTICIPANTS IN DRYLAB PHOTO PRINTING ECOSYSTEM
- 5.8 TECHNOLOGY ANALYSIS
- 5.8.1 IMAGE PROCESSING TECHNOLOGY
- 5.8.2 SUSTAINABLE TECHNOLOGY
- 5.8.3 SPECIAL EFFECTS
- 5.9 PATENT ANALYSIS
- TABLE 6 DRYLAB PHOTO PRINTING MARKET: LIST OF MAJOR PATENTS, 2022-2023
- FIGURE 27 DRYLAB PHOTO PRINTING MARKET: PATENTS APPLIED AND GRANTED, 2013-2022
- FIGURE 28 DRYLAB PHOTO PRINTING MARKET: REGIONAL ANALYSIS OF PATENTS, 2022
- 5.10 CASE STUDY ANALYSIS
- 5.10.1 SYNERGIE PHOTO INVESTS IN EPSON SURELAB SL-D3000 DIGITAL PHOTO LAB TO INCREASE PRODUCTION CAPACITY
- 5.10.2 FOTO FIRST BRITS INSTALLS EPSON SURELAB D3000 DR DRY LAB FOR FASTER, ECO-FRIENDLY PRINTING
- 5.10.3 PHOTO STUDIO OWNER DEPLOYS DRY LAB PRINTERS TO ENABLE FASTER PRINTING
- 5.10.4 MUNRO PHARMACY ENHANCES PRINTING CAPABILITIES WITH EPSON SURELAB D3000 PRINTER
- 5.10.5 FRAMING SUCCESS SWITCHES TO DRYLAB PRINTER USING EPSON SL-D3000 PRINTER TO OVERCOME CHALLENGES ASSOCIATED WITH WET LAB PRINTING
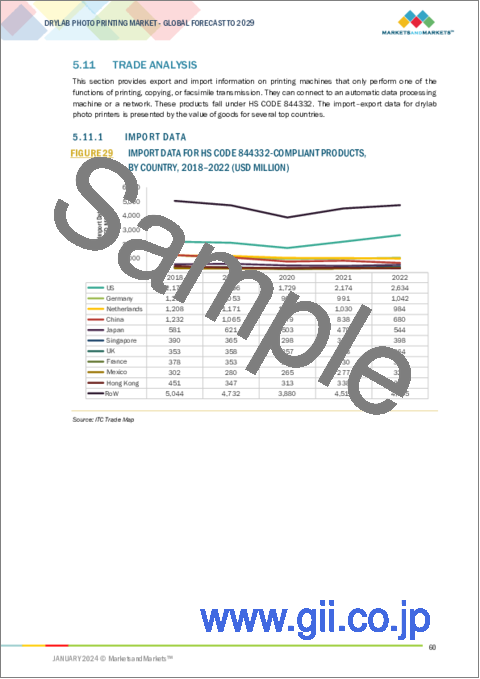
- 5.11 TRADE ANALYSIS
- 5.11.1 IMPORT DATA
- FIGURE 29 IMPORT DATA FOR HS CODE 844332-COMPLIANT PRODUCTS, BY COUNTRY, 2018-2022 (USD MILLION)
- TABLE 7 IMPORT DATA FOR HS CODE 844332-COMPLIANT PRODUCTS, BY COUNTRY, 2018-2022 (USD MILLION)
- 5.11.2 EXPORT DATA
- FIGURE 30 EXPORT DATA FOR HS CODE 844332-COMPLIANT PRODUCTS, BY COUNTRY, 2018-2022 (USD MILLION)
- TABLE 8 EXPORT DATA FOR HS CODE 844332-COMPLIANT PRODUCTS, BY COUNTRY, 2018-2022 (USD MILLION)
- 5.12 TARIFF, STANDARDS, AND REGULATORY LANDSCAPE
- 5.12.1 TARIFF
- TABLE 9 MFN TARIFF FOR HS CODE 844332-COMPLIANT PRODUCTS EXPORTED BY CHINA (2022)
- 5.12.2 REGULATORY BODIES, GOVERNMENT AGENCIES, AND OTHER ORGANIZATIONS
- TABLE 10 NORTH AMERICA: LIST OF REGULATORY BODIES, GOVERNMENT AGENCIES, AND OTHER ORGANIZATIONS
- TABLE 11 EUROPE: LIST OF REGULATORY BODIES, GOVERNMENT AGENCIES, AND OTHER ORGANIZATIONS
- TABLE 12 ASIA PACIFIC: LIST OF REGULATORY BODIES, GOVERNMENT AGENCIES, AND OTHER ORGANIZATIONS
- TABLE 13 ROW: LIST OF REGULATORY BODIES, GOVERNMENT AGENCIES, AND OTHER ORGANIZATIONS
- 5.12.3 STANDARDS
- 5.13 PORTER'S FIVE FORCES ANALYSIS
- TABLE 14 DRYLAB PHOTO PRINTING MARKET: PORTER'S FIVE FORCES ANALYSIS
- FIGURE 31 DRYLAB PHOTO PRINTING MARKET: PORTER'S FIVE FORCES ANALYSIS
- 5.13.1 THREAT OF NEW ENTRANTS
- 5.13.2 THREAT OF SUBSTITUTES
- 5.13.3 BARGAINING POWER OF SUPPLIERS
- 5.13.4 BARGAINING POWER OF BUYERS
- 5.13.5 INTENSITY OF COMPETITIVE RIVALRY
- 5.14 KEY STAKEHOLDERS AND BUYING CRITERIA
- 5.14.1 KEY STAKEHOLDERS IN BUYING PROCESS
- FIGURE 32 INFLUENCE OF STAKEHOLDERS ON BUYING PROCESS, BY END USER
- TABLE 15 INFLUENCE OF STAKEHOLDERS ON BUYING PROCESS, BY END USER (%)
- 5.14.2 KEY BUYING CRITERIA
- FIGURE 33 KEY BUYING CRITERIA, BY END USER
- TABLE 16 KEY BUYING CRITERIA, BY END USER
6 PAPER TYPES USED IN DRYLAB PHOTO PRINTING
- 6.1 INTRODUCTION
- 6.2 GLOSSY
- 6.3 LUSTER
- 6.4 SILK
- 6.5 PEARL
- 6.6 OTHERS
- 6.6.1 SATIN
- 6.6.2 MATTE
- 6.6.3 METALLIC
7 DRYLAB PHOTO PRINTING MARKET, BY OFFERING
- 7.1 INTRODUCTION
- FIGURE 34 PRINTERS TO ACCOUNT FOR LARGER MARKET SHARE IN 2029
- TABLE 17 DRYLAB PHOTO PRINTING MARKET, BY OFFERING, 2020-2023 (USD MILLION)
- TABLE 18 DRYLAB PHOTO PRINTING MARKET, BY OFFERING, 2024-2029 (USD MILLION)
- 7.2 PRINTERS
- 7.2.1 INCREASED DEMAND FOR FAST, EFFICIENT, AND SUSTAINABLE PRINTERS TO DRIVE MARKET
- TABLE 19 PRINTERS: DRYLAB PHOTO PRINTING MARKET, 2020-2023 (THOUSAND UNITS)
- TABLE 20 PRINTERS: DRYLAB PHOTO PRINTING MARKET, 2024-2029 (THOUSAND UNITS)
- TABLE 21 PRINTERS: DRYLAB PHOTO PRINTING MARKET, BY END USER, 2020-2023 (USD MILLION)
- TABLE 22 PRINTERS: DRYLAB PHOTO PRINTING MARKET, BY END USER, 2024-2029 (USD MILLION)
- FIGURE 35 ASIA PACIFIC TO HOLD LARGEST MARKET SHARE FOR PRINTERS IN 2029
- TABLE 23 PRINTERS: DRYLAB PHOTO PRINTING MARKET, BY REGION, 2020-2023 (USD MILLION)
- TABLE 24 PRINTERS: DRYLAB PHOTO PRINTING MARKET, BY REGION, 2024-2029 (USD MILLION)
- TABLE 25 PRINTERS: DRYLAB PHOTO PRINTING MARKET IN NORTH AMERICA, BY COUNTRY, 2020-2023 (USD MILLION)
- TABLE 26 PRINTERS: DRYLAB PHOTO PRINTING MARKET IN NORTH AMERICA, BY COUNTRY, 2024-2029 (USD MILLION)
- TABLE 27 PRINTERS: DRYLAB PHOTO PRINTING MARKET IN EUROPE, BY COUNTRY, 2020-2023 (USD MILLION)
- TABLE 28 PRINTERS: DRYLAB PHOTO PRINTING MARKET IN EUROPE, BY COUNTRY, 2024-2029 (USD MILLION)
- TABLE 29 PRINTERS: DRYLAB PHOTO PRINTING MARKET IN ASIA PACIFIC, BY COUNTRY, 2020-2023 (USD MILLION)
- TABLE 30 PRINTERS: DRYLAB PHOTO PRINTING MARKET IN ASIA PACIFIC, BY COUNTRY, 2024-2029 (USD MILLION)
- TABLE 31 PRINTERS: DRYLAB PHOTO PRINTING MARKET IN ROW, BY REGION, 2020-2023 (USD MILLION)
- TABLE 32 PRINTERS: DRYLAB PHOTO PRINTING MARKET IN ROW, BY REGION, 2024-2029 (USD MILLION)
- TABLE 33 PRINTERS: DRYLAB PHOTO PRINTING MARKET FOR NON-COMMERCIAL END USERS, BY REGION, 2020-2023 (USD MILLION)
- TABLE 34 PRINTERS: DRYLAB PHOTO PRINTING MARKET FOR NON-COMMERCIAL END USERS, BY REGION, 2024-2029 (USD MILLION)
- TABLE 35 PRINTERS: DRYLAB PHOTO PRINTING MARKET FOR COMMERCIAL END USERS, BY REGION, 2020-2023 (USD MILLION)
- TABLE 36 PRINTERS: DRYLAB PHOTO PRINTING MARKET FOR COMMERCIAL END USERS, BY REGION, 2024-2029 (USD MILLION)
- 7.3 AFTER-SALE SERVICES
- 7.3.1 NECESSITY TO MAINTAIN PERFORMANCE OF DRYLAB PHOTO PRINTERS TO BOOST DEMAND
- TABLE 37 AFTER-SALES SERVICES: DRYLAB PHOTO PRINTING MARKET, BY END USER, 2020-2023 (USD MILLION)
- TABLE 38 AFTER-SALES SERVICES: DRYLAB PHOTO PRINTING MARKET, BY END USER, 2024-2029 (USD MILLION)
- FIGURE 36 ASIA PACIFIC TO DOMINATE MARKET FOR AFTER-SALES SERVICES IN 2029
- TABLE 39 AFTER-SALES SERVICES: DRYLAB PHOTO PRINTING MARKET, BY REGION, 2020-2023 (USD MILLION)
- TABLE 40 AFTER-SALES SERVICES: DRYLAB PHOTO PRINTING MARKET, BY REGION, 2024-2029 (USD MILLION)
- TABLE 41 AFTER-SALES SERVICES: DRYLAB PHOTO PRINTING MARKET IN NORTH AMERICA, BY COUNTRY, 2020-2023 (USD MILLION)
- TABLE 42 AFTER-SALES SERVICES: DRYLAB PHOTO PRINTING MARKET IN NORTH AMERICA, BY COUNTRY, 2024-2029 (USD MILLION)
- TABLE 43 AFTER-SALES SERVICES: DRYLAB PHOTO PRINTING MARKET IN EUROPE, BY COUNTRY, 2020-2023 (USD MILLION)
- TABLE 44 AFTER-SALES SERVICES: DRYLAB PHOTO PRINTING MARKET IN EUROPE, BY COUNTRY, 2024-2029 (USD MILLION)
- TABLE 45 AFTER-SALES SERVICES: DRYLAB PHOTO PRINTING MARKET IN ASIA PACIFIC, BY COUNTRY, 2020-2023 (USD MILLION)
- TABLE 46 AFTER-SALES SERVICES: DRYLAB PHOTO PRINTING MARKET IN ASIA PACIFIC, BY COUNTRY, 2024-2029 (USD MILLION)
- TABLE 47 AFTER-SALES SERVICES: DRYLAB PHOTO PRINTING MARKET IN ROW, BY REGION, 2020-2023 (USD MILLION)
- TABLE 48 AFTER-SALES SERVICES: DRYLAB PHOTO PRINTING MARKET IN ROW, BY REGION, 2024-2029 (USD MILLION)
- TABLE 49 AFTER-SALES SERVICES: DRYLAB PHOTO PRINTING MARKET FOR NON-COMMERCIAL END USERS, BY REGION, 2020-2023 (USD MILLION)
- TABLE 50 AFTER-SALES SERVICES: DRYLAB PHOTO PRINTING MARKET FOR NON-COMMERCIAL END USERS, BY REGION, 2024-2029 (USD MILLION)
- TABLE 51 AFTER-SALES SERVICES: DRYLAB PHOTO PRINTING MARKET FOR COMMERCIAL END USERS, BY REGION, 2020-2023 (USD MILLION)
- TABLE 52 AFTER-SALES SERVICES: DRYLAB PHOTO PRINTING MARKET FOR COMMERCIAL END USERS, BY REGION, 2024-2029 (USD MILLION)
8 DRYLAB PHOTO PRINTING MARKET, BY CONNECTIVITY
- 8.1 INTRODUCTION
- FIGURE 37 WIRED CONNECTIVITY SEGMENT TO ACCOUNT FOR LARGER MARKET SHARE IN 2029
- TABLE 53 DRYLAB PHOTO PRINTING MARKET, BY CONNECTIVITY, 2020-2023 (USD MILLION)
- TABLE 54 DRYLAB PHOTO PRINTING MARKET, BY CONNECTIVITY, 2024-2029 (USD MILLION)
- 8.2 WIRED
- 8.2.1 GROWING REQUIREMENT FOR FAST AND EFFICIENT PRINTING OF LARGE VOLUME OF DATA TO DRIVE MARKET
- 8.3 WIRELESS
- 8.3.1 HIGH CONVENIECE AND FAST PRINTING SPEED TO DRIVE MARKET
9 DRYLAB PHOTO PRINTING MARKET, BY PRINT WIDTH
- 9.1 INTRODUCTION
- FIGURE 38 ABOVE 6 INCHES PRINT WIDTH SEGMENT TO EXHIBIT HIGHEST CAGR FROM 2024 TO 2029
- TABLE 55 DRYLAB PHOTO PRINTING MARKET, BY PRINT WIDTH, 2020-2023 (USD MILLION)
- TABLE 56 DRYLAB PHOTO PRINTING MARKET, BY PRINT WIDTH, 2024-2029 (USD MILLION)
- 9.2 BELOW 4 INCHES
- 9.2.1 EFFECTIVENESS IN CREATING COMPACT PRINTS TO CONTRIBUTE TO DEMAND
- 9.3 4 TO 6 INCHES
- 9.3.1 VERSATILITY, COST-EFFECTIVENESS, AND HIGH-QUALITY OUTPUT TO PROPEL DEMAND
- 9.4 ABOVE 6 INCHES
- 9.4.1 NEED FOR HIGH-RESOLUTION TECHNOLOGY FOR CLEAR AND VIBRANT LARGE PRINTS TO BOOST MARKET GROWTH
10 DRYLAB PHOTO PRINTING MARKET, BY END USER
- 10.1 INTRODUCTION
- FIGURE 39 COMMERCIAL END USER SEGMENT TO ACCOUNT FOR LARGER MARKET SHARE IN 2029
- TABLE 57 DRYLAB PHOTO PRINTING MARKET, BY END USER, 2020-2023 (USD MILLION)
- TABLE 58 DRYLAB PHOTO PRINTING MARKET, BY END USER, 2024-2029 (USD MILLION)
- 10.2 NON-COMMERCIAL
- 10.2.1 EVOLVING LANDSCAPE OF PERSONALIZED AND HIGH-QUALITY PHOTO PRINTING FOR INDIVIDUALS TO FOSTER MARKET GROWTH
- TABLE 59 NON-COMMERCIAL: DRYLAB PHOTO PRINTING MARKET, BY OFFERING, 2020-2023 (USD MILLION)
- TABLE 60 NON-COMMERCIAL: DRYLAB PHOTO PRINTING MARKET, BY OFFERING, 2024-2029 (USD MILLION)
- TABLE 61 NON-COMMERCIAL: DRYLAB PHOTO PRINTING MARKET, BY REGION, 2020-2023 (USD MILLION)
- TABLE 62 NON-COMMERCIAL: DRYLAB PHOTO PRINTING MARKET, BY REGION, 2024-2029 (USD MILLION)
- 10.3 COMMERCIAL
- 10.3.1 RISING DEMAND FOR HIGH-VOLUME PROFESSIONAL-GRADE PRINTING SOLUTIONS FROM BUSINESSES AND ENTITIES TO PROPEL MARKET
- TABLE 63 COMMERCIAL: DRYLAB PHOTO PRINTING MARKET, BY OFFERING, 2020-2023 (USD MILLION)
- TABLE 64 COMMERCIAL: DRYLAB PHOTO PRINTING MARKET, BY OFFERING, 2024-2029 (USD MILLION)
- TABLE 65 COMMERCIAL: DRYLAB PHOTO PRINTING MARKET, BY REGION, 2020-2023 (USD MILLION)
- TABLE 66 COMMERCIAL: DRYLAB PHOTO PRINTING MARKET, BY REGION, 2024-2029 (USD MILLION)
- 10.3.2 RETAIL STORES
- 10.3.3 PHOTOGRAPHY LABS
- 10.3.4 GIFT SHOPS
- 10.3.5 OTHERS
11 DRYLAB PHOTO PRINTING MARKET, BY REGION
- 11.1 INTRODUCTION
- FIGURE 40 DRYLAB PHOTO PRINTING MARKET IN ASIA PACIFIC TO ACCOUNT FOR HIGHEST MARKET SHARE IN 2029
- TABLE 67 DRYLAB PHOTO PRINTING MARKET, BY REGION, 2020-2023 (USD MILLION)
- TABLE 68 DRYLAB PHOTO PRINTING MARKET, BY REGION, 2024-2029 (USD MILLION)
- 11.2 NORTH AMERICA
- FIGURE 41 NORTH AMERICA: DRYLAB PHOTO PRINTING MARKET SNAPSHOT
- TABLE 69 NORTH AMERICA: DRYLAB PHOTO PRINTING MARKET, BY COUNTRY, 2020-2023 (USD MILLION)
- TABLE 70 NORTH AMERICA: DRYLAB PHOTO PRINTING MARKET, BY COUNTRY, 2024-2029 (USD MILLION)
- TABLE 71 NORTH AMERICA: DRYLAB PHOTO PRINTING MARKET, BY OFFERING, 2020-2023 (USD MILLION)
- TABLE 72 NORTH AMERICA: DRYLAB PHOTO PRINTING MARKET, BY OFFERING, 2024-2029 (USD MILLION)
- TABLE 73 NORTH AMERICA: DRYLAB PHOTO PRINTING MARKET, BY END USER, 2020-2023 (USD MILLION)
- TABLE 74 NORTH AMERICA: DRYLAB PHOTO PRINTING MARKET, BY END USER, 2024-2029 (USD MILLION)
- 11.2.1 IMPACT OF RECESSION ON DRYLAB PHOTO PRINTING MARKET IN NORTH AMERICA
- 11.2.2 US
- 11.2.2.1 Increasing demand for personalized photo prints to propel market
- TABLE 75 US: DRYLAB PHOTO PRINTING MARKET, BY OFFERING, 2020-2023 (USD MILLION)
- TABLE 76 US: DRYLAB PHOTO PRINTING MARKET, BY OFFERING, 2024-2029 (USD MILLION)
- TABLE 77 US: DRYLAB PHOTO PRINTING MARKET, BY END USER, 2020-2023 (USD MILLION)
- TABLE 78 US: DRYLAB PHOTO PRINTING MARKET, BY END USER, 2024-2029 (USD MILLION)
- 11.2.3 CANADA
- 11.2.3.1 Growing popularity of digital photography to support market growth
- 11.2.4 MEXICO
- 11.2.4.1 Rising per capita income to contribute to market growth
- 11.3 EUROPE
- FIGURE 42 EUROPE: DRYLAB PHOTO PRINTING MARKET SNAPSHOT
- TABLE 79 EUROPE: DRYLAB PHOTO PRINTING MARKET, BY COUNTRY, 2020-2023 (USD MILLION)
- TABLE 80 EUROPE: DRYLAB PHOTO PRINTING MARKET, BY COUNTRY, 2024-2029 (USD MILLION)
- TABLE 81 EUROPE: DRYLAB PHOTO PRINTING MARKET, BY OFFERING, 2020-2023 (USD MILLION)
- TABLE 82 EUROPE: DRYLAB PHOTO PRINTING MARKET, BY OFFERING, 2024-2029 (USD MILLION)
- TABLE 83 EUROPE: DRYLAB PHOTO PRINTING MARKET, BY END USER, 2020-2023 (USD MILLION)
- TABLE 84 EUROPE: DRYLAB PHOTO PRINTING MARKET, BY END USER, 2024-2029 (USD MILLION)
- 11.3.1 IMPACT OF RECESSION ON DRYLAB PHOTO PRINTING MARKET IN EUROPE
- 11.3.2 UK
- 11.3.2.1 Heightened demand for high-quality photoshoots to accelerate market growth
- 11.3.3 GERMANY
- 11.3.3.1 Rise in digital photography to foster market growth
- TABLE 85 GERMANY: DRYLAB PHOTO PRINTING MARKET, BY OFFERING, 2020-2023 (USD MILLION)
- TABLE 86 GERMANY: DRYLAB PHOTO PRINTING MARKET, BY OFFERING, 2024-2029 (USD MILLION)
- TABLE 87 GERMANY: DRYLAB PHOTO PRINTING MARKET, BY END USER, 2020-2023 (USD MILLION)
- TABLE 88 GERMANY: DRYLAB PHOTO PRINTING MARKET, BY END USER, 2024-2029 (USD MILLION)
- 11.3.4 FRANCE
- 11.3.4.1 Increased use of inkjet technologies to produce high-quality photos to drive market
- 11.3.5 REST OF EUROPE
- 11.4 ASIA PACIFIC
- FIGURE 43 ASIA PACIFIC: DRYLAB PHOTO PRINTING MARKET SNAPSHOT
- FIGURE 44 INDIA TO EXHIBIT HIGHEST CAGR IN DRYLAB PHOTO PRINTING MARKET IN ASIA PACIFIC FROM 2024 TO 2029
- TABLE 89 ASIA PACIFIC: DRYLAB PHOTO PRINTING MARKET, BY COUNTRY, 2020-2023 (USD MILLION)
- TABLE 90 ASIA PACIFIC: DRYLAB PHOTO PRINTING MARKET, BY COUNTRY, 2024-2029 (USD MILLION)
- TABLE 91 ASIA PACIFIC: DRYLAB PHOTO PRINTING MARKET, BY OFFERING, 2020-2023 (USD MILLION)
- TABLE 92 ASIA PACIFIC: DRYLAB PHOTO PRINTING MARKET, BY OFFERING, 2024-2029 (USD MILLION)
- TABLE 93 ASIA PACIFIC: DRYLAB PHOTO PRINTING MARKET, BY END USER, 2020-2023 (USD MILLION)
- TABLE 94 ASIA PACIFIC: DRYLAB PHOTO PRINTING MARKET, BY END USER, 2024-2029 (USD MILLION)
- 11.4.1 IMPACT OF RECESSION ON DRYLAB PHOTO PRINTING MARKET IN ASIA PACIFIC
- 11.4.2 CHINA
- 11.4.2.1 Rising disposable income to augment demand for high-quality custom photo prints
- TABLE 95 CHINA: DRYLAB PHOTO PRINTING MARKET, BY OFFERING, 2020-2023 (USD MILLION)
- TABLE 96 CHINA: DRYLAB PHOTO PRINTING MARKET, BY OFFERING, 2024-2029 (USD MILLION)
- TABLE 97 CHINA: DRYLAB PHOTO PRINTING MARKET, BY END USER, 2020-2023 (USD MILLION)
- TABLE 98 CHINA: DRYLAB PHOTO PRINTING MARKET, BY END USER, 2024-2029 (USD MILLION)
- 11.4.3 JAPAN
- 11.4.3.1 Growing investments in inkjet dispensing technology to fuel market growth
- TABLE 99 JAPAN: DRYLAB PHOTO PRINTING MARKET, BY OFFERING, 2020-2023 (USD MILLION)
- TABLE 100 JAPAN: DRYLAB PHOTO PRINTING MARKET, BY OFFERING, 2024-2029 (USD MILLION)
- TABLE 101 JAPAN: DRYLAB PHOTO PRINTING MARKET, BY END USER, 2020-2023 (USD MILLION)
- TABLE 102 JAPAN: DRYLAB PHOTO PRINTING MARKET, BY END USER, 2024-2029 (USD MILLION)
- 11.4.4 SOUTH KOREA
- 11.4.4.1 Increasing adoption of technologically advanced electronic devices to propel market
- 11.4.5 INDIA
- 11.4.5.1 Increasing focus of printer manufacturers on revolutionizing high-production photography workflows to foster market growth
- 11.4.6 REST OF ASIA PACIFIC
- 11.5 ROW
- FIGURE 45 SOUTH AMERICA TO DOMINATE DRYLAB PHOTO PRINTING MARKET IN ROW IN 2029
- TABLE 103 ROW: DRYLAB PHOTO PRINTING MARKET, BY REGION, 2020-2023 (USD MILLION)
- TABLE 104 ROW: DRYLAB PHOTO PRINTING MARKET, BY REGION, 2024-2029 (USD MILLION)
- TABLE 105 ROW: DRYLAB PHOTO PRINTING MARKET, BY OFFERING, 2020-2023 (USD MILLION)
- TABLE 106 ROW: DRYLAB PHOTO PRINTING MARKET, BY OFFERING, 2024-2029 (USD MILLION)
- TABLE 107 ROW: DRYLAB PHOTO PRINTING MARKET, BY END USER, 2020-2023 (USD MILLION)
- TABLE 108 ROW: DRYLAB PHOTO PRINTING MARKET, BY END USER, 2024-2029 (USD MILLION)
- 11.5.1 IMPACT OF RECESSION ON DRYLAB PHOTO PRINTING MARKET IN ROW
- 11.5.2 MIDDLE EAST & AFRICA
- TABLE 109 MIDDLE EAST & AFRICA: DRYLAB PHOTO PRINTING MARKET, BY COUNTRY, 2020-2023 (USD MILLION)
- TABLE 110 MIDDLE EAST & AFRICA: DRYLAB PHOTO PRINTING MARKET, BY COUNTRY, 2024-2029 (USD MILLION)
- 11.5.2.1 GCC countries
- 11.5.2.1.1 Rapid technological and economic advancements to fuel market growth
- 11.5.2.2 Rest of Middle East & Africa
- 11.5.2.1 GCC countries
- 11.5.3 SOUTH AMERICA
- 11.5.3.1 Growing technological innovations to contribute to market growth
12 COMPETITIVE LANDSCAPE
- 12.1 OVERVIEW
- 12.2 STRATEGIES ADOPTED BY KEY PLAYERS, 2019-2023
- 12.3 MARKET SHARE ANALYSIS, 2023
- TABLE 111 DRYLAB PHOTO PRINTING MARKET: DEGREE OF COMPETITION
- FIGURE 46 DRYLAB PHOTO PRINTING MARKET SHARE ANALYSIS, 2023
- 12.4 REVENUE ANALYSIS, 2019-2023
- FIGURE 47 DRYLAB PHOTO PRINTING MARKET: REVENUE ANALYSIS OF FIVE KEY PLAYERS, 2019-2023
- 12.5 COMPANY EVALUATION MATRIX, 2023
- 12.5.1 STARS
- 12.5.2 EMERGING LEADERS
- 12.5.3 PERVASIVE PLAYERS
- 12.5.4 PARTICIPANTS
- FIGURE 48 DRYLAB PHOTO PRINTING MARKET: COMPANY EVALUATION MATRIX, 2023
- 12.5.5 COMPANY FOOTPRINT
- TABLE 112 OVERALL COMPANY FOOTPRINT
- TABLE 113 COMPANY END USER FOOTPRINT
- TABLE 114 COMPANY OFFERING FOOTPRINT
- TABLE 115 COMPANY REGION FOOTPRINT
- 12.6 COMPETITIVE SCENARIOS AND TRENDS
- 12.6.1 PRODUCT LAUNCHES
- TABLE 116 DRYLAB PHOTO PRINTING MARKET: PRODUCT LAUNCHES, 2022-2023
- 12.6.2 DEALS
- TABLE 117 DRYLAB PHOTO PRINTING MARKET: DEALS, 2022-2023
13 COMPANY PROFILES
- 13.1 INTRODUCTION
- 13.2 KEY PLAYERS
- (Business Overview, Products/Services/Solutions Offered, MnM View, Key Strengths and Right to Win, Strategic Choices Made, Weaknesses and Competitive Threats, Recent Developments)**
- 13.2.1 SEIKO EPSON CORPORATION
- TABLE 118 SEIKO EPSON CORPORATION: COMPANY OVERVIEW
- FIGURE 49 SEIKO EPSON CORPORATION: COMPANY SNAPSHOT
- TABLE 119 SEIKO EPSON CORPORATION: PRODUCTS/SOLUTIONS/SERVICES OFFERED
- TABLE 120 SEIKO EPSON CORPORATION: PRODUCT LAUNCHES
- 13.2.2 DAI NIPPON PRINTING CO., LTD.
- TABLE 121 DAI NIPPON PRINTING CO., LTD.: COMPANY OVERVIEW
- FIGURE 50 DAI NIPPON PRINTING CO., LTD.: COMPANY SNAPSHOT
- TABLE 122 DAI NIPPON PRINTING CO., LTD.: PRODUCTS/SOLUTIONS/SERVICES OFFERED
- TABLE 123 DAI NIPPON PRINTING CO., LTD.: PRODUCT LAUNCHES
- TABLE 124 DAI NIPPON PRINTING CO., LTD.: DEALS
- 13.2.3 FUJIFILM CORPORATION
- TABLE 125 FUJIFILM CORPORATION: COMPANY OVERVIEW
- FIGURE 51 FUJIFILM CORPORATION: COMPANY SNAPSHOT
- TABLE 126 FUJIFILM CORPORATION: PRODUCTS/SOLUTIONS/SERVICES OFFERED
- TABLE 127 FUJIFILM CORPORATION: DEALS
- 13.2.4 NORITSU PRECISION CO., LTD.
- TABLE 128 NORITSU PRECISION CO., LTD.: COMPANY OVERVIEW
- FIGURE 52 NORITSU PRECISION CO., LTD.: COMPANY SNAPSHOT
- TABLE 129 NORITSU PRECISION CO., LTD.: PRODUCTS/SOLUTIONS/SERVICES OFFERED
- TABLE 130 NORITSU PRECISION CO., LTD.: PRODUCT LAUNCHES
- TABLE 131 NORITSU PRECISION CO., LTD.: DEALS
- 13.2.5 KODAK ALARIS INC.
- TABLE 132 KODAK ALARIS INC.: COMPANY OVERVIEW
- FIGURE 53 KODAK ALARIS INC.: COMPANY SNAPSHOT
- TABLE 133 KODAK ALARIS INC.: PRODUCTS/SOLUTIONS/SERVICES OFFERED
- TABLE 134 KODAK ALARIS INC.: PRODUCT LAUNCHES
- 13.2.6 HITI DIGITAL, INC.
- TABLE 135 HITI DIGITAL, INC.: COMPANY OVERVIEW
- FIGURE 54 HITI DIGITAL, INC.: COMPANY SNAPSHOT
- TABLE 136 HITI DIGITAL, INC.: PRODUCTS/SOLUTIONS/SERVICES OFFERED
- 13.2.7 CANON INC.
- TABLE 137 CANON INC.: COMPANY OVERVIEW
- FIGURE 55 CANON INC.: COMPANY SNAPSHOT
- TABLE 138 CANON INC.: PRODUCTS/SOLUTIONS/SERVICES OFFERED
- 13.2.8 HP DEVELOPMENT COMPANY, L.P.
- TABLE 139 HP DEVELOPMENT COMPANY, L.P.: COMPANY OVERVIEW
- FIGURE 56 HP DEVELOPMENT COMPANY, L.P.: COMPANY SNAPSHOT
- TABLE 140 HP DEVELOPMENT COMPANY, L.P.: PRODUCTS/SOLUTIONS/SERVICES OFFERED
- 13.2.9 SINFONIA TECHNOLOGY CO., LTD.
- TABLE 141 SINFONIA TECHNOLOGY CO., LTD.: COMPANY OVERVIEW
- FIGURE 57 SINFONIA TECHNOLOGY CO., LTD.: COMPANY SNAPSHOT
- TABLE 142 SINFONIA TECHNOLOGY CO., LTD.: PRODUCTS/SOLUTIONS/SERVICES OFFERED
- 13.2.10 CITIZEN SYSTEMS JAPAN CO., LTD.
- TABLE 143 CITIZEN SYSTEMS JAPAN CO., LTD: COMPANY OVERVIEW
- FIGURE 58 CITIZEN SYSTEMS JAPAN CO., LTD.: COMPANY SNAPSHOT
- TABLE 144 CITIZEN SYSTEMS JAPAN CO., LTD.: PRODUCTS/SOLUTIONS/SERVICES OFFERED
- *Business Overview, Products/Services/Solutions Offered, MnM View, Key Strengths and Right to Win, Strategic Choices Made, Weaknesses and Competitive Threats, Recent Developments might not be captured in case of unlisted companies.
- 13.3 OTHER PLAYERS
- 13.3.1 POLAROID CORPORATION
- TABLE 145 POLAROID CORPORATION: COMPANY OVERVIEW
- 13.3.2 MITSUBISHI ELECTRIC CORPORATION
- TABLE 146 MITSUBISHI ELECTRIC CORPORATION: COMPANY OVERVIEW
- 13.3.3 RICOH
- TABLE 147 RICOH: COMPANY OVERVIEW
14 APPENDIX
- 14.1 INSIGHTS FROM INDUSTRY EXPERTS
- 14.2 DISCUSSION GUIDE
- 14.3 KNOWLEDGESTORE: MARKETSANDMARKETS' SUBSCRIPTION PORTAL
- 14.4 CUSTOMIZATION OPTIONS
- 14.5 RELATED REPORTS
- 14.6 AUTHOR DETAILS