|
|
市場調査レポート
商品コード
1340153
ウェアラブルセンサーの世界市場 (~2028年):タイプ (加速度センサー・圧力&力センサー・ジャイロスコープ・医療用センサー)・用途 (リストウェア・アイウェア・フットウェア・ネックウェア・ボディウェア)・産業・地域別Wearable Sensors Market by Type (Accelerometers, Pressure & force sensors, Gyroscopes, Medical based sensors), Application (Wristwear, Eye-wear, Footwear, Neckwear, Bodywear), Vertical and Region - Global Forecast to 2028 |
||||||
|
|
|||||||
カスタマイズ可能
|
|||||||


| ウェアラブルセンサーの世界市場 (~2028年):タイプ (加速度センサー・圧力&力センサー・ジャイロスコープ・医療用センサー)・用途 (リストウェア・アイウェア・フットウェア・ネックウェア・ボディウェア)・産業・地域別 |
|
出版日: 2023年08月01日
発行: MarketsandMarkets
ページ情報: 英文 247 Pages
納期: 即納可能
|

- 全表示
- 概要
- 目次
ウェアラブルセンサーの市場規模は、2023年の16億米ドルから、予測期間中は21.1%のCAGRで推移し、2028年には42億米ドルの規模に成長すると予測されています。
スマートデバイスに対する需要の増加、フィットネスやヘルスモニタリングデバイスの発展、CE製品やヘルスケアなどの産業全体における技術革新と開発への注目の高まりなどが同市場の成長を促進する主な要因です。
タイプ別で見ると、圧力・力センサーの部門が2022年に最大のシェアを示しています。また、用途別では、リストウェアの部門が予測期間中に最大のシェアを示す見通しです。
地域別では、北米地域が予測期間中に最大の規模を示す見通しです。北米、特に米国には大手センサーメーカーが存在し、ウェアラブルデバイスやゲーム機などのCE製品への需要が高まっていることも、エンターテインメントやヘルスケアなどのさまざまなエンドユーザー産業におけるセンサーの使用を後押ししています。米国は技術革新に理想的な環境を提供しており、ウェアラブルセンサー技術の飛躍的な進歩を促進しています。さらに、ヘルス&フィットネスモニタリング、慢性疾患の管理、スポーツとパフォーマンスの最適化、CE製品、ライフスタイルなどの要因が、この地域における需要の主な促進要因となっています。
当レポートでは、世界のウェアラブルセンサーの市場を調査し、市場概要、市場への影響因子および市場機会の分析、市場規模の推移・予測、各種区分・地域別の詳細分析、競合情勢、主要企業のプロファイルなどをまとめています。
目次
第1章 イントロダクション
第2章 調査手法
第3章 エグゼクティブサマリー
第4章 重要考察
第5章 市場概要
- 市場力学
- 促進要因
- 抑制要因
- 機会
- 課題
- バリューチェーン分析
- エコシステム分析
- 価格分析
- 顧客の事業に影響を与える動向/ディスラプション
- 技術分析
- 主なステークホルダーと購入基準
- ポーターのファイブフォース分析
- ユースケース
- 貿易分析
- 特許分析
- 主なカンファレンスとイベント
- 規制基準
第6章 ウェアラブルセンサー市場:タイプ別
- 加速度計
- 磁力計
- ジャイロスコープ
- 慣性センサー
- モーションセンサー
- 圧力センサー・力センサー
- 温度・湿度センサー
- マイクロフォン・マイクロスピーカー
- 医療用センサー
- 血中酸素センサー
- 血糖センサー
- 血流センサー
- 心電図センサー
- 心拍数センサー
- ホール効果センサー
- イメージセンサー
- タッチセンサー
- その他のセンサー
- 位置センサー
- 光センサー
- 化学センサー
- 電極センサー
- バイオセンサー
第7章 ウェアラブルセンサー市場:技術別
- MEMS
- VLSI
- NEMS
- CMOS
- MST
- ASIC
- 光学技術
- 化学技術
- 電極
第8章 ウェアラブルセンサー市場:用途別
- リストウェア
- リストバンド/ウォッチ
- リストブレスレット
- メガネ
- Googleメガネ
- スマートコンタクトレンズ・ヘッドアップディスプレイ・ヘッドマウントディスプレイ
- AR/VR
- ニュートラルインターフェイス
- アイトラッキング
- 深度センシング
- フットウェア
- スマートソックス
- インソール
- ネックウェア
- ネクタイ・カラー
- 装飾品・ジュエリー
- ボディウェア
- 衣類・インナーウェア
- アーム・レッグウェア
- スマートソックス
- チェストストラップ
- その他
- リングスキャナー/ウェア
- スマートヘッドセット/ヘッドバンド
- イヤーウェア
- スキンパッチ
第9章 ウェアラブルセンサー市場:産業別
- 消費財
- フィットネス・スポーツ
- インフォテイメント・マルチメディア
- 決済・アクセス制御
- 個人の安全・セキュリティ
- 衣服・ファッション
- ヘルスケア
- バイタルサインモニタリング
- 睡眠とメンタルヘルスモニタリング
- 転倒・動きの検知
- アルコール摂取量モニタリング
- 尿モニタリング
- 乳酸モニタリング
- 産業用
- 物流・梱包・倉庫
- その他 (化学・ガソリン・石油&ガス・鉱業・建設)
- その他
第9章 ウェアラブルセンサー市場:地域別
- 北米
- 欧州
- アジア太平洋
- その他の地域
第11章 競合情勢
- 概要
- 市場シェア分
- 上位5社の収益分析
- 企業評価マトリックス
- 新興企業/中小企業の評価マトリックス
- 企業のフットプリント
- 競合シナリオ
第12章 会社概要
- 主要企業
- STMicroelectronics
- Infineon Technologies AG
- NXP Semiconductors
- Texas Instruments Inc.
- TE Connectivity
- Broadcom
- Analog Devices, Inc.
- Panasonic holdings Corporation
- Asahi Kasei Corporation
- Knowles Electronics, LLC.
- その他の主要企業
- Robert Bosch GmbH
- InvenSense, Inc.
- MCUBE
- SENSIrion ag
- ams-osram ag
- Arms Limited
- Empatica Inc
- Hexoskin
- Neo FEct
- Enflux
- HOCOMA
- Actofit
- Whoop
- motiv
- Oura Health Oy
第13章 付録
The wearable sensors market is valued at USD 1.6 billion in 2023 and is projected to reach USD 4.2 billion by 2028, growing at a CAGR of 21.1% from 2023 to 2028. Increasing demand for smart devices, the growing importance of fitness and health monitoring devices, and the rising focus on innovation and development across industries such as consumer electronics and healthcare are among the key factors driving the growth of the wearable sensors market. Technical difficulties related to hardware and software may hamper the adoption of wearable sensors and are also one of the major challenges in the market.
"Market for pressure & force sensors to significant share during the forecast period."
The pressure & force sensors held the largest share of the wearable sensors market in 2022 and are also expected to hold a significant share during the forecast period. Pressure sensors are used to measure force and determine the nature of an applied force, and force sensors are used to measure forces and torques. Smartwatches and fitness bands are the key application areas of pressure & force sensors.
"Market for the wristwear segment is expected to hold the largest share during the forecast period."
The market for wristwear is expected to hold the largest share during the forecast period. The wristwear function is to monitor a customer's health. The wristwear segment includes various factors for it being the dominant segment, such as health and fitness tracking, convenience and comfort, fashion and style, among others. The Wrist-worn devices are generally comfortable to wear and are less intrusive than some other types of wearable sensors. Smartwatches and fitness trackers can track various metrics such as heart rate, steps taken, and sleep patterns making them highly user-friendly for health-conscious consumers.
"US is expected to have the largest market size in North America during the forecast period."
The presence of some of the leading sensor manufacturers in North America (US) and the growing demand for consumer electronics such as wearable devices and gaming consoles also boost the use of sensors in different end-user industries such as entertainment and healthcare. The US offers an ideal environment for innovation, which has facilitated massive strides in wearable sensor technology. Moreover, the factors such as health and fitness monitoring, chronic disease management, sports and performance optimization, consumer electronics, and lifestyle are some of the major driving factors for demand in this region.
In the process of determining and verifying the market size for several segments and subsegments gathered through secondary research, extensive primary interviews have been conducted with key industry experts in the wearable sensors space. The break-up of primary participants for the report has been shown below:
- By Company Type: Tier 1 - 52%, Tier 2 - 31%, and Tier 3 - 17%
- By Designation: C-level Executives - 47%, Directors -31%, and Others - 22%
- By Region: North America -36%, Europe - 29%, Asia Pacific- 30%, and RoW - 5%
The report profiles key players in the wearable sensors market with their respective market ranking analysis. Prominent players profiled in this report include STMicroelectronics (Switzerland); Infineon Technologies (Germany); Knowles Electronics (US); NXP Semiconductors (Netherlands); Texas Instruments (US); TE Connectivity (Switzerland); Broadcom (Switzerland); Analog Devices (US); Panasonic (Japan); Asahi Kasei (Japan). Apart from these, Robert Bosch (Germany), InvenSense (California), MCube (California), Sensirion AG (Switzerland), AMS AG (Austria); Arms Holdings (UK); Empatica (US); Hexoskin (Montreal); Neofect (SouthKorea), Enflux (US); Hocoma (Switzerland); Actofit (India); Whoop (US); Motiv (US); Oura Health (Finland) are among a few emerging companies in the wearable sensors market.
Report Coverage
The report defines, describes, and forecasts the wearable sensors market based on type, application, vertical, and region. It provides detailed information regarding drivers, restraints, opportunities, and challenges influencing the growth of the wearable sensors market. It also analyzes competitive developments such as product launches, acquisitions, expansions, contracts, partnerships, and actions carried out by the key players to grow the market.
Reasons to Buy This Report
The report will help the market leaders/new entrants in the market with information on the closest approximations of the revenue for the overall wearable sensors market and the subsegments. The report will help stakeholders understand the competitive landscape and gain more insight to position their business better and plan suitable go-to-market strategies. The report also helps stakeholders understand the market's pulse and provides information on key drivers, restraints, opportunities, and challenges.
The report will provide insights into the following pointers:
- Analysis of key drivers (Increasing trend towards smaller, smarter, and cheaper sensors), restraints (High cost of wearable sensors), opportunities (Increasing number of connected devices), and challenges (Technical difficulties related to hardware and software) of the wearable sensors market.
- Product development /Innovation: Detailed insights on upcoming technologies, research & development activities, and new product & service launches in the wearable sensors market.
- Market Development: With comprehensive information about lucrative markets, the report analyses the wearable sensors market across various regions.
- Market Diversification: Exhaustive information about new products & services, untapped geographies, recent developments, and investments in the wearable sensors market.
- Competitive Assessment: In-depth assessment of market share, growth strategies, and services, offering of leading players like STMicroelectronics (Switzerland); Infineon Technologies (Germany); Knowles Electronics (US); NXP Semiconductors (Netherlands); Texas Instruments (US) among others in wearable sensors market.
TABLE OF CONTENTS
1 Introduction
- 1.1 study Objectives
- 1.2 market definition
- 1.2.1 Inclusions and Exclusions
- 1.3 market Scope
- 1.3.1 markets covered
- 1.3.2 regions covered
- 1.3.3 Years considered
- 1.4 currency CONSIDERED
- 1.4.1 USD Exchange rates
- 1.5 UnitS considered
- 1.6 limitations
- 1.7 stakeholders
- 1.8 recession impact analysis
- 1.9 sUmmary of Changes
2 RESEARCH METHODOLOGY
- 2.1 Research data
- FIGURE 1 wearable sensors market: Research design
- 2.1.1 Secondary and primary Research
- 2.1.2 secondary data
- TABLE 1 List of key secondary sources
- 2.1.2.1 Key data from secondary sources
- 2.1.3 Primary Data
- 2.1.3.1 Key data from primary interviews
- 2.1.3.2 Breakdown of primary interviews
- 2.1.3.3 Insights from industry experts
- 2.2 research approach and methodology
- FIGURE 2 market size estimation methodology: supply-side analysis: revenue of products/solutions/services in wearable sensors market
- 2.2.1 bottom-up approach
- 2.2.1.1 Market size estimation by bottom-up analysis (demand side)
- FIGURE 3 wearable sensors market size estimation methodology: Bottom-up approach
- 2.2.2 top-down approach
- 2.2.2.1 Market size estimation by top-down analysis (supply side)
- FIGURE 4 wearable sensors market size estimation methodology: top-down approach
- 2.3 MARKET BREAKDOWN AND DATA TRIANGULATION
- FIGURE 5 data triangulation
- 2.4 research assumptions
- 2.5 PARAMETERS for recession impact analysis
- 2.6 rISK ASSESSMENT
3 Executive Summary
- FIGURE 6 Magnetometer segment to grow at highest CAGR during forecast period
- FIGURE 7 Bodywear segment to grow at highest cagr during forecast period
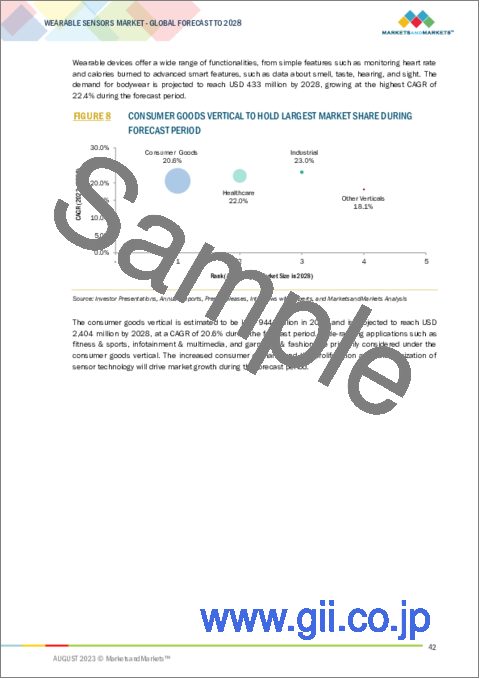
- FIGURE 8 Consumer goods Vertical to hold largest market share during forecast period
- FIGURE 9 Wearable sensors Market, by Region, 2023-2028
4 PRemium Insights
- 4.1 attractive opportunities for market players
- FIGURE 10 demand for fitness and health tracking devices to drive market during forecast period
- 4.2 wearable sensors MARKET, BY type
- FIGURE 11 Gyroscope segment TO GROW AT HIGHEST RATE DURING FORECAST PERIOD
- 4.3 wearable sensors market in Asia pacific, by vertical and COUNTRY
- FIGURE 12 Consumer goods and china to hold largest market shares in asia pacific in 2023, by vertical and by country
- 4.4 Wearable sensors market, by country
- FIGURE 13 India to dominate Wearable sensors market during forecast period
5 Market Overview
- 5.1 Introduction
- 5.2 Market dynamics
- FIGURE 14 Wearable sensors market: drivers, restraints, opportunities, and challenges
- 5.2.1 Drivers
- 5.2.1.1 Increasing trend toward smaller, smarter, and cheaper sensors
- 5.2.1.2 Miniaturization trend in sensors
- 5.2.1.3 Rising share of aging population
- 5.2.1.4 Benefits of wearable devices in healthcare sector
- 5.2.1.5 Rise of IoT, AR, and M2M
- 5.2.1.6 Growing interest of Tier I players
- 5.2.1.7 Growing trend toward smart living among end users
- FIGURE 15 WEARABLE SENSORS MARKET: IMPACT ANALYSIS OF DRIVERS
- 5.2.2 Restraints
- 5.2.2.1 Lack of common standards and interoperability issues
- 5.2.2.2 High cost of wearable products
- 5.2.2.3 Regulatory issues
- 5.2.2.4 Security and privacy concerns
- FIGURE 16 WEARABLE SENSORS MARKET: IMPACT ANALYSIS OF RESTRAINTS
- 5.2.3 opportunities
- 5.2.3.1 Increasing number of connected devices
- 5.2.3.2 Potential applications of wearable technology
- FIGURE 17 WEARABLE SENSORS MARKET: IMPACT ANALYSIS OF OPPORTUNITies
- 5.2.4 Challenges
- 5.2.4.1 Technical difficulties related to hardware and software
- 5.2.4.2 Device protection and thermal consideration
- 5.2.4.3 Growing miniaturization in sensors and wearable devices
- FIGURE 18 WEARABLE SENSORS MARKET: IMPACT ANALYSIS OF CHALLENGES
- 5.3 VAlue Chain Analysis
- FIGURE 19 Wearable sensors market: value chain analysis
- 5.3.1 Raw material and equipment suppliers
- 5.3.2 Chip designers
- 5.3.3 Technology providers
- 5.3.4 Integrators
- 5.3.5 Applications
- 5.4 EcoSystem Analysis
- FIGURE 20 Wearable sensors market: ecosystem analysis
- TABLE 2 wearable sensors market EcoSysteM
- 5.5 pricing analysis
- TABLE 3 average selling Prices of Wearable sensors
- 5.5.1 AVERAGE SELLING PRICE Of wearable SENsORs offered by KEY PLAYERs
- FIGURE 21 average selling price of Wearable SENSORs offered by key players
- 5.5.2 Average selling price trend
- FIGURE 22 average selling price of Accelerometers
- 5.6 TRENDS/DISRUPTIONS IMPACTING customer BUSINESS
- 5.6.1 revenue shift and new revenue pockets for market players
- FIGURE 23 revenue shift in wearable sensors market
- 5.7 technology analysis
- 5.7.1 fully printed and multifunctional graphene-based wearable e-textiles for personalized healthcare applications
- 5.7.2 Design of wearable sensors in clinical diagnostics
- 5.8 key stakeholders and buying criteria
- 5.8.1 key stakeholders in buying process
- FIGURE 24 wearable sensors MARKET: influence of STAKEHOLDERS on BUYING PROCESS FOR TOP three applications
- TABLE 4 wearable sensors MARKET: influence of STAKEHOLDERS on BUYING PROCESS FOR TOP three applications
- 5.8.2 buying criteria
- FIGURE 25 Wearable SENSORS MARKET: KEY buying criteria for top three applications
- TABLE 5 KEY buying criteria for top three applications
- 5.9 porter's five forces analysis
- TABLE 6 Wearable sensors market: porter's five forces analysis
- 5.9.1 Bargaining Power of Suppliers
- 5.9.2 Bargaining Power of Buyers
- 5.9.3 Threat of New Entrants
- 5.9.4 Threat of Substitutes
- 5.9.5 Intensity of Competitive Rivalry
- 5.10 use cases
- 5.10.1 use case 1: WATERPROOF MEMS pressure sensors by STmicroelectronics
- 5.10.2 use case 2: use of Human Condition Safety sensors to minimize job site risks
- 5.10.3 use case 3: fitbit's new Sense smartwatch tAKES skin temperature for managing stress
- 5.11 TRADE ANALYSIs
- FIGURE 26 IMPORT data, BY COUNTRY, 2018-2022 (USD million)
- FIGURE 27 EXPORT DATa, by country, 2018-2022 (USD million)
- 5.11.1 Tariff analysis
- TABLE 7 tariff for Wristwatches, whether or not incorporating stopwatch Facility, elEctrically operated, Exported by China, 2021
- TABLE 8 tariff for Wristwatches, whether or not incorporating stopwatch Facility, ELECTRICALLY operated, EXPORTED BY Germany, 2021
- TABLE 9 tariff for Wristwatches, whether or not incorporating stopwatch Facility, ELECTRICALLY operated EXPORTED BY US, 2021
- TABLE 10 tariff for Wristwatches, whether or not incorporating stopwatch Facility, ELECTRICALLY operated, Exported by France 2021
- 5.12 PATENT ANALYSIS
- FIGURE 28 TOP 10 COMPANIES WITH HIGHEST NUMBER OF PATENT APPLICATIONS IN LAST 10 YEARS
- TABLE 11 Top 20 Patent Owners in Last 10 Years (US)
- FIGURE 29 Number of patents granted per year from 2012 to 2022
- TABLE 12 Wearable sensors MARKET: key patents, 2020-2022
- 5.13 key conferences and events, 2023-2024
- TABLE 13 Wearable sensors MARKET: KEY Conferences and Events
- 5.14 Regulatory standards
- 5.14.1 Regulatory compliance
- 5.14.1.1 Regulations
- 5.14.1 Regulatory compliance
- 6 wearable sensors market, by type
- 6.1 Introduction
- FIGURE 30 Gyroscope segment to grow at highest rate during forecast period
- TABLE 14 Wearable Sensors Market, by Type, 2019-2022 (USD Million)
- TABLE 15 Wearable Sensors Market, by Type, 2023-2028 (USD Million)
- TABLE 16 Wearable sensors market, by type, 2019-2022 (MILLION UNITS)
- TABLE 17 Wearable sensors market, by type, 2023-2028 (MILLION UNITS)
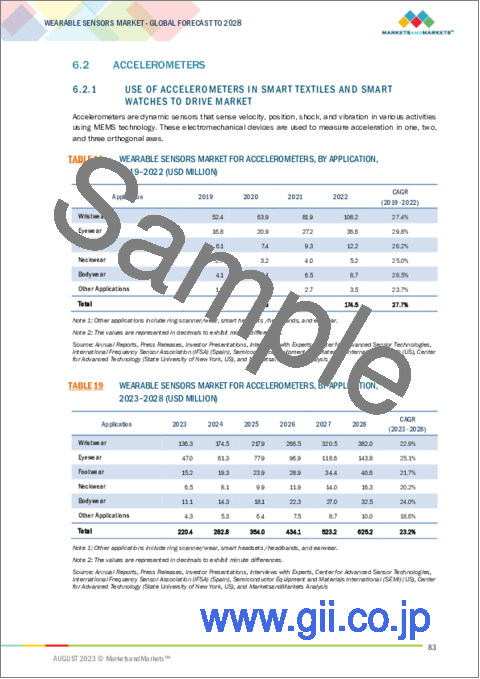
- 6.2 accelerometers
- 6.2.1 Use of Accelerometers in smart textiles and smart watches to drive market
- TABLE 18 Wearable Sensors Market for Accelerometers, by Application, 2019-2022 (USD Million)
- TABLE 19 Wearable Sensors Market for Accelerometers, by Application, 2023-2028 (USD Million)
- TABLE 20 Wearable Sensors Market for Accelerometers, by Vertical, 2019-2022 (USD Million)
- TABLE 21 Wearable Sensors Market for Accelerometers, by Vertical, 2023-2028 (USD Million)
- 6.3 magnetometers
- 6.3.1 use of Magnetometers in wristwear and bodywear devices to drive market
- TABLE 22 Wearable Sensors Market for Magnetometers, by Application, 2019-2022 (USD Million)
- TABLE 23 Wearable Sensors Market for Magnetometers, by Application, 2023-2028 (USD Million)
- TABLE 24 Wearable Sensors Market for Magnetometers, by Vertical, 2019-2022 (USD Million)
- TABLE 25 Wearable Sensors Market for Magnetometers, by Vertical, 2023-2028 (USD Million)
- 6.4 gyroscopes
- 6.4.1 use of gyroscopes in virtual reality headsets, smartwatches, and fitness trackers to drive market
- FIGURE 31 wristwear segment to hold major market share during forecast period
- TABLE 26 Wearable Sensors Market for Gyroscopes, by Application, 2019-2022 (USD Million)
- TABLE 27 Wearable Sensors Market for Gyroscopes, by Application, 2023-2028 (USD Million)
- TABLE 28 Wearable Sensors Market for Gyroscopes, by Vertical, 2019-2022 (USD Million)
- TABLE 29 Wearable Sensors Market for Gyroscopes, by Vertical, 2023-2028 (USD Million)
- 6.5 inertial sensors
- 6.5.1 use of inertial sensors in Eyewear devices to drive market
- TABLE 30 Wearable Sensors Market for Inertial Sensors, by Application, 2019-2022 (USD Million)
- TABLE 31 Wearable Sensors Market for Inertial Sensors, by Application, 2023-2028 (USD Million)
- TABLE 32 Wearable Sensors Market for Inertial Sensors, by Vertical, 2019-2022 (USD Million)
- TABLE 33 Wearable Sensors Market for Inertial Sensors, by Vertical, 2023-2028 (USD Million)
- 6.6 motion sensors
- 6.6.1 wristwear to account for largest market share for motion sensors
- TABLE 34 Wearable Sensors Market for Motion Sensors, by Application, 2019-2022 (USD Million)
- TABLE 35 Wearable Sensors Market for Motion Sensors, by Application, 2023-2028 (USD Million)
- TABLE 36 Wearable Sensors Market for Motion Sensors, by Vertical, 2019-2022 (USD Million)
- TABLE 37 Wearable Sensors Market for Motion Sensors, by Vertical, 2023-2028 (USD Million)
- 6.7 pressure and force sensors
- 6.7.1 use of pressure and force sensorS in Smartwatches and fitness bands to drive market
- TABLE 38 Wearable Sensors Market for Pressure and Force Sensors, by Application, 2019-2022 (USD Million)
- TABLE 39 Wearable Sensors Market for Pressure and Force Sensors, by Application, 2023-2028 (USD Million)
- TABLE 40 Wearable Sensors Market for Pressure and Force Sensors, by Vertical, 2019-2022 (USD Million)
- TABLE 41 Wearable Sensors Market for Pressure and Force Sensors, by Vertical, 2023-2028 (USD Million)
- 6.8 temperature and humidity sensors
- 6.8.1 wristwear application to drive market
- FIGURE 32 industrial vertical to grow at highest rate during forecast period
- TABLE 42 Wearable Sensors Market for Temperature and Humidity Sensors, by Application, 2019-2022 (USD Million)
- TABLE 43 Wearable Sensors Market for Temperature and Humidity Sensors, by Application, 2023-2028 (USD Million)
- TABLE 44 Wearable Sensors Market for Temperature and Humidity Sensors, by Vertical, 2019-2022 (USD Million)
- TABLE 45 Wearable Sensors Market for Temperature and Humidity Sensors, by Vertical, 2023-2028 (USD Million)
- 6.9 microphones and MICRO SPEAKERS
- 6.9.1 wristwear, bodywear, and healthcare applications to drive market
- TABLE 46 Wearable Sensors Market for Microphones and MICRO SPEAKERS, by Application, 2019-2022 (USD Million)
- TABLE 47 Wearable Sensors Market for Microphones and MICRO SPEAKERS, by Application, 2023-2028 (USD Million)
- TABLE 48 Wearable Sensors Market for Microphones and MICRO SPEAKERS, by Vertical, 2019-2022 (USD Million)
- TABLE 49 Wearable Sensors Market for Microphones and MICRO SPEAKERS, by Vertical, 2023-2028 (USD Million)
- 6.10 medical-based sensors
- 6.10.1 increasing demand for health tracking devices to drive market
- 6.10.2 blood oxygen sensors
- 6.10.3 blood glucose sensors
- 6.10.4 blood flow sensors
- 6.10.5 ecg sensors
- 6.10.6 heart rate sensors
- 6.10.7 hall effect sensors
- TABLE 50 Wearable Sensors Market for Medical-Based Sensors, by Application, 2019-2022 (USD Million)
- TABLE 51 Wearable Sensors Market for Medical-Based Sensors, by Application, 2023-2028 (USD Million)
- TABLE 52 Wearable Sensors Market for Medical-Based Sensors, by Vertical, 2019-2022 (USD Million)
- TABLE 53 Wearable Sensors Market for Medical-Based Sensors, by Vertical, 2023-2028 (USD Million)
- 6.11 image sensors
- 6.11.1 increased demand for activity monitoring devices to drive market
- TABLE 54 Wearable Sensors Market for Image Sensors, by Application, 2019-2022 (USD Million)
- TABLE 55 Wearable Sensors Market for Image Sensors, by Application, 2023-2028 (USD Million)
- TABLE 56 Wearable sensors market for Image Sensors, by Vertical, 2019-2022 (USD Million)
- TABLE 57 Wearable sensors market for Image Sensors, by Vertical, 2023-2028 (USD Million)
- 6.12 touch sensors
- 6.12.1 Rising demand for wearable devices to drive market
- FIGURE 33 eyewear segment to grow at highest rate during forecast period
- TABLE 58 WEARABLE SENSORS MARKET FOR TOUCH SENSORS, BY APPLICATION, 2019-2022 (USD MILLION)
- TABLE 59 WEARABLE SENSORS MARKET FOR TOUCH SENSORS, BY APPLICATION, 2023-2028 (USD MILLION)
- TABLE 60 Wearable Sensors Market for Touch Sensors, by Vertical, 2019-2022 (USD Million)
- TABLE 61 Wearable Sensors Market for Touch Sensors, by Vertical, 2023-2028 (USD Million)
- 6.13 other sensors
- 6.13.1 position sensors
- 6.13.2 light sensors
- 6.13.3 Chemical sensors
- 6.13.4 Electrode sensors
- 6.13.5 Biosensors
- TABLE 62 WEARABLE SENSORS MARKET FOR OTHER SENSORS, BY APPLICATION, 2019-2022 (USD MILLION)
- TABLE 63 WEARABLE SENSORS MARKET FOR OTHER SENSORS, BY APPLICATION, 2023-2028 (USD MILLION)
- TABLE 64 Wearable Sensors Market for Other Sensors, by Vertical, 2019-2022 (USD Million)
- TABLE 65 Wearable Sensors Market for Other Sensors, by Vertical, 2023-2028 (USD Million)
- 7 wearable sensors market, by technology
- 7.1 Introduction
- 7.2 Microelectromechanical system (MEMS)
- 7.2.1 Increased demand in healthcare sector to drive market
- 7.3 very-large-scale integration (vlsi)
- 7.3.1 Use in healthcare, security, and navigation applications to drive market
- 7.4 nanoelectromechanical system (nems)
- 7.4.1 Use in smartwatches, smart glasses, and smart bands to drive market
- 7.5 Complementary metal oxide semiconductor (cmos)
- 7.5.1 Increasing trend of microfabrication and nanofabrication of electronic structures to drive market
- 7.6 microsystems technology (mst)
- 7.6.1 Increasing trend of miniaturization to drive market
- 7.7 application-SPECIFIC integrated circuit (asic)
- 7.7.1 rising demand for environmental monitoring to drive market
- 7.8 Optical technology
- 7.8.1 rising adoption OF health monitoring systemS to drive market
- 7.9 Chemical technology
- 7.9.1 Increased focus ON sensor fabrication to drive market
- 7.10 Electrode
- 7.10.1 Growing adoption of medical devices to drive market
- 8 wearable sensors market, by APPLICATION
- 8.1 introduction
- FIGURE 34 bodywear segment TO GROW AT HIGHEST RATE DURING FORECAST PERIOD
- TABLE 66 Wearable Sensors Market, by Application, 2019-2022 (USD Million)
- TABLE 67 Wearable Sensors Market, by Application, 2023-2028 (USD Million)
- 8.2 WRISTWEAR
- 8.2.1 Increasing demand from consumer goods vertical to drive market
- 8.2.2 WRIST-WEARABLE BANDS/WATCHES
- 8.2.3 WRIST-WEARABLE BRACELETS
- TABLE 68 Wearable Sensors Market for Wristwear application, by Type, 2019-2022 (USD Million)
- TABLE 69 Wearable Sensors Market for Wristwear application, by Type, 2023-2028 (USD Million)
- 8.3 EYEWEAR
- 8.3.1 Increasing demand in consumer goods vertical to drive market
- 8.3.2 GOOGLE GLASSES
- 8.3.3 SMART CONTACT LENSES, HEAD-UP DISPLAYS, AND HEAD-MOUNTED DISPLAYS
- TABLE 70 Wearable Sensors Market for Eyewear Application, by Type, 2019-2022 (USD Million)
- TABLE 71 Wearable Sensors Market for Eyewear Application, by Type, 2023-2028 (USD Million)
- 8.3.4 AR/VR
- 8.3.5 Neutral Interface
- 8.3.6 Eye-tracking
- 8.3.7 Depth sensing
- 8.4 footwear
- 8.4.1 Increasing deployment of wearable sensors by footwear manufacturers to drive market
- TABLE 72 Wearable Sensors Market for Footwear Application, by Type, 2019-2022 (USD Million)
- TABLE 73 Wearable Sensors Market for Footwear Application, by Type, 2023-2028 (USD Million)
- 8.4.2 Smart socks
- 8.4.3 Insoles
- 8.5 neckwear
- 8.5.1 Increasing demand for smart neckwear to drive market
- 8.5.2 Ties and collars
- 8.5.3 Ornaments and jewelry
- TABLE 74 Wearable Sensors Market for Neckwear Application, by Type, 2019-2022 (USD Million)
- TABLE 75 Wearable Sensors Market for Neckwear Application, by Type, 2023-2028 (USD Million)
- 8.6 bodywear
- 8.6.1 Emerging trend of techno-fashion clothing to drive market
- 8.6.2 Clothing and innerwear
- 8.6.3 Arm and legwear
- 8.6.4 Smart socks
- 8.6.5 Chest straps
- TABLE 76 Wearable Sensors Market for Bodywear Application, by Type, 2019-2022 (USD Million)
- TABLE 77 Wearable Sensors Market for Bodywear Application, by Type, 2023-2028 (USD Million)
- 8.7 other applications
- 8.7.1 Ring Scanner/Wear
- 8.7.2 Smart Headsets/Headbands
- 8.7.3 Earwear
- 8.7.4 Skin Patches
- TABLE 78 Wearable Sensors Market for Other Applications, by Type, 2019-2022 (USD Million)
- TABLE 79 Wearable Sensors Market for Other Applications, by Type, 2023-2028 (USD Million)
9 Wearable sensorS market, by vertical
- 9.1 Introduction
- FIGURE 35 Consumer goods to hold largest market during forecast period
- TABLE 80 Wearable sensors market, by Vertical, 2019-2022 (USD Million)
- TABLE 81 Wearable sensors market, by Vertical, 2023-2028 (USD Million)
- 9.2 Consumer goods
- 9.2.1 fitness and sports
- 9.2.1.1 Increased awareness toward fitness and sports to drive market
- 9.2.2 infotainment and multimedia
- 9.2.2.1 Use of wearable sensors in various communication technologies to drive market
- 9.2.3 Payment and Access Control
- 9.2.3.1 Use of wearable sensors in secure and convenient transactions and access management to drive market
- 9.2.4 Personal safety and security
- 9.2.4.1 Use of wearable sensors in safety and security applications to drive market
- 9.2.5 Garments and fashion
- 9.2.5.1 Integration of wearable sensors in fashion industry to drive market
- TABLE 82 Wearable sensors market for Consumer goods, by Type, 2019-2022 (USD Million)
- TABLE 83 Wearable sensors market for consumer goods, by Type, 2023-2028 (USD Million)
- TABLE 84 Wearable sensors market for Consumer goods, by Region, 2019-2022 (USD Million)
- TABLE 85 Wearable sensors market for Consumer goods, by Region, 2023-2028 (USD Million)
- 9.2.1 fitness and sports
- 9.3 Healthcare
- 9.3.1 Vital signs monitoring
- 9.3.1.1 Glucose monitoring
- 9.3.1.1.1 Continuous glucose monitoring
- 9.3.1.1.1.1 Providing real-time glucose monitoring levels to drive market
- 9.3.1.1.2 Non-invasive glucose monitoring
- 9.3.1.1.2.1 Non-invasive procedure to monitor blood glucose level to drive market
- 9.3.1.1.1 Continuous glucose monitoring
- 9.3.1.2 Cardiac monitoring
- 9.3.1.2.1 Enabling continuous monitoring of physiological parameters to drive market
- 9.3.1.3 Oxygen saturation level monitoring
- 9.3.1.3.1 Utilization of sensors for Oxygen saturation level monitoring to drive market
- 9.3.1.4 Blood pressure monitoring
- 9.3.1.4.1 Use of blood pressure sensors in healthcare to drive market
- 9.3.1.1 Glucose monitoring
- 9.3.2 Sleep and mental health monitoring
- 9.3.2.1 Utilization of sensors in sleep and mental health analysis to drive market
- 9.3.3 Fall and movement detection
- 9.3.3.1 Detection of safety alerts and track movement patterns to drive market
- 9.3.4 Alcohol consumption monitoring
- 9.3.4.1 Monitoring of real-time alcohol consumption to drive market
- 9.3.5 Urine Monitoring
- 9.3.5.1 Analyzing various parameters related to urine composition to drive market
- 9.3.6 Lactic Acid Monitoring
- 9.3.6.1 Detection of real-time lactate levels to drive market
- TABLE 86 Wearable sensors market for Healthcare, by Type, 2019-2022 (USD Million)
- TABLE 87 Wearable sensors market for Healthcare, by Type, 2023-2028 (USD Million)
- TABLE 88 Wearable sensors market for Healthcare, by Region, 2019-2022 (USD Million)
- TABLE 89 Wearable sensors market for Healthcare, by Region, 2023-2028 (USD Million)
- 9.3.1 Vital signs monitoring
- 9.4 Industrial
- 9.4.1 logistics, packaging, and warehouse applications
- 9.4.1.1 Increased mobility and productivity due to usage of wearable devices to drive market
- 9.4.2 other industrial verticals (chemicals, petroleum, oil and gas, and mining and construction)
- FIGURE 36 pressure and Force sensors to lead market for industrial vertical IN 2023-2028
- TABLE 90 Wearable sensors market for Industrial Vertical, by Type, 2019-2022 (USD Million)
- TABLE 91 Wearable sensors market for Industrial Vertical, by Type, 2023-2028 (USD Million)
- TABLE 92 Wearable sensors market for Industrial Vertical, by Region, 2019-2022 (USD Million)
- TABLE 93 Wearable sensors market for Industrial Vertical, by Region, 2023-2028 (USD Million)
- 9.4.1 logistics, packaging, and warehouse applications
- 9.5 Other Verticals
- FIGURE 37 Accelerometers and pressure and force sensors to hold significant market for Other Verticals between 2023 and 2028
- TABLE 94 Wearable sensors market for Other Verticals, by Type, 2019-2022 (USD Million)
- TABLE 95 Wearable sensors market for Other Verticals, by Type, 2023-2028 (USD Million)
- TABLE 96 Wearable sensors market for Other Verticals, by Region, 2019-2022 (USD Million)
- TABLE 97 Wearable sensors market for Other Verticals, by Region, 2023-2028 (USD Million)
- 10 wearable sensors market, by region
- 10.1 Introduction
- FIGURE 38 wearable sensors market: regional snapshot (2019-2022)
- TABLE 98 Wearable sensors market, by Region, 2019-2022 (USD Million)
- TABLE 99 Wearable sensors market, by Region, 2023-2028 (USD Million)
- 10.2 North America
- 10.2.1 recession impact Analysis
- FIGURE 39 north america: WEARABLE sensors market SNAPSHOT
- TABLE 100 North America: Wearable sensors market, by country, 2019-2022 (USD Million)
- TABLE 101 north america: Wearable sensors market, by country, 2023-2028 (USD Million)
- TABLE 102 North America: Wearable sensors market, by Vertical, 2019-2022 (USD Million)
- TABLE 103 north america: Wearable sensors market, by Vertical, 2023-2028 (USD Million)
- 10.2.2 US
- 10.2.2.1 Investments and innovations in healthcare and security applications to drive market
- 10.2.3 Canada
- 10.2.3.1 Increased popularity of IoT platforms to drive market
- 10.2.4 Mexico
- 10.2.4.1 Increased adoption of advanced technologies in various industries to drive market
- 10.3 Europe
- 10.3.1 recession impact analysis
- FIGURE 40 EUROPE: WEARABLE sensors market SNAPSHOT
- TABLE 104 Europe: Wearable sensors market, by country, 2019-2022 (USD Million)
- TABLE 105 Europe: Wearable sensors market, by country, 2023-2028 (USD Million)
- TABLE 106 Europe: Wearable sensors market, by Vertical, 2019-2022 (USD Million)
- TABLE 107 Europe: Wearable sensors market, by Vertical, 2023-2028 (USD Million)
- 10.3.2 GERMANY
- 10.3.2.1 Use of wearables in healthcare, sports, and fashion industries to drive market
- 10.3.3 UK
- 10.3.3.1 Advancements in healthcare sector to drive market
- 10.3.4 FRANCE
- 10.3.4.1 Adoption of advanced technology in automotive and aerospace industries to drive market
- 10.3.5 Italy
- 10.3.5.1 Adoption of wearables in health monitoring to drive market
- 10.3.6 rest of europe
- 10.4 Asia Pacific
- 10.4.1 recession impact analysis
- FIGURE 41 ASIA PACIFIC: wearable sensors market SNAPSHOT
- TABLE 108 ASIA PACIFIC: Wearable sensors market, by country, 2019-2022 (USD Million)
- TABLE 109 ASIA PACIFIC: Wearable sensors market, by country, 2023-2028 (USD Million)
- TABLE 110 Asia Pacific: Wearable sensors market, by Vertical, 2019-2022 (USD Million)
- TABLE 111 Asia Pacific: Wearable sensors market, by Vertical, 2023-2028 (USD Million)
- 10.4.2 CHINA
- 10.4.2.1 Increased implementation of wearable sensors in various sectors to drive market
- 10.4.3 JAPAN
- 10.4.3.1 Increased technological innovation in consumer electronics sector to drive market
- 10.4.4 SOUTH KOREA
- 10.4.4.1 Presence of leading firms from consumer electronics sector to drive market
- 10.4.5 India
- 10.4.5.1 Increased usage of smart devices to drive market
- 10.4.6 rest of ASIA PACIFIC
- 10.5 REST OF the WORLD
- 10.5.1 recession impact analysis
- TABLE 112 rest of the world: Wearable sensors market, by region, 2019-2022 (USD Million)
- TABLE 113 rest of the world: Wearable sensors market, by region, 2023-2028 (USD Million)
- TABLE 114 rest of the world: Wearable sensors market, by Vertical, 2019-2022 (USD Million)
- TABLE 115 rest of the world: Wearable sensors market, by Vertical, 2023-2028 (USD Million)
- 10.5.2 South America
- 10.5.2.1 Availability of affordable electronic products to drive market
- 10.5.3 MIDDLE EAST & AFRICA
- 10.5.3.1 Stringent safety requirements in oil & gas industries to drive market
11 COMPETITIVE landscape
- 11.1 overview
- TABLE 116 wearable sensors MARKET: strategies adopted by key players from 2019 to 2023
- 11.2 Wearable sensors MARKET share analysis, 2022
- FIGURE 42 Wearable sensors market share analysis, 2022
- TABLE 117 Wearable SENSORs MARKET: DEGREE OF COMPETITION
- TABLE 118 Wearable sensors MARKET: ranking analysis
- 11.3 revenue analysis of top five companies, 2020-2022
- FIGURE 43 revenue analysis of top five players in wearable sensors market, 2020-2022
- 11.4 COMPANY EVALUATION matrix
- 11.4.1 STARs
- 11.4.2 EMERGING LEADERs
- 11.4.3 PERVASIVE players
- 11.4.4 PARTICIPANTs
- FIGURE 44 Wearable sensors MARKET: COMPANY EVALUATION matrix, 2022
- 11.5 START-UP/SME EVALUATION MATRIX
- TABLE 119 START-UPS/SMEs IN wearable sensors MARKET
- 11.5.1 PROGRESSIVE COMPANies
- 11.5.2 RESPONSIVE COMPANies
- 11.5.3 DYNAMIC COMPANies
- 11.5.4 STARTING BLOCKs
- FIGURE 45 wearable sensors MARKET: START-UP/SME EVALUATION MATRIX, 2022
- TABLE 120 wearable sensors market: DETAILED LIST OF KEY START-UPs/SMEs
- 11.5.5 COMPETITIVE BENCHMARKING
- TABLE 121 wearable sensors MARKET: COMPETITIVE BENCHMARKING OF KEY START-UPs/SMes
- 11.6 COMPANY FOOTPRINT
- TABLE 122 COMPANY FOOTPRINT
- TABLE 123 COMPANY wearable sensor Type FOOTPRINT
- TABLE 124 COMPANY VertICal FOOTPRINT
- TABLE 125 COMPANY REGION FOOTPRINT
- 11.7 Competitive scenario
- 11.7.1 product launches
- TABLE 126 PRODUCT Launches, 2022-2023
- 11.7.2 DEALs
- TABLE 127 DEALS, 2021-2023
- 11.7.3 OTHERS
- TABLE 128 others, 2023
12 COMPANY OVERVIEW
- 12.1 KEY PLAYERS
- (Business Overview, Products/Services/Solutions Offered, MnM View, Key Strengths and Right to Win, Strategic Choices Made, Weaknesses and Competitive Threats, Recent Developments)**
- 12.1.1 STMicroelectronics
- TABLE 129 STmicroelectronics: COMPANY OVERVIEW
- FIGURE 46 STMicroelectronics: Company Snapshot
- TABLE 130 STmicroelectronics: PRODUCTs offered
- TABLE 131 STMICROELECTRONICS: Product launches
- 12.1.2 Infineon Technologies AG
- TABLE 132 InfINEon Technologies AG: COMPANY OVERVIEW
- FIGURE 47 Infineon Technologies AG: Company Snapshot
- TABLE 133 InfINEon Technologies ag: PRODUCTs offered
- TABLE 134 InfINEon Technologies AG: Product launches
- 12.1.3 NXP Semiconductors
- TABLE 135 NXp semiconductors: COMPANY OVERVIEW
- FIGURE 48 NXP Semiconductors: Company Snapshot
- TABLE 136 NXP SEMICONDUCTORs: PRODUcts OFFERed
- TABLE 137 Deals NXP SEMICONDUCTORs: deals
- 12.1.4 Texas Instruments Inc.
- TABLE 138 Texas Instruments INC.: COMPANY OVERVIEW
- FIGURE 49 TEXAS Instruments Inc.: Company Snapshot
- TABLE 139 Texas Instruments Inc.: PRODUCts offered
- TABLE 140 Texas Instruments inc.: Product launches
- 12.1.5 TE Connectivity
- TABLE 141 TE connectivity: COMPANY OVERVIEW
- FIGURE 50 TE Connectivity: Company Snapshot
- TABLE 142 TE CONNECTIVITY: PRODUCTs offered
- 12.1.6 Broadcom
- TABLE 143 BROADCOM: COMPANY OVERVIEW
- FIGURE 51 BROADCOM: Company Snapshot
- TABLE 144 Broadcom: PRODUCts OFFERed
- TABLE 145 Broadcom: Product launches
- 12.1.7 Analog Devices, Inc.
- TABLE 146 Analog devices, Inc.: COMPANY OVERVIEW
- FIGURE 52 Analog Devices, Inc.: Company Snapshot
- TABLE 147 Analog Devices, Inc.: PRODUcts offered
- TABLE 148 Analog Devices, Inc.: Others
- 12.1.8 Panasonic holdings Corporation
- TABLE 149 Panasonic holdings corporation: COMPANY OVERVIEW
- FIGURE 53 Panasonic holdings Corporation: Company Snapshot
- TABLE 150 panasonic holdings corporation: PRODUCTs OFFERed
- 12.1.9 Asahi Kasei Corporation
- TABLE 151 Asahi kasei corporation: COMPANY OVERVIEW
- FIGURE 54 Asahi Kasei Corporation: Company Snapshot
- TABLE 152 Asahi KASEI: PRODUCTs OFFERed
- TABLE 153 Asahi KASEI: Deals
- 12.1.10 Knowles Electronics, LLC.
- TABLE 154 Knowles ELECTRONICS, llc.: COMPANY OVERVIEW
- FIGURE 55 Knowles Electronics, LLC.: Company Snapshot
- TABLE 155 Knowles electronics, LLC.: PRODUCTs OFFERed
- TABLE 156 Knowles electronics, LLC.: Product launches
- *Business Overview, Products/Services/Solutions Offered, MnM View, Key Strengths and Right to Win, Strategic Choices Made, Weaknesses and Competitive Threats, Recent Developments might not be captured in case of unlisted companies.
- 12.2 other key players
- 12.2.1 Robert Bosch GmbH
- TABLE 157 Robert Bosch GmbH: company overview
- 12.2.2 InvenSense, Inc.
- TABLE 158 InvenSense, Inc.: company overview
- 12.2.3 MCUBE
- TABLE 159 mcube: company overview
- 12.2.4 SENSIrion ag
- TABLE 160 SENSIrion ag: company overview
- 12.2.5 ams-osram ag
- TABLE 161 ams-osram ag: company overview
- 12.2.6 Arms Limited
- TABLE 162 Arms Limited: company overview
- 12.2.7 Empatica Inc
- TABLE 163 Empatica Inc: company overview
- 12.2.8 Hexoskin
- TABLE 164 Hexoskin: company overview
- 12.2.9 Neo FEct
- TABLE 165 Neo FEct: company overview
- 12.2.10 Enflux
- TABLE 166 Enflux: company overview
- 12.2.11 HOCOMA
- TABLE 167 HOCOMA: company overview
- 12.2.12 Actofit
- TABLE 168 Actofit: company overview
- 12.2.13 Whoop
- TABLE 169 Whoop: company overview
- 12.2.14 motiv
- TABLE 170 motiv: company overview
- 12.2.15 Oura Health Oy
- TABLE 171 Oura Health Oy: company overview
13 Appendix
- 13.1 discussion guide
- 13.2 KnowledgeStore: MarketsandMarkets' subscription portal
- 13.3 customization OPTIONS
- 13.4 Related Reports
- 13.5 AUTHOR DETAILS
