|
|
市場調査レポート
商品コード
1448178
レディ・トゥ・ドリンク・シェイクの世界市場規模、シェア、動向分析レポート:タイプ別、流通チャネル別、地域別展望と予測、2023~2030年Global Ready to Drink Shakes Market Size, Share & Trends Analysis Report By Type (Bottles, Cans, and Tetra Packs), By Distribution Channel (Supermarkets, & Hypermarkets, Convenience Stores and Online), By Regional Outlook and Forecast, 2023 - 2030 |
||||||
|
|||||||
|
|||||||

| レディ・トゥ・ドリンク・シェイクの世界市場規模、シェア、動向分析レポート:タイプ別、流通チャネル別、地域別展望と予測、2023~2030年 |
|
出版日: 2024年03月07日
発行: KBV Research
ページ情報: 英文 284 Pages
納期: 即納可能
|

全表示
- 概要
- 図表
- 目次
世界のレディ・トゥ・ドリンク・シェイクの市場規模は、2030年までに159億米ドルに達すると予想されており、予測期間中に6.1%のCAGRで市場成長が見込まれます。2022年、市場は14億9,660万ユニット(200ml - 6個入りパック)の量に達し、6.7%の成長(2019~2022年)を経験しました。
KBV Cardinal matrixで示された分析に基づいています。The Coca Cola Company、PepsiCo, Inc.、Nestle SA、Abbott Laboratoriesは、レディ・トゥ・ドリンク・シェイク市場の先駆者です。2023年11月、Coca-Cola Companyの子会社であるHonest Tea, Inc.は、Honest Teaという名前で新鮮なレディ・トゥ・ドリンクのカテゴリーを導入しました。この新しいラインでは、レモントゥルシーとマンゴーのアイスグリーンティーを発売しています。この発売の主要な目的は、消費者に幅広い飲料の選択肢を提供することです。また、Danone、SA、Hormel Foods Corporation、Kellogg Companyなどの企業は、市場の主要なイノベーターの一部です。
市場の成長要因
消費者は、基本的な栄養を超え、必須栄養素のバランスのとれたプロファイルを提供する製品をますます求めています。RTDシェイクは、タンパク質、繊維、ビタミン、ミネラルを含む飲料を配合することで対応し、個人が栄養ニーズを満たす便利な方法を提供しています。したがって、これらの側面は市場の需要の増加につながります。
年配の消費者向けに設計されたRTDシェイクは、多くの場合、栄養価の高い配合を特徴としています。これらの飲料には、加齢に伴う栄養要件の変化に対応するために必須のビタミンやミネラルが豊富に含まれています。したがって、これらの側面は市場の成長に役立ちます。
市場の抑制要因
保存安定性を実現するための加工には、添加剤や保存料が含まれることがよくあります。一部の消費者は、食品・飲料にこれらの成分が含まれていることに懸念を表明し、潜在的な健康リスクを関連付けています。したがって、これらの側面は市場の成長を抑制する可能性があります。
目次
第1章 市場範囲と調査手法
- 市場の定義
- 目的
- 市場範囲
- セグメンテーション
- 調査手法
第2章 市場要覧
- 主要なハイライト
第3章 市場概要
- イントロダクション
- 概要
- 市場構成とシナリオ
- 概要
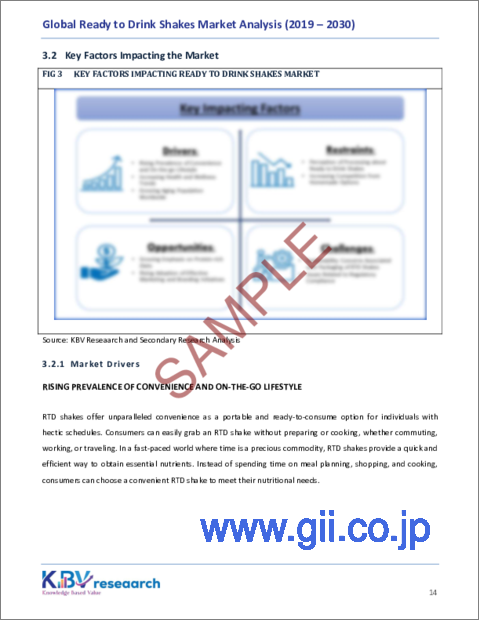
- 市場に影響を与える主要な要因
- 市場促進要因
- 市場抑制要因
- 市場機会
- 市場の課題
第4章 競合分析 - 世界
- KBV Cardinal Matrix
- 最近の業界全体の戦略的展開
- パートナーシップ、コラボレーション、契約
- 製品の発売と製品の拡大
- 買収と合併
- 主要成功戦略
- 主要な戦略
- 主要な戦略的動き
- ポーターのファイブフォース分析
第5章 世界市場:タイプ別
- 世界のボトル市場:地域別
- 世界の缶市場:地域別
- 世界のテトラパック市場:地域別
第6章 世界市場:流通チャネル別
- 世界のスーパーマーケット・ハイパーマーケット市場:地域別
- 世界のコンビニエンスストア市場:地域別
- 世界のオンライン市場:地域別
第7章 世界市場:地域別
- 北米
- 北米の市場:国別
- 米国
- カナダ
- メキシコ
- その他北米地域
- 北米の市場:国別
- 欧州
- 欧州の市場:国別
- ドイツ
- 英国
- フランス
- ロシア
- スペイン
- イタリア
- その他欧州地域
- 欧州の市場:国別
- アジア太平洋
- アジア太平洋の市場:国別
- 中国
- 日本
- インド
- 韓国
- オーストラリア
- マレーシア
- その他アジア太平洋
- アジア太平洋の市場:国別
- ラテンアメリカ・中東・アフリカ
- ラテンアメリカ・中東・アフリカの市場:国別
- ブラジル
- アルゼンチン
- アラブ首長国連邦
- サウジアラビア
- 南アフリカ
- ナイジェリア
- その他ラテンアメリカ・中東・アフリカ地域
- ラテンアメリカ・中東・アフリカの市場:国別
第8章 企業プロファイル
- Abbott Laboratories
- Kellogg Company
- The Coca Cola Company
- PepsiCo, Inc
- Nestle SA
- Hormel Foods Corporation(MegaMex Foods, LLC)
- Danone SA
- Campbell Soup Company
- KeHE Distributors, LLC
- Huel Limited
第9章 レディ・トゥ・ドリンク・シェイク市場での成功必須条件
LIST OF TABLES
- TABLE 1Global Ready to Drink Shakes Market, 2019 - 2022, USD Million
- TABLE 2Global Ready to Drink Shakes Market, 2023 - 2030, USD Million
- TABLE 3Global Ready to Drink Shakes Market, 2019 - 2022, Million Units (200 ml - pack of 6)
- TABLE 4Global Ready to Drink Shakes Market, 2023 - 2030, Million Units (200 ml - pack of 6)
- TABLE 5Partnerships, Collaborations and Agreements- Ready to Drink Shakes Market
- TABLE 6Product Launches And Product Expansions- Ready to Drink Shakes Market
- TABLE 7Acquisition and Mergers- Ready to Drink Shakes Market
- TABLE 8Global Ready to Drink Shakes Market by Type, 2019 - 2022, USD Million
- TABLE 9Global Ready to Drink Shakes Market by Type, 2023 - 2030, USD Million
- TABLE 10Global Ready to Drink Shakes Market by Type, 2019 - 2022, Million Units (200 ml - pack of 6)
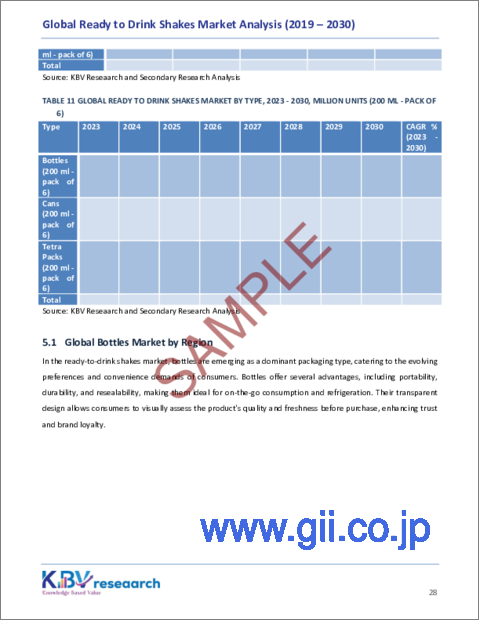
- TABLE 11Global Ready to Drink Shakes Market by Type, 2023 - 2030, Million Units (200 ml - pack of 6)
- TABLE 12Global Bottles Market by Region, 2019 - 2022, USD Million
- TABLE 13Global Bottles Market by Region, 2023 - 2030, USD Million
- TABLE 14Global Bottles (200 ml - pack of 6) Market by Region, 2019 - 2022, Million Units (200 ml - pack of 6)
- TABLE 15Global Bottles (200 ml - pack of 6) Market by Region, 2023 - 2030, Million Units (200 ml - pack of 6)
- TABLE 16Global Cans Market by Region, 2019 - 2022, USD Million
- TABLE 17Global Cans Market by Region, 2023 - 2030, USD Million
- TABLE 18Global Cans (200 ml - pack of 6) Market by Region, 2019 - 2022, Million Units (200 ml - pack of 6)
- TABLE 19Global Cans (200 ml - pack of 6) Market by Region, 2023 - 2030, Million Units (200 ml - pack of 6)
- TABLE 20Global Tetra Packs Market by Region, 2019 - 2022, USD Million
- TABLE 21Global Tetra Packs Market by Region, 2023 - 2030, USD Million
- TABLE 22Global Tetra Packs (200 ml - pack of 6) Market by Region, 2019 - 2022, Million Units (200 ml - pack of 6)
- TABLE 23Global Tetra Packs (200 ml - pack of 6) Market by Region, 2023 - 2030, Million Units (200 ml - pack of 6)
- TABLE 24Global Ready to Drink Shakes Market by Distribution Channel, 2019 - 2022, USD Million
- TABLE 25Global Ready to Drink Shakes Market by Distribution Channel, 2023 - 2030, USD Million
- TABLE 26Global Ready to Drink Shakes Market by Distribution Channel, 2019 - 2022, Million Units (200 ml - pack of 6)
- TABLE 27Global Ready to Drink Shakes Market by Distribution Channel, 2023 - 2030, Million Units (200 ml - pack of 6)
- TABLE 28Global Supermarkets & Hypermarkets Market by Region, 2019 - 2022, USD Million
- TABLE 29Global Supermarkets & Hypermarkets Market by Region, 2023 - 2030, USD Million
- TABLE 30Global Supermarkets & Hypermarkets Market by Region, 2019 - 2022, Million Units (200 ml - pack of 6)
- TABLE 31Global Supermarkets & Hypermarkets Market by Region, 2023 - 2030, Million Units (200 ml - pack of 6)
- TABLE 32Global Convenience Stores Market by Region, 2019 - 2022, USD Million
- TABLE 33Global Convenience Stores Market by Region, 2023 - 2030, USD Million
- TABLE 34Global Convenience Stores Market by Region, 2019 - 2022, Million Units (200 ml - pack of 6)
- TABLE 35Global Convenience Stores Market by Region, 2023 - 2030, Million Units (200 ml - pack of 6)
- TABLE 36Global Online Market by Region, 2019 - 2022, USD Million
- TABLE 37Global Online Market by Region, 2023 - 2030, USD Million
- TABLE 38Global Online Market by Region, 2019 - 2022, Million Units (200 ml - pack of 6)
- TABLE 39Global Online Market by Region, 2023 - 2030, Million Units (200 ml - pack of 6)
- TABLE 40Global Ready to Drink Shakes Market by Region, 2019 - 2022, USD Million
- TABLE 41Global Ready to Drink Shakes Market by Region, 2023 - 2030, USD Million
- TABLE 42Global Ready to Drink Shakes Market by Region, 2019 - 2022, Million Units (200 ml - pack of 6)
- TABLE 43Global Ready to Drink Shakes Market by Region, 2023 - 2030, Million Units (200 ml - pack of 6)
- TABLE 44North America Ready to Drink Shakes Market, 2019 - 2022, USD Million
- TABLE 45North America Ready to Drink Shakes Market, 2023 - 2030, USD Million
- TABLE 46North America Ready to Drink Shakes Market, 2019 - 2022, Million Units (200 ml - pack of 6)
- TABLE 47North America Ready to Drink Shakes Market, 2023 - 2030, Million Units (200 ml - pack of 6)
- TABLE 48North America Ready to Drink Shakes Market by Type, 2019 - 2022, USD Million
- TABLE 49North America Ready to Drink Shakes Market by Type, 2023 - 2030, USD Million
- TABLE 50North America Ready to Drink Shakes Market by Type, 2019 - 2022, Million Units (200 ml - pack of 6)
- TABLE 51North America Ready to Drink Shakes Market by Type, 2023 - 2030, Million Units (200 ml - pack of 6)
- TABLE 52North America Bottles Market by Country, 2019 - 2022, USD Million
- TABLE 53North America Bottles Market by Country, 2023 - 2030, USD Million
- TABLE 54North America Bottles (200 ml - pack of 6) Market by Country, 2019 - 2022, Million Units (200 ml - pack of 6)
- TABLE 55North America Bottles (200 ml - pack of 6) Market by Country, 2023 - 2030, Million Units (200 ml - pack of 6)
- TABLE 56North America Cans Market by Country, 2019 - 2022, USD Million
- TABLE 57North America Cans Market by Country, 2023 - 2030, USD Million
- TABLE 58North America Cans (200 ml - pack of 6) Market by Country, 2019 - 2022, Million Units (200 ml - pack of 6)
- TABLE 59North America Cans (200 ml - pack of 6) Market by Country, 2023 - 2030, Million Units (200 ml - pack of 6)
- TABLE 60North America Tetra Packs Market by Country, 2019 - 2022, USD Million
- TABLE 61North America Tetra Packs Market by Country, 2023 - 2030, USD Million
- TABLE 62North America Tetra Packs (200 ml - pack of 6) Market by Country, 2019 - 2022, Million Units (200 ml - pack of 6)
- TABLE 63North America Tetra Packs (200 ml - pack of 6) Market by Country, 2023 - 2030, Million Units (200 ml - pack of 6)
- TABLE 64North America Ready to Drink Shakes Market by Distribution Channel, 2019 - 2022, USD Million
- TABLE 65North America Ready to Drink Shakes Market by Distribution Channel, 2023 - 2030, USD Million
- TABLE 66North America Ready to Drink Shakes Market by Distribution Channel, 2019 - 2022, Million Units (200 ml - pack of 6)
- TABLE 67North America Ready to Drink Shakes Market by Distribution Channel, 2023 - 2030, Million Units (200 ml - pack of 6)
- TABLE 68North America Supermarkets & Hypermarkets Market by Country, 2019 - 2022, USD Million
- TABLE 69North America Supermarkets & Hypermarkets Market by Country, 2023 - 2030, USD Million
- TABLE 70North America Supermarkets & Hypermarkets Market by Country, 2019 - 2022, Million Units (200 ml - pack of 6)
- TABLE 71North America Supermarkets & Hypermarkets Market by Country, 2023 - 2030, Million Units (200 ml - pack of 6)
- TABLE 72North America Convenience Stores Market by Country, 2019 - 2022, USD Million
- TABLE 73North America Convenience Stores Market by Country, 2023 - 2030, USD Million
- TABLE 74North America Convenience Stores Market by Country, 2019 - 2022, Million Units (200 ml - pack of 6)
- TABLE 75North America Convenience Stores Market by Country, 2023 - 2030, Million Units (200 ml - pack of 6)
- TABLE 76North America Online Market by Country, 2019 - 2022, USD Million
- TABLE 77North America Online Market by Country, 2023 - 2030, USD Million
- TABLE 78North America Online Market by Country, 2019 - 2022, Million Units (200 ml - pack of 6)
- TABLE 79North America Online Market by Country, 2023 - 2030, Million Units (200 ml - pack of 6)
- TABLE 80North America Ready to Drink Shakes Market by Country, 2019 - 2022, USD Million
- TABLE 81North America Ready to Drink Shakes Market by Country, 2023 - 2030, USD Million
- TABLE 82North America Ready to Drink Shakes Market by Country, 2019 - 2022, Million Units (200 ml - pack of 6)
- TABLE 83North America Ready to Drink Shakes Market by Country, 2023 - 2030, Million Units (200 ml - pack of 6)
- TABLE 84US Ready to Drink Shakes Market, 2019 - 2022, USD Million
- TABLE 85US Ready to Drink Shakes Market, 2023 - 2030, USD Million
- TABLE 86US Ready to Drink Shakes Market, 2019 - 2022, Million Units (200 ml - pack of 6)
- TABLE 87US Ready to Drink Shakes Market, 2023 - 2030, Million Units (200 ml - pack of 6)
- TABLE 88US Ready to Drink Shakes Market by Type, 2019 - 2022, USD Million
- TABLE 89US Ready to Drink Shakes Market by Type, 2023 - 2030, USD Million
- TABLE 90US Ready to Drink Shakes Market by Type, 2019 - 2022, Million Units (200 ml - pack of 6)
- TABLE 91US Ready to Drink Shakes Market by Type, 2023 - 2030, Million Units (200 ml - pack of 6)
- TABLE 92US Ready to Drink Shakes Market by Distribution Channel, 2019 - 2022, USD Million
- TABLE 93US Ready to Drink Shakes Market by Distribution Channel, 2023 - 2030, USD Million
- TABLE 94US Ready to Drink Shakes Market by Distribution Channel, 2019 - 2022, Million Units (200 ml - pack of 6)
- TABLE 95US Ready to Drink Shakes Market by Distribution Channel, 2023 - 2030, Million Units (200 ml - pack of 6)
- TABLE 96Canada Ready to Drink Shakes Market, 2019 - 2022, USD Million
- TABLE 97Canada Ready to Drink Shakes Market, 2023 - 2030, USD Million
- TABLE 98Canada Ready to Drink Shakes Market, 2019 - 2022, Million Units (200 ml - pack of 6)
- TABLE 99Canada Ready to Drink Shakes Market, 2023 - 2030, Million Units (200 ml - pack of 6)
- TABLE 100Canada Ready to Drink Shakes Market by Type, 2019 - 2022, USD Million
- TABLE 101Canada Ready to Drink Shakes Market by Type, 2023 - 2030, USD Million
- TABLE 102Canada Ready to Drink Shakes Market by Type, 2019 - 2022, Million Units (200 ml - pack of 6)
- TABLE 103Canada Ready to Drink Shakes Market by Type, 2023 - 2030, Million Units (200 ml - pack of 6)
- TABLE 104Canada Ready to Drink Shakes Market by Distribution Channel, 2019 - 2022, USD Million
- TABLE 105Canada Ready to Drink Shakes Market by Distribution Channel, 2023 - 2030, USD Million
- TABLE 106Canada Ready to Drink Shakes Market by Distribution Channel, 2019 - 2022, Million Units (200 ml - pack of 6)
- TABLE 107Canada Ready to Drink Shakes Market by Distribution Channel, 2023 - 2030, Million Units (200 ml - pack of 6)
- TABLE 108Mexico Ready to Drink Shakes Market, 2019 - 2022, USD Million
- TABLE 109Mexico Ready to Drink Shakes Market, 2023 - 2030, USD Million
- TABLE 110Mexico Ready to Drink Shakes Market, 2019 - 2022, Million Units (200 ml - pack of 6)
- TABLE 111Mexico Ready to Drink Shakes Market, 2023 - 2030, Million Units (200 ml - pack of 6)
- TABLE 112Mexico Ready to Drink Shakes Market by Type, 2019 - 2022, USD Million
- TABLE 113Mexico Ready to Drink Shakes Market by Type, 2023 - 2030, USD Million
- TABLE 114Mexico Ready to Drink Shakes Market by Type, 2019 - 2022, Million Units (200 ml - pack of 6)
- TABLE 115Mexico Ready to Drink Shakes Market by Type, 2023 - 2030, Million Units (200 ml - pack of 6)
- TABLE 116Mexico Ready to Drink Shakes Market by Distribution Channel, 2019 - 2022, USD Million
- TABLE 117Mexico Ready to Drink Shakes Market by Distribution Channel, 2023 - 2030, USD Million
- TABLE 118Mexico Ready to Drink Shakes Market by Distribution Channel, 2019 - 2022, Million Units (200 ml - pack of 6)
- TABLE 119Mexico Ready to Drink Shakes Market by Distribution Channel, 2023 - 2030, Million Units (200 ml - pack of 6)
- TABLE 120Rest of North America Ready to Drink Shakes Market, 2019 - 2022, USD Million
- TABLE 121Rest of North America Ready to Drink Shakes Market, 2023 - 2030, USD Million
- TABLE 122Rest of North America Ready to Drink Shakes Market, 2019 - 2022, Million Units (200 ml - pack of 6)
- TABLE 123Rest of North America Ready to Drink Shakes Market, 2023 - 2030, Million Units (200 ml - pack of 6)
- TABLE 124Rest of North America Ready to Drink Shakes Market by Type, 2019 - 2022, USD Million
- TABLE 125Rest of North America Ready to Drink Shakes Market by Type, 2023 - 2030, USD Million
- TABLE 126Rest of North America Ready to Drink Shakes Market by Type, 2019 - 2022, Million Units (200 ml - pack of 6)
- TABLE 127Rest of North America Ready to Drink Shakes Market by Type, 2023 - 2030, Million Units (200 ml - pack of 6)
- TABLE 128Rest of North America Ready to Drink Shakes Market by Distribution Channel, 2019 - 2022, USD Million
- TABLE 129Rest of North America Ready to Drink Shakes Market by Distribution Channel, 2023 - 2030, USD Million
- TABLE 130Rest of North America Ready to Drink Shakes Market by Distribution Channel, 2019 - 2022, Million Units (200 ml - pack of 6)
- TABLE 131Rest of North America Ready to Drink Shakes Market by Distribution Channel, 2023 - 2030, Million Units (200 ml - pack of 6)
- TABLE 132Europe Ready to Drink Shakes Market, 2019 - 2022, USD Million
- TABLE 133Europe Ready to Drink Shakes Market, 2023 - 2030, USD Million
- TABLE 134Europe Ready to Drink Shakes Market, 2019 - 2022, Million Units (200 ml - pack of 6)
- TABLE 135Europe Ready to Drink Shakes Market, 2023 - 2030, Million Units (200 ml - pack of 6)
- TABLE 136Europe Ready to Drink Shakes Market by Type, 2019 - 2022, USD Million
- TABLE 137Europe Ready to Drink Shakes Market by Type, 2023 - 2030, USD Million
- TABLE 138Europe Ready to Drink Shakes Market by Type, 2019 - 2022, Million Units (200 ml - pack of 6)
- TABLE 139Europe Ready to Drink Shakes Market by Type, 2023 - 2030, Million Units (200 ml - pack of 6)
- TABLE 140Europe Bottles Market by Country, 2019 - 2022, USD Million
- TABLE 141Europe Bottles Market by Country, 2023 - 2030, USD Million
- TABLE 142Europe Bottles (200 ml - pack of 6) Market by Country, 2019 - 2022, Million Units (200 ml - pack of 6)
- TABLE 143Europe Bottles (200 ml - pack of 6) Market by Country, 2023 - 2030, Million Units (200 ml - pack of 6)
- TABLE 144Europe Cans Market by Country, 2019 - 2022, USD Million
- TABLE 145Europe Cans Market by Country, 2023 - 2030, USD Million
- TABLE 146Europe Cans (200 ml - pack of 6) Market by Country, 2019 - 2022, Million Units (200 ml - pack of 6)
- TABLE 147Europe Cans (200 ml - pack of 6) Market by Country, 2023 - 2030, Million Units (200 ml - pack of 6)
- TABLE 148Europe Tetra Packs Market by Country, 2019 - 2022, USD Million
- TABLE 149Europe Tetra Packs Market by Country, 2023 - 2030, USD Million
- TABLE 150Europe Tetra Packs (200 ml - pack of 6) Market by Country, 2019 - 2022, Million Units (200 ml - pack of 6)
- TABLE 151Europe Tetra Packs (200 ml - pack of 6) Market by Country, 2023 - 2030, Million Units (200 ml - pack of 6)
- TABLE 152Europe Ready to Drink Shakes Market by Distribution Channel, 2019 - 2022, USD Million
- TABLE 153Europe Ready to Drink Shakes Market by Distribution Channel, 2023 - 2030, USD Million
- TABLE 154Europe Ready to Drink Shakes Market by Distribution Channel, 2019 - 2022, Million Units (200 ml - pack of 6)
- TABLE 155Europe Ready to Drink Shakes Market by Distribution Channel, 2023 - 2030, Million Units (200 ml - pack of 6)
- TABLE 156Europe Supermarkets & Hypermarkets Market by Country, 2019 - 2022, USD Million
- TABLE 157Europe Supermarkets & Hypermarkets Market by Country, 2023 - 2030, USD Million
- TABLE 158Europe Supermarkets & Hypermarkets Market by Country, 2019 - 2022, Million Units (200 ml - pack of 6)
- TABLE 159Europe Supermarkets & Hypermarkets Market by Country, 2023 - 2030, Million Units (200 ml - pack of 6)
- TABLE 160Europe Convenience Stores Market by Country, 2019 - 2022, USD Million
- TABLE 161Europe Convenience Stores Market by Country, 2023 - 2030, USD Million
- TABLE 162Europe Convenience Stores Market by Country, 2019 - 2022, Million Units (200 ml - pack of 6)
- TABLE 163Europe Convenience Stores Market by Country, 2023 - 2030, Million Units (200 ml - pack of 6)
- TABLE 164Europe Online Market by Country, 2019 - 2022, USD Million
- TABLE 165Europe Online Market by Country, 2023 - 2030, USD Million
- TABLE 166Europe Online Market by Country, 2019 - 2022, Million Units (200 ml - pack of 6)
- TABLE 167Europe Online Market by Country, 2023 - 2030, Million Units (200 ml - pack of 6)
- TABLE 168Europe Ready to Drink Shakes Market by Country, 2019 - 2022, USD Million
- TABLE 169Europe Ready to Drink Shakes Market by Country, 2023 - 2030, USD Million
- TABLE 170Europe Ready to Drink Shakes Market by Country, 2019 - 2022, Million Units (200 ml - pack of 6)
- TABLE 171Europe Ready to Drink Shakes Market by Country, 2023 - 2030, Million Units (200 ml - pack of 6)
- TABLE 172Germany Ready to Drink Shakes Market, 2019 - 2022, USD Million
- TABLE 173Germany Ready to Drink Shakes Market, 2023 - 2030, USD Million
- TABLE 174Germany Ready to Drink Shakes Market, 2019 - 2022, Million Units (200 ml - pack of 6)
- TABLE 175Germany Ready to Drink Shakes Market, 2023 - 2030, Million Units (200 ml - pack of 6)
- TABLE 176Germany Ready to Drink Shakes Market by Type, 2019 - 2022, USD Million
- TABLE 177Germany Ready to Drink Shakes Market by Type, 2023 - 2030, USD Million
- TABLE 178Germany Ready to Drink Shakes Market by Type, 2019 - 2022, Million Units (200 ml - pack of 6)
- TABLE 179Germany Ready to Drink Shakes Market by Type, 2023 - 2030, Million Units (200 ml - pack of 6)
- TABLE 180Germany Ready to Drink Shakes Market by Distribution Channel, 2019 - 2022, USD Million
- TABLE 181Germany Ready to Drink Shakes Market by Distribution Channel, 2023 - 2030, USD Million
- TABLE 182Germany Ready to Drink Shakes Market by Distribution Channel, 2019 - 2022, Million Units (200 ml - pack of 6)
- TABLE 183Germany Ready to Drink Shakes Market by Distribution Channel, 2023 - 2030, Million Units (200 ml - pack of 6)
- TABLE 184UK Ready to Drink Shakes Market, 2019 - 2022, USD Million
- TABLE 185UK Ready to Drink Shakes Market, 2023 - 2030, USD Million
- TABLE 186UK Ready to Drink Shakes Market, 2019 - 2022, Million Units (200 ml - pack of 6)
- TABLE 187UK Ready to Drink Shakes Market, 2023 - 2030, Million Units (200 ml - pack of 6)
- TABLE 188UK Ready to Drink Shakes Market by Type, 2019 - 2022, USD Million
- TABLE 189UK Ready to Drink Shakes Market by Type, 2023 - 2030, USD Million
- TABLE 190UK Ready to Drink Shakes Market by Type, 2019 - 2022, Million Units (200 ml - pack of 6)
- TABLE 191UK Ready to Drink Shakes Market by Type, 2023 - 2030, Million Units (200 ml - pack of 6)
- TABLE 192UK Ready to Drink Shakes Market by Distribution Channel, 2019 - 2022, USD Million
- TABLE 193UK Ready to Drink Shakes Market by Distribution Channel, 2023 - 2030, USD Million
- TABLE 194UK Ready to Drink Shakes Market by Distribution Channel, 2019 - 2022, Million Units (200 ml - pack of 6)
- TABLE 195UK Ready to Drink Shakes Market by Distribution Channel, 2023 - 2030, Million Units (200 ml - pack of 6)
- TABLE 196France Ready to Drink Shakes Market, 2019 - 2022, USD Million
- TABLE 197France Ready to Drink Shakes Market, 2023 - 2030, USD Million
- TABLE 198France Ready to Drink Shakes Market, 2019 - 2022, Million Units (200 ml - pack of 6)
- TABLE 199France Ready to Drink Shakes Market, 2023 - 2030, Million Units (200 ml - pack of 6)
- TABLE 200France Ready to Drink Shakes Market by Type, 2019 - 2022, USD Million
- TABLE 201France Ready to Drink Shakes Market by Type, 2023 - 2030, USD Million
- TABLE 202France Ready to Drink Shakes Market by Type, 2019 - 2022, Million Units (200 ml - pack of 6)
- TABLE 203France Ready to Drink Shakes Market by Type, 2023 - 2030, Million Units (200 ml - pack of 6)
- TABLE 204France Ready to Drink Shakes Market by Distribution Channel, 2019 - 2022, USD Million
- TABLE 205France Ready to Drink Shakes Market by Distribution Channel, 2023 - 2030, USD Million
- TABLE 206France Ready to Drink Shakes Market by Distribution Channel, 2019 - 2022, Million Units (200 ml - pack of 6)
- TABLE 207France Ready to Drink Shakes Market by Distribution Channel, 2023 - 2030, Million Units (200 ml - pack of 6)
- TABLE 208Russia Ready to Drink Shakes Market, 2019 - 2022, USD Million
- TABLE 209Russia Ready to Drink Shakes Market, 2023 - 2030, USD Million
- TABLE 210Russia Ready to Drink Shakes Market, 2019 - 2022, Million Units (200 ml - pack of 6)
- TABLE 211Russia Ready to Drink Shakes Market, 2023 - 2030, Million Units (200 ml - pack of 6)
- TABLE 212Russia Ready to Drink Shakes Market by Type, 2019 - 2022, USD Million
- TABLE 213Russia Ready to Drink Shakes Market by Type, 2023 - 2030, USD Million
- TABLE 214Russia Ready to Drink Shakes Market by Type, 2019 - 2022, Million Units (200 ml - pack of 6)
- TABLE 215Russia Ready to Drink Shakes Market by Type, 2023 - 2030, Million Units (200 ml - pack of 6)
- TABLE 216Russia Ready to Drink Shakes Market by Distribution Channel, 2019 - 2022, USD Million
- TABLE 217Russia Ready to Drink Shakes Market by Distribution Channel, 2023 - 2030, USD Million
- TABLE 218Russia Ready to Drink Shakes Market by Distribution Channel, 2019 - 2022, Million Units (200 ml - pack of 6)
- TABLE 219Russia Ready to Drink Shakes Market by Distribution Channel, 2023 - 2030, Million Units (200 ml - pack of 6)
- TABLE 220Spain Ready to Drink Shakes Market, 2019 - 2022, USD Million
- TABLE 221Spain Ready to Drink Shakes Market, 2023 - 2030, USD Million
- TABLE 222Spain Ready to Drink Shakes Market, 2019 - 2022, Million Units (200 ml - pack of 6)
- TABLE 223Spain Ready to Drink Shakes Market, 2023 - 2030, Million Units (200 ml - pack of 6)
- TABLE 224Spain Ready to Drink Shakes Market by Type, 2019 - 2022, USD Million
- TABLE 225Spain Ready to Drink Shakes Market by Type, 2023 - 2030, USD Million
- TABLE 226Spain Ready to Drink Shakes Market by Type, 2019 - 2022, Million Units (200 ml - pack of 6)
- TABLE 227Spain Ready to Drink Shakes Market by Type, 2023 - 2030, Million Units (200 ml - pack of 6)
- TABLE 228Spain Ready to Drink Shakes Market by Distribution Channel, 2019 - 2022, USD Million
- TABLE 229Spain Ready to Drink Shakes Market by Distribution Channel, 2023 - 2030, USD Million
- TABLE 230Spain Ready to Drink Shakes Market by Distribution Channel, 2019 - 2022, Million Units (200 ml - pack of 6)
- TABLE 231Spain Ready to Drink Shakes Market by Distribution Channel, 2023 - 2030, Million Units (200 ml - pack of 6)
- TABLE 232Italy Ready to Drink Shakes Market, 2019 - 2022, USD Million
- TABLE 233Italy Ready to Drink Shakes Market, 2023 - 2030, USD Million
- TABLE 234Italy Ready to Drink Shakes Market, 2019 - 2022, Million Units (200 ml - pack of 6)
- TABLE 235Italy Ready to Drink Shakes Market, 2023 - 2030, Million Units (200 ml - pack of 6)
- TABLE 236Italy Ready to Drink Shakes Market by Type, 2019 - 2022, USD Million
- TABLE 237Italy Ready to Drink Shakes Market by Type, 2023 - 2030, USD Million
- TABLE 238Italy Ready to Drink Shakes Market by Type, 2019 - 2022, Million Units (200 ml - pack of 6)
- TABLE 239Italy Ready to Drink Shakes Market by Type, 2023 - 2030, Million Units (200 ml - pack of 6)
- TABLE 240Italy Ready to Drink Shakes Market by Distribution Channel, 2019 - 2022, USD Million
- TABLE 241Italy Ready to Drink Shakes Market by Distribution Channel, 2023 - 2030, USD Million
- TABLE 242Italy Ready to Drink Shakes Market by Distribution Channel, 2019 - 2022, Million Units (200 ml - pack of 6)
- TABLE 243Italy Ready to Drink Shakes Market by Distribution Channel, 2023 - 2030, Million Units (200 ml - pack of 6)
- TABLE 244Rest of Europe Ready to Drink Shakes Market, 2019 - 2022, USD Million
- TABLE 245Rest of Europe Ready to Drink Shakes Market, 2023 - 2030, USD Million
- TABLE 246Rest of Europe Ready to Drink Shakes Market, 2019 - 2022, Million Units (200 ml - pack of 6)
- TABLE 247Rest of Europe Ready to Drink Shakes Market, 2023 - 2030, Million Units (200 ml - pack of 6)
- TABLE 248Rest of Europe Ready to Drink Shakes Market by Type, 2019 - 2022, USD Million
- TABLE 249Rest of Europe Ready to Drink Shakes Market by Type, 2023 - 2030, USD Million
- TABLE 250Rest of Europe Ready to Drink Shakes Market by Type, 2019 - 2022, Million Units (200 ml - pack of 6)
- TABLE 251Rest of Europe Ready to Drink Shakes Market by Type, 2023 - 2030, Million Units (200 ml - pack of 6)
- TABLE 252Rest of Europe Ready to Drink Shakes Market by Distribution Channel, 2019 - 2022, USD Million
- TABLE 253Rest of Europe Ready to Drink Shakes Market by Distribution Channel, 2023 - 2030, USD Million
- TABLE 254Rest of Europe Ready to Drink Shakes Market by Distribution Channel, 2019 - 2022, Million Units (200 ml - pack of 6)
- TABLE 255Rest of Europe Ready to Drink Shakes Market by Distribution Channel, 2023 - 2030, Million Units (200 ml - pack of 6)
- TABLE 256Asia Pacific Ready to Drink Shakes Market, 2019 - 2022, USD Million
- TABLE 257Asia Pacific Ready to Drink Shakes Market, 2023 - 2030, USD Million
- TABLE 258Asia Pacific Ready to Drink Shakes Market, 2019 - 2022, Million Units (200 ml - pack of 6)
- TABLE 259Asia Pacific Ready to Drink Shakes Market, 2023 - 2030, Million Units (200 ml - pack of 6)
- TABLE 260Asia Pacific Ready to Drink Shakes Market by Type, 2019 - 2022, USD Million
- TABLE 261Asia Pacific Ready to Drink Shakes Market by Type, 2023 - 2030, USD Million
- TABLE 262Asia Pacific Ready to Drink Shakes Market by Type, 2019 - 2022, Million Units (200 ml - pack of 6)
- TABLE 263Asia Pacific Ready to Drink Shakes Market by Type, 2023 - 2030, Million Units (200 ml - pack of 6)
- TABLE 264Asia Pacific Bottles Market by Country, 2019 - 2022, USD Million
- TABLE 265Asia Pacific Bottles Market by Country, 2023 - 2030, USD Million
- TABLE 266Asia Pacific Bottles (200 ml - pack of 6) Market by Country, 2019 - 2022, Million Units (200 ml - pack of 6)
- TABLE 267Asia Pacific Bottles (200 ml - pack of 6) Market by Country, 2023 - 2030, Million Units (200 ml - pack of 6)
- TABLE 268Asia Pacific Cans Market by Country, 2019 - 2022, USD Million
- TABLE 269Asia Pacific Cans Market by Country, 2023 - 2030, USD Million
- TABLE 270Asia Pacific Cans (200 ml - pack of 6) Market by Country, 2019 - 2022, Million Units (200 ml - pack of 6)
- TABLE 271Asia Pacific Cans (200 ml - pack of 6) Market by Country, 2023 - 2030, Million Units (200 ml - pack of 6)
- TABLE 272Asia Pacific Tetra Packs Market by Country, 2019 - 2022, USD Million
- TABLE 273Asia Pacific Tetra Packs Market by Country, 2023 - 2030, USD Million
- TABLE 274Asia Pacific Tetra Packs (200 ml - pack of 6) Market by Country, 2019 - 2022, Million Units (200 ml - pack of 6)
- TABLE 275Asia Pacific Tetra Packs (200 ml - pack of 6) Market by Country, 2023 - 2030, Million Units (200 ml - pack of 6)
- TABLE 276Asia Pacific Ready to Drink Shakes Market by Distribution Channel, 2019 - 2022, USD Million
- TABLE 277Asia Pacific Ready to Drink Shakes Market by Distribution Channel, 2023 - 2030, USD Million
- TABLE 278Asia Pacific Ready to Drink Shakes Market by Distribution Channel, 2019 - 2022, Million Units (200 ml - pack of 6)
- TABLE 279Asia Pacific Ready to Drink Shakes Market by Distribution Channel, 2023 - 2030, Million Units (200 ml - pack of 6)
- TABLE 280Asia Pacific Supermarkets & Hypermarkets Market by Country, 2019 - 2022, USD Million
- TABLE 281Asia Pacific Supermarkets & Hypermarkets Market by Country, 2023 - 2030, USD Million
- TABLE 282Asia Pacific Supermarkets & Hypermarkets Market by Country, 2019 - 2022, Million Units (200 ml - pack of 6)
- TABLE 283Asia Pacific Supermarkets & Hypermarkets Market by Country, 2023 - 2030, Million Units (200 ml - pack of 6)
- TABLE 284Asia Pacific Convenience Stores Market by Country, 2019 - 2022, USD Million
- TABLE 285Asia Pacific Convenience Stores Market by Country, 2023 - 2030, USD Million
- TABLE 286Asia Pacific Convenience Stores Market by Country, 2019 - 2022, Million Units (200 ml - pack of 6)
- TABLE 287Asia Pacific Convenience Stores Market by Country, 2023 - 2030, Million Units (200 ml - pack of 6)
- TABLE 288Asia Pacific Online Market by Country, 2019 - 2022, USD Million
- TABLE 289Asia Pacific Online Market by Country, 2023 - 2030, USD Million
- TABLE 290Asia Pacific Online Market by Country, 2019 - 2022, Million Units (200 ml - pack of 6)
- TABLE 291Asia Pacific Online Market by Country, 2023 - 2030, Million Units (200 ml - pack of 6)
- TABLE 292Asia Pacific Ready to Drink Shakes Market by Country, 2019 - 2022, USD Million
- TABLE 293Asia Pacific Ready to Drink Shakes Market by Country, 2023 - 2030, USD Million
- TABLE 294Asia Pacific Ready to Drink Shakes Market by Country, 2019 - 2022, Million Units (200 ml - pack of 6)
- TABLE 295Asia Pacific Ready to Drink Shakes Market by Country, 2023 - 2030, Million Units (200 ml - pack of 6)
- TABLE 296China Ready to Drink Shakes Market, 2019 - 2022, USD Million
- TABLE 297China Ready to Drink Shakes Market, 2023 - 2030, USD Million
- TABLE 298China Ready to Drink Shakes Market, 2019 - 2022, Million Units (200 ml - pack of 6)
- TABLE 299China Ready to Drink Shakes Market, 2023 - 2030, Million Units (200 ml - pack of 6)
- TABLE 300China Ready to Drink Shakes Market by Type, 2019 - 2022, USD Million
- TABLE 301China Ready to Drink Shakes Market by Type, 2023 - 2030, USD Million
- TABLE 302China Ready to Drink Shakes Market by Type, 2019 - 2022, Million Units (200 ml - pack of 6)
- TABLE 303China Ready to Drink Shakes Market by Type, 2023 - 2030, Million Units (200 ml - pack of 6)
- TABLE 304China Ready to Drink Shakes Market by Distribution Channel, 2019 - 2022, USD Million
- TABLE 305China Ready to Drink Shakes Market by Distribution Channel, 2023 - 2030, USD Million
- TABLE 306China Ready to Drink Shakes Market by Distribution Channel, 2019 - 2022, Million Units (200 ml - pack of 6)
- TABLE 307China Ready to Drink Shakes Market by Distribution Channel, 2023 - 2030, Million Units (200 ml - pack of 6)
- TABLE 308Japan Ready to Drink Shakes Market, 2019 - 2022, USD Million
- TABLE 309Japan Ready to Drink Shakes Market, 2023 - 2030, USD Million
- TABLE 310Japan Ready to Drink Shakes Market, 2019 - 2022, Million Units (200 ml - pack of 6)
- TABLE 311Japan Ready to Drink Shakes Market, 2023 - 2030, Million Units (200 ml - pack of 6)
- TABLE 312Japan Ready to Drink Shakes Market by Type, 2019 - 2022, USD Million
- TABLE 313Japan Ready to Drink Shakes Market by Type, 2023 - 2030, USD Million
- TABLE 314Japan Ready to Drink Shakes Market by Type, 2019 - 2022, Million Units (200 ml - pack of 6)
- TABLE 315Japan Ready to Drink Shakes Market by Type, 2023 - 2030, Million Units (200 ml - pack of 6)
- TABLE 316Japan Ready to Drink Shakes Market by Distribution Channel, 2019 - 2022, USD Million
- TABLE 317Japan Ready to Drink Shakes Market by Distribution Channel, 2023 - 2030, USD Million
- TABLE 318Japan Ready to Drink Shakes Market by Distribution Channel, 2019 - 2022, Million Units (200 ml - pack of 6)
- TABLE 319Japan Ready to Drink Shakes Market by Distribution Channel, 2023 - 2030, Million Units (200 ml - pack of 6)
- TABLE 320India Ready to Drink Shakes Market, 2019 - 2022, USD Million
- TABLE 321India Ready to Drink Shakes Market, 2023 - 2030, USD Million
- TABLE 322India Ready to Drink Shakes Market, 2019 - 2022, Million Units (200 ml - pack of 6)
- TABLE 323India Ready to Drink Shakes Market, 2023 - 2030, Million Units (200 ml - pack of 6)
- TABLE 324India Ready to Drink Shakes Market by Type, 2019 - 2022, USD Million
- TABLE 325India Ready to Drink Shakes Market by Type, 2023 - 2030, USD Million
- TABLE 326India Ready to Drink Shakes Market by Type, 2019 - 2022, Million Units (200 ml - pack of 6)
- TABLE 327India Ready to Drink Shakes Market by Type, 2023 - 2030, Million Units (200 ml - pack of 6)
- TABLE 328India Ready to Drink Shakes Market by Distribution Channel, 2019 - 2022, USD Million
- TABLE 329India Ready to Drink Shakes Market by Distribution Channel, 2023 - 2030, USD Million
- TABLE 330India Ready to Drink Shakes Market by Distribution Channel, 2019 - 2022, Million Units (200 ml - pack of 6)
- TABLE 331India Ready to Drink Shakes Market by Distribution Channel, 2023 - 2030, Million Units (200 ml - pack of 6)
- TABLE 332South Korea Ready to Drink Shakes Market, 2019 - 2022, USD Million
- TABLE 333South Korea Ready to Drink Shakes Market, 2023 - 2030, USD Million
- TABLE 334South Korea Ready to Drink Shakes Market, 2019 - 2022, Million Units (200 ml - pack of 6)
- TABLE 335South Korea Ready to Drink Shakes Market, 2023 - 2030, Million Units (200 ml - pack of 6)
- TABLE 336South Korea Ready to Drink Shakes Market by Type, 2019 - 2022, USD Million
- TABLE 337South Korea Ready to Drink Shakes Market by Type, 2023 - 2030, USD Million
- TABLE 338South Korea Ready to Drink Shakes Market by Type, 2019 - 2022, Million Units (200 ml - pack of 6)
- TABLE 339South Korea Ready to Drink Shakes Market by Type, 2023 - 2030, Million Units (200 ml - pack of 6)
- TABLE 340South Korea Ready to Drink Shakes Market by Distribution Channel, 2019 - 2022, USD Million
- TABLE 341South Korea Ready to Drink Shakes Market by Distribution Channel, 2023 - 2030, USD Million
- TABLE 342South Korea Ready to Drink Shakes Market by Distribution Channel, 2019 - 2022, Million Units (200 ml - pack of 6)
- TABLE 343South Korea Ready to Drink Shakes Market by Distribution Channel, 2023 - 2030, Million Units (200 ml - pack of 6)
- TABLE 344Australia Ready to Drink Shakes Market, 2019 - 2022, USD Million
- TABLE 345Australia Ready to Drink Shakes Market, 2023 - 2030, USD Million
- TABLE 346Australia Ready to Drink Shakes Market, 2019 - 2022, Million Units (200 ml - pack of 6)
- TABLE 347Australia Ready to Drink Shakes Market, 2023 - 2030, Million Units (200 ml - pack of 6)
- TABLE 348Australia Ready to Drink Shakes Market by Type, 2019 - 2022, USD Million
- TABLE 349Australia Ready to Drink Shakes Market by Type, 2023 - 2030, USD Million
- TABLE 350Australia Ready to Drink Shakes Market by Type, 2019 - 2022, Million Units (200 ml - pack of 6)
- TABLE 351Australia Ready to Drink Shakes Market by Type, 2023 - 2030, Million Units (200 ml - pack of 6)
- TABLE 352Australia Ready to Drink Shakes Market by Distribution Channel, 2019 - 2022, USD Million
- TABLE 353Australia Ready to Drink Shakes Market by Distribution Channel, 2023 - 2030, USD Million
- TABLE 354Australia Ready to Drink Shakes Market by Distribution Channel, 2019 - 2022, Million Units (200 ml - pack of 6)
- TABLE 355Australia Ready to Drink Shakes Market by Distribution Channel, 2023 - 2030, Million Units (200 ml - pack of 6)
- TABLE 356Malaysia Ready to Drink Shakes Market, 2019 - 2022, USD Million
- TABLE 357Malaysia Ready to Drink Shakes Market, 2023 - 2030, USD Million
- TABLE 358Malaysia Ready to Drink Shakes Market, 2019 - 2022, Million Units (200 ml - pack of 6)
- TABLE 359Malaysia Ready to Drink Shakes Market, 2023 - 2030, Million Units (200 ml - pack of 6)
- TABLE 360Malaysia Ready to Drink Shakes Market by Type, 2019 - 2022, USD Million
- TABLE 361Malaysia Ready to Drink Shakes Market by Type, 2023 - 2030, USD Million
- TABLE 362Malaysia Ready to Drink Shakes Market by Type, 2019 - 2022, Million Units (200 ml - pack of 6)
- TABLE 363Malaysia Ready to Drink Shakes Market by Type, 2023 - 2030, Million Units (200 ml - pack of 6)
- TABLE 364Malaysia Ready to Drink Shakes Market by Distribution Channel, 2019 - 2022, USD Million
- TABLE 365Malaysia Ready to Drink Shakes Market by Distribution Channel, 2023 - 2030, USD Million
- TABLE 366Malaysia Ready to Drink Shakes Market by Distribution Channel, 2019 - 2022, Million Units (200 ml - pack of 6)
- TABLE 367Malaysia Ready to Drink Shakes Market by Distribution Channel, 2023 - 2030, Million Units (200 ml - pack of 6)
- TABLE 368Rest of Asia Pacific Ready to Drink Shakes Market, 2019 - 2022, USD Million
- TABLE 369Rest of Asia Pacific Ready to Drink Shakes Market, 2023 - 2030, USD Million
- TABLE 370Rest of Asia Pacific Ready to Drink Shakes Market, 2019 - 2022, Million Units (200 ml - pack of 6)
- TABLE 371Rest of Asia Pacific Ready to Drink Shakes Market, 2023 - 2030, Million Units (200 ml - pack of 6)
- TABLE 372Rest of Asia Pacific Ready to Drink Shakes Market by Type, 2019 - 2022, USD Million
- TABLE 373Rest of Asia Pacific Ready to Drink Shakes Market by Type, 2023 - 2030, USD Million
- TABLE 374Rest of Asia Pacific Ready to Drink Shakes Market by Type, 2019 - 2022, Million Units (200 ml - pack of 6)
- TABLE 375Rest of Asia Pacific Ready to Drink Shakes Market by Type, 2023 - 2030, Million Units (200 ml - pack of 6)
- TABLE 376Rest of Asia Pacific Ready to Drink Shakes Market by Distribution Channel, 2019 - 2022, USD Million
- TABLE 377Rest of Asia Pacific Ready to Drink Shakes Market by Distribution Channel, 2023 - 2030, USD Million
- TABLE 378Rest of Asia Pacific Ready to Drink Shakes Market by Distribution Channel, 2019 - 2022, Million Units (200 ml - pack of 6)
- TABLE 379Rest of Asia Pacific Ready to Drink Shakes Market by Distribution Channel, 2023 - 2030, Million Units (200 ml - pack of 6)
- TABLE 380LAMEA Ready to Drink Shakes Market, 2019 - 2022, USD Million
- TABLE 381LAMEA Ready to Drink Shakes Market, 2023 - 2030, USD Million
- TABLE 382LAMEA Ready to Drink Shakes Market, 2019 - 2022, Million Units (200 ml - pack of 6)
- TABLE 383LAMEA Ready to Drink Shakes Market, 2023 - 2030, Million Units (200 ml - pack of 6)
- TABLE 384LAMEA Ready to Drink Shakes Market by Type, 2019 - 2022, USD Million
- TABLE 385LAMEA Ready to Drink Shakes Market by Type, 2023 - 2030, USD Million
- TABLE 386LAMEA Ready to Drink Shakes Market by Type, 2019 - 2022, Million Units (200 ml - pack of 6)
- TABLE 387LAMEA Ready to Drink Shakes Market by Type, 2023 - 2030, Million Units (200 ml - pack of 6)
- TABLE 388LAMEA Bottles Market by Country, 2019 - 2022, USD Million
- TABLE 389LAMEA Bottles Market by Country, 2023 - 2030, USD Million
- TABLE 390LAMEA Bottles (200 ml - pack of 6) Market by Country, 2019 - 2022, Million Units (200 ml - pack of 6)
- TABLE 391LAMEA Bottles (200 ml - pack of 6) Market by Country, 2023 - 2030, Million Units (200 ml - pack of 6)
- TABLE 392LAMEA Cans Market by Country, 2019 - 2022, USD Million
- TABLE 393LAMEA Cans Market by Country, 2023 - 2030, USD Million
- TABLE 394LAMEA Cans (200 ml - pack of 6) Market by Country, 2019 - 2022, Million Units (200 ml - pack of 6)
- TABLE 395LAMEA Cans (200 ml - pack of 6) Market by Country, 2023 - 2030, Million Units (200 ml - pack of 6)
- TABLE 396LAMEA Tetra Packs Market by Country, 2019 - 2022, USD Million
- TABLE 397LAMEA Tetra Packs Market by Country, 2023 - 2030, USD Million
- TABLE 398LAMEA Tetra Packs (200 ml - pack of 6) Market by Country, 2019 - 2022, Million Units (200 ml - pack of 6)
- TABLE 399LAMEA Tetra Packs (200 ml - pack of 6) Market by Country, 2023 - 2030, Million Units (200 ml - pack of 6)
- TABLE 400LAMEA Ready to Drink Shakes Market by Distribution Channel, 2019 - 2022, USD Million
- TABLE 401LAMEA Ready to Drink Shakes Market by Distribution Channel, 2023 - 2030, USD Million
- TABLE 402LAMEA Ready to Drink Shakes Market by Distribution Channel, 2019 - 2022, Million Units (200 ml - pack of 6)
- TABLE 403LAMEA Ready to Drink Shakes Market by Distribution Channel, 2023 - 2030, Million Units (200 ml - pack of 6)
- TABLE 404LAMEA Supermarkets & Hypermarkets Market by Country, 2019 - 2022, USD Million
- TABLE 405LAMEA Supermarkets & Hypermarkets Market by Country, 2023 - 2030, USD Million
- TABLE 406LAMEA Supermarkets & Hypermarkets Market by Country, 2019 - 2022, Million Units (200 ml - pack of 6)
- TABLE 407LAMEA Supermarkets & Hypermarkets Market by Country, 2023 - 2030, Million Units (200 ml - pack of 6)
- TABLE 408LAMEA Convenience Stores Market by Country, 2019 - 2022, USD Million
- TABLE 409LAMEA Convenience Stores Market by Country, 2023 - 2030, USD Million
- TABLE 410LAMEA Convenience Stores Market by Country, 2019 - 2022, Million Units (200 ml - pack of 6)
- TABLE 411LAMEA Convenience Stores Market by Country, 2023 - 2030, Million Units (200 ml - pack of 6)
- TABLE 412LAMEA Online Market by Country, 2019 - 2022, USD Million
- TABLE 413LAMEA Online Market by Country, 2023 - 2030, USD Million
- TABLE 414LAMEA Online Market by Country, 2019 - 2022, Million Units (200 ml - pack of 6)
- TABLE 415LAMEA Online Market by Country, 2023 - 2030, Million Units (200 ml - pack of 6)
- TABLE 416LAMEA Ready to Drink Shakes Market by Country, 2019 - 2022, USD Million
- TABLE 417LAMEA Ready to Drink Shakes Market by Country, 2023 - 2030, USD Million
- TABLE 418LAMEA Ready to Drink Shakes Market by Country, 2019 - 2022, Million Units (200 ml - pack of 6)
- TABLE 419LAMEA Ready to Drink Shakes Market by Country, 2023 - 2030, Million Units (200 ml - pack of 6)
- TABLE 420Brazil Ready to Drink Shakes Market, 2019 - 2022, USD Million
- TABLE 421Brazil Ready to Drink Shakes Market, 2023 - 2030, USD Million
- TABLE 422Brazil Ready to Drink Shakes Market, 2019 - 2022, Million Units (200 ml - pack of 6)
- TABLE 423Brazil Ready to Drink Shakes Market, 2023 - 2030, Million Units (200 ml - pack of 6)
- TABLE 424Brazil Ready to Drink Shakes Market by Type, 2019 - 2022, USD Million
- TABLE 425Brazil Ready to Drink Shakes Market by Type, 2023 - 2030, USD Million
- TABLE 426Brazil Ready to Drink Shakes Market by Type, 2019 - 2022, Million Units (200 ml - pack of 6)
- TABLE 427Brazil Ready to Drink Shakes Market by Type, 2023 - 2030, Million Units (200 ml - pack of 6)
- TABLE 428Brazil Ready to Drink Shakes Market by Distribution Channel, 2019 - 2022, USD Million
- TABLE 429Brazil Ready to Drink Shakes Market by Distribution Channel, 2023 - 2030, USD Million
- TABLE 430Brazil Ready to Drink Shakes Market by Distribution Channel, 2019 - 2022, Million Units (200 ml - pack of 6)
- TABLE 431Brazil Ready to Drink Shakes Market by Distribution Channel, 2023 - 2030, Million Units (200 ml - pack of 6)
- TABLE 432Argentina Ready to Drink Shakes Market, 2019 - 2022, USD Million
- TABLE 433Argentina Ready to Drink Shakes Market, 2023 - 2030, USD Million
- TABLE 434Argentina Ready to Drink Shakes Market, 2019 - 2022, Million Units (200 ml - pack of 6)
- TABLE 435Argentina Ready to Drink Shakes Market, 2023 - 2030, Million Units (200 ml - pack of 6)
- TABLE 436Argentina Ready to Drink Shakes Market by Type, 2019 - 2022, USD Million
- TABLE 437Argentina Ready to Drink Shakes Market by Type, 2023 - 2030, USD Million
- TABLE 438Argentina Ready to Drink Shakes Market by Type, 2019 - 2022, Million Units (200 ml - pack of 6)
- TABLE 439Argentina Ready to Drink Shakes Market by Type, 2023 - 2030, Million Units (200 ml - pack of 6)
- TABLE 440Argentina Ready to Drink Shakes Market by Distribution Channel, 2019 - 2022, USD Million
- TABLE 441Argentina Ready to Drink Shakes Market by Distribution Channel, 2023 - 2030, USD Million
- TABLE 442Argentina Ready to Drink Shakes Market by Distribution Channel, 2019 - 2022, Million Units (200 ml - pack of 6)
- TABLE 443Argentina Ready to Drink Shakes Market by Distribution Channel, 2023 - 2030, Million Units (200 ml - pack of 6)
- TABLE 444UAE Ready to Drink Shakes Market, 2019 - 2022, USD Million
- TABLE 445UAE Ready to Drink Shakes Market, 2023 - 2030, USD Million
- TABLE 446UAE Ready to Drink Shakes Market, 2019 - 2022, Million Units (200 ml - pack of 6)
- TABLE 447UAE Ready to Drink Shakes Market, 2023 - 2030, Million Units (200 ml - pack of 6)
- TABLE 448UAE Ready to Drink Shakes Market by Type, 2019 - 2022, USD Million
- TABLE 449UAE Ready to Drink Shakes Market by Type, 2023 - 2030, USD Million
- TABLE 450UAE Ready to Drink Shakes Market by Type, 2019 - 2022, Million Units (200 ml - pack of 6)
- TABLE 451UAE Ready to Drink Shakes Market by Type, 2023 - 2030, Million Units (200 ml - pack of 6)
- TABLE 452UAE Ready to Drink Shakes Market by Distribution Channel, 2019 - 2022, USD Million
- TABLE 453UAE Ready to Drink Shakes Market by Distribution Channel, 2023 - 2030, USD Million
- TABLE 454UAE Ready to Drink Shakes Market by Distribution Channel, 2019 - 2022, Million Units (200 ml - pack of 6)
- TABLE 455UAE Ready to Drink Shakes Market by Distribution Channel, 2023 - 2030, Million Units (200 ml - pack of 6)
- TABLE 456Saudi Arabia Ready to Drink Shakes Market, 2019 - 2022, USD Million
- TABLE 457Saudi Arabia Ready to Drink Shakes Market, 2023 - 2030, USD Million
- TABLE 458Saudi Arabia Ready to Drink Shakes Market, 2019 - 2022, Million Units (200 ml - pack of 6)
- TABLE 459Saudi Arabia Ready to Drink Shakes Market, 2023 - 2030, Million Units (200 ml - pack of 6)
- TABLE 460Saudi Arabia Ready to Drink Shakes Market by Type, 2019 - 2022, USD Million
- TABLE 461Saudi Arabia Ready to Drink Shakes Market by Type, 2023 - 2030, USD Million
- TABLE 462Saudi Arabia Ready to Drink Shakes Market by Type, 2019 - 2022, Million Units (200 ml - pack of 6)
- TABLE 463Saudi Arabia Ready to Drink Shakes Market by Type, 2023 - 2030, Million Units (200 ml - pack of 6)
- TABLE 464Saudi Arabia Ready to Drink Shakes Market by Distribution Channel, 2019 - 2022, USD Million
- TABLE 465Saudi Arabia Ready to Drink Shakes Market by Distribution Channel, 2023 - 2030, USD Million
- TABLE 466Saudi Arabia Ready to Drink Shakes Market by Distribution Channel, 2019 - 2022, Million Units (200 ml - pack of 6)
- TABLE 467Saudi Arabia Ready to Drink Shakes Market by Distribution Channel, 2023 - 2030, Million Units (200 ml - pack of 6)
- TABLE 468South Africa Ready to Drink Shakes Market, 2019 - 2022, USD Million
- TABLE 469South Africa Ready to Drink Shakes Market, 2023 - 2030, USD Million
- TABLE 470South Africa Ready to Drink Shakes Market, 2019 - 2022, Million Units (200 ml - pack of 6)
- TABLE 471South Africa Ready to Drink Shakes Market, 2023 - 2030, Million Units (200 ml - pack of 6)
- TABLE 472South Africa Ready to Drink Shakes Market by Type, 2019 - 2022, USD Million
- TABLE 473South Africa Ready to Drink Shakes Market by Type, 2023 - 2030, USD Million
- TABLE 474South Africa Ready to Drink Shakes Market by Type, 2019 - 2022, Million Units (200 ml - pack of 6)
- TABLE 475South Africa Ready to Drink Shakes Market by Type, 2023 - 2030, Million Units (200 ml - pack of 6)
- TABLE 476South Africa Ready to Drink Shakes Market by Distribution Channel, 2019 - 2022, USD Million
- TABLE 477South Africa Ready to Drink Shakes Market by Distribution Channel, 2023 - 2030, USD Million
- TABLE 478South Africa Ready to Drink Shakes Market by Distribution Channel, 2019 - 2022, Million Units (200 ml - pack of 6)
- TABLE 479South Africa Ready to Drink Shakes Market by Distribution Channel, 2023 - 2030, Million Units (200 ml - pack of 6)
- TABLE 480Nigeria Ready to Drink Shakes Market, 2019 - 2022, USD Million
- TABLE 481Nigeria Ready to Drink Shakes Market, 2023 - 2030, USD Million
- TABLE 482Nigeria Ready to Drink Shakes Market, 2019 - 2022, Million Units (200 ml - pack of 6)
- TABLE 483Nigeria Ready to Drink Shakes Market, 2023 - 2030, Million Units (200 ml - pack of 6)
- TABLE 484Nigeria Ready to Drink Shakes Market by Type, 2019 - 2022, USD Million
- TABLE 485Nigeria Ready to Drink Shakes Market by Type, 2023 - 2030, USD Million
- TABLE 486Nigeria Ready to Drink Shakes Market by Type, 2019 - 2022, Million Units (200 ml - pack of 6)
- TABLE 487Nigeria Ready to Drink Shakes Market by Type, 2023 - 2030, Million Units (200 ml - pack of 6)
- TABLE 488Nigeria Ready to Drink Shakes Market by Distribution Channel, 2019 - 2022, USD Million
- TABLE 489Nigeria Ready to Drink Shakes Market by Distribution Channel, 2023 - 2030, USD Million
- TABLE 490Nigeria Ready to Drink Shakes Market by Distribution Channel, 2019 - 2022, Million Units (200 ml - pack of 6)
- TABLE 491Nigeria Ready to Drink Shakes Market by Distribution Channel, 2023 - 2030, Million Units (200 ml - pack of 6)
- TABLE 492Rest of LAMEA Ready to Drink Shakes Market, 2019 - 2022, USD Million
- TABLE 493Rest of LAMEA Ready to Drink Shakes Market, 2023 - 2030, USD Million
- TABLE 494Rest of LAMEA Ready to Drink Shakes Market, 2019 - 2022, Million Units (200 ml - pack of 6)
- TABLE 495Rest of LAMEA Ready to Drink Shakes Market, 2023 - 2030, Million Units (200 ml - pack of 6)
- TABLE 496Rest of LAMEA Ready to Drink Shakes Market by Type, 2019 - 2022, USD Million
- TABLE 497Rest of LAMEA Ready to Drink Shakes Market by Type, 2023 - 2030, USD Million
- TABLE 498Rest of LAMEA Ready to Drink Shakes Market by Type, 2019 - 2022, Million Units (200 ml - pack of 6)
- TABLE 499Rest of LAMEA Ready to Drink Shakes Market by Type, 2023 - 2030, Million Units (200 ml - pack of 6)
- TABLE 500Rest of LAMEA Ready to Drink Shakes Market by Distribution Channel, 2019 - 2022, USD Million
- TABLE 501Rest of LAMEA Ready to Drink Shakes Market by Distribution Channel, 2023 - 2030, USD Million
- TABLE 502Rest of LAMEA Ready to Drink Shakes Market by Distribution Channel, 2019 - 2022, Million Units (200 ml - pack of 6)
- TABLE 503Rest of LAMEA Ready to Drink Shakes Market by Distribution Channel, 2023 - 2030, Million Units (200 ml - pack of 6)
- TABLE 504Key Information - Abbott Laboratories
- TABLE 505Key information - Kellogg Company
- TABLE 506Key Information - The Coca Cola Company
- TABLE 507Key Information - PepsiCo, Inc.
- TABLE 508Key Information - Nestle S.A
- TABLE 509Key Information - Hormel Foods Corporation
- TABLE 510Key information - Danone S.A.
- TABLE 511Key Information - Campbell Soup Company
- TABLE 512Key Information - KeHE Distributors, LLC
- TABLE 513Key Information - Huel Limited
The Global Ready to Drink Shakes Market size is expected to reach $15.9 billion by 2030, rising at a market growth of 6.1% CAGR during the forecast period. In the year 2022, the market attained a volume of 1,496.6 million units (200 ml -pack of 6, experiencing a growth of 6.7% (2019-2022).
The compact and portable nature of RTD shakes makes them easily accessible in various settings. Whether stored in a gym bag, desk drawer, or refrigerator, these beverages are designed to be carried and consumed at any time, fitting seamlessly into the lifestyles of busy individuals. Consequently, the bottles segment would generate a 50 % share of the market by 2030. Also, Russia would utilize 55.57 million units (200 ML - PACK OF 6) of bottles by 2030.For those who prioritize efficiency, the simplicity of opening a bottle and consuming a complete, balanced drink is a compelling factor. Thus, these aspects will boost the demand in the segment.
The major strategies followed by the market participants are product launch as the key developmental strategy to keep pace with the changing demands of end users. For instance, In January 2024, Abbott Laboratories has introduced a new brand named PROTALITY, featuring a high-protein nutrition shake designed to cater to individuals seeking weight loss while prioritizing muscle maintenance and nutritional balance. In June 2023, PepsiCo, Inc. introduced an enhanced version of Pepsi Zero Sugar. The updated recipe of Pepsi Zero Sugar incorporates a new sweetener system, resulting in a more invigorating and intensified flavor profile compared to the previous iteration of Pepsi Zero Sugar.
Based on the Analysis presented in the KBV Cardinal matrix; The Coca Cola Company, PepsiCo, Inc., Nestle S.A and Abbott Laboratories are the forerunners in the Ready to Drink Shakes Market. In November, 2023, Honest Tea, Inc., a subsidiary of The Coca-Cola Company, introduced a fresh ready-to-drink beverage category under the name Honest Tea. This new line features iced green tea available in lemon-Tulsi and mango varieties. The primary objective of this launch is to offer consumers a broader selection of beverage choices. And Companies such as Danone, S.A., Hormel Foods Corporation, and Kellogg Company are some of the key innovators in Market.
Market Growth Factors
Consumers are increasingly looking for products that go beyond basic nutrition and provide a well-rounded profile of essential nutrients. RTD shakes have responded by formulating beverages that include proteins, fibers, vitamins, and minerals, offering a convenient way for individuals to meet their nutritional needs. Hence, these aspects will lead to increased demand for market.
RTD shakes designed for older consumers often feature nutrient-dense formulations. These beverages are enriched with essential vitamins and minerals to meet the changing nutritional requirements associated with aging. Thus, these aspects can help in the growth of the market.
Market Restraining Factors
The processing involved in achieving shelf stability often includes additives and preservatives. Some consumers express concerns about the presence of these ingredients in their food and beverages, associating them with potential health risks. Thus, these aspects can restrain the growth of the market.
By Type Analysis
Based on type, the market is segmented into bottles, cans, and tetra packs. In 2022, the cans segment garnered a 33.2 % revenue share in the market. In terms of volume, cans segment would register 471.9 million units (200 ml - pack of 6) in 2022. Canned RTD shakes offer convenience and portability, making them an attractive option for busy-conscious consumers. The sealed and airtight nature of cans helps preserve the freshness and quality of the beverage for a longer duration, reducing the risk of spoilage and waste. Hence, these factors will assist in the growth of the segment.
By Distribution Channel Analysis
On the basis of distribution channel, the market is divided into supermarkets & hypermarkets, convenience stores, and online. The supermarkets and hypermarkets segment recorded the 45.58 % revenue share in the market in 2022. The shelf space available in supermarkets and hypermarkets allows for a diverse selection of RTD shakes from various brands. Consumers can choose from different flavors, formulations, and brands, providing ample options to cater to their tastes and preferences. Supermarkets and hypermarkets often use strategic promotional displays and merchandising techniques to highlight RTD shakes. Therefore, these aspects will lead to enhanced growth in the segment.
By Regional Analysis
By region, the market is segmented into North America, Europe, Asia Pacific, and LAMEA. In 2022, the Europe segment acquired a 29.88 % revenue share in the market. Europe has been witnessing a growing emphasis on health and wellness, with consumers seeking convenient yet nutritious options. RTD shakes, positioned as on-the-go health solutions, are likely to benefit from this trend. The busy lifestyles of European consumers, especially in urban areas, contribute to the demand for convenient food and beverage options. RTD shakes align with the need for quick and accessible nutrition. Hence, these aspects will lead to increased demand in the segment.
Market Competition and Attributes
The ready-to-drink (RTD) shakes market is characterized by intense competition among established brands like Ensure, Premier Protein, Muscle Milk, and Orgain, as well as newer entrants vying for market share by offering innovative formulations, flavors, and packaging to cater to the growing demand for convenient and nutritious beverages driven by health-conscious consumers with busy lifestyles. Key players in the market are Nestle S.A, The Coca Cola Company and PepsiCo, Inc. and compete on factors such as taste, nutritional content, brand reputation, distribution channels, and marketing strategies, while also focusing on specific consumer segments such as athletes, fitness enthusiasts, or those seeking meal replacement options. Product innovation and differentiation, along with strategic partnerships with retailers and gyms, are crucial for companies to stand out in this crowded and dynamic market.
Recent Strategies Deployed in the Market
- Jan-2024: Abbott Laboratories has introduced a new brand named PROTALITY, featuring a high-protein nutrition shake designed to cater to individuals seeking weight loss while prioritizing muscle maintenance and nutritional balance. This shake, the flagship product of the PROTALITY line, addresses the needs of adults aiming for weight management with its carefully selected key nutrients. Each PROTALITY shake contains 30 grams of premium protein to aid in muscle preservation, 8 essential B vitamins crucial for protein and energy metabolism, 4 grams of comforting fiber for digestive well-being, just 1 gram of sugar, along with 150 calories, and a blend of 25 essential vitamins and minerals.
- Nov-2023: Honest Tea, Inc., a subsidiary of The Coca-Cola Company, has introduced a fresh ready-to-drink beverage category under the name Honest Tea. This new line features iced green tea available in lemon-tulsi and mango varieties. The primary objective of this launch is to offer consumers a broader selection of beverage choices.
- Sep-2023: Kellogg Company has partnered with Nestle S.A, a renowned Swiss multinational food and beverage corporation. Through this partnership, Kellogg intends to introduce two breakfast-inspired beverages under the Frosted Flakes and Eggo brands. The "Nestle Sensations Frosted Flakes" cereal-flavored milk offers the flavor of frosted cornflakes, coupled with a lusciously creamy dairy finish. Meanwhile, the "Nestle Sensations Eggo" maple waffle-flavored milk is infused with hints of toasty waffles, butter, and maple syrup.
- Jun-2023: PepsiCo, Inc. has introduced an enhanced version of Pepsi Zero Sugar. The updated recipe of Pepsi Zero Sugar incorporates a new sweetener system, resulting in a more invigorating and intensified flavor profile compared to the previous iteration of Pepsi Zero Sugar.
- Jan-2022: Coca-Cola HBC AG, a division of The Coca-Cola Company, has completed the acquisition of Coca-Cola Bottling Company of Egypt S.A.E. This strategic move provides Coca-Cola HBC with entry into the second-largest non-alcoholic ready-to-drink ("NARTD") market in Africa in terms of volume. By expanding its presence in Africa, Coca-Cola HBC aims to further leverage its existing scale in the region and enhance its exposure to high-growth markets.
List of Key Companies Profiled
- Abbott Laboratories
- Kellogg Company
- The Coca Cola Company
- PepsiCo, Inc.
- Nestle S.A.
- Hormel Foods Corporation (MegaMex Foods, LLC)
- Danone S.A.
- Campbell Soup Company
- KeHE Distributors, LLC
- Huel GmbH
Global Ready to Drink Shakes Market Report Segmentation
By Type (Volume, Million Units (200ml-pack of 6), USD Billion, 2019-2030)
- Bottles
- Cans
- Tetra Packs
By Distribution Channel (Volume, Million Units (200ml-pack of 6), USD Billion, 2019-2030)
- Supermarkets & Hypermarkets
- Convenience Stores
- Online
By Geography (Volume, Million Units (200ml-pack of 6), USD Billion, 2019-2030)
- North America
- US
- Canada
- Mexico
- Rest of North America
- Europe
- Germany
- UK
- France
- Russia
- Spain
- Italy
- Rest of Europe
- Asia Pacific
- China
- Japan
- India
- South Korea
- Singapore
- Malaysia
- Rest of Asia Pacific
- LAMEA
- Brazil
- Argentina
- UAE
- Saudi Arabia
- South Africa
- Nigeria
- Rest of LAMEA
Table of Contents
Chapter 1.Market Scope & Methodology
- 1.1Market Definition
- 1.2Objectives
- 1.3Market Scope
- 1.4Segmentation
- 1.4.1Global Ready to Drink Shakes Market, by Type
- 1.4.2Global Ready to Drink Shakes Market, by Distribution Channel
- 1.4.3Global Ready to Drink Shakes Market, by Geography
- 1.5Methodology for the research
Chapter 2.Market at a Glance
- 2.1Key Highlights
Chapter 3.Market Overview
- 3.1Introduction
- 3.1.1Overview
- 3.1.1.1Market Composition and Scenario
- 3.1.1Overview
- 3.2Key Factors Impacting the Market
- 3.2.1Market Drivers
- 3.2.2Market Restraints
- 3.2.3Market Opportunities
- 3.2.4Market Challenges
Chapter 4.Competition Analysis - Global
- 4.1KBV Cardinal Matrix
- 4.2Recent Industry Wide Strategic Developments
- 4.2.1Partnerships, Collaborations and Agreements
- 4.2.2Product Launches and Product Expansions
- 4.2.3Acquisition and Mergers
- 4.3Top Winning Strategies
- 4.3.1Key Leading Strategies: Percentage Distribution (2019-2023)
- 4.3.2Key Strategic Move: (Product Launches and Product Expansions : 2019, Jan - 2024, Jan) Leading Players
- 4.4Porter's Five Forces Analysis
Chapter 5.Global Ready to Drink Shakes Market by Type
- 5.1Global Bottles Market by Region
- 5.2Global Cans Market by Region
- 5.3Global Tetra Packs Market by Region
Chapter 6.Global Ready to Drink Shakes Market by Distribution Channel
- 6.1Global Supermarkets & Hypermarkets Market by Region
- 6.2Global Convenience Stores Market by Region
- 6.3Global Online Market by Region
Chapter 7.Global Ready to Drink Shakes Market by Region
- 7.1North America Ready to Drink Shakes Market
- 7.1.1North America Ready to Drink Shakes Market by Type
- 7.1.1.1North America Bottles Market by Country
- 7.1.1.2North America Cans Market by Country
- 7.1.1.3North America Tetra Packs Market by Country
- 7.1.2North America Ready to Drink Shakes Market by Distribution Channel
- 7.1.2.1North America Supermarkets & Hypermarkets Market by Country
- 7.1.2.2North America Convenience Stores Market by Country
- 7.1.2.3North America Online Market by Country
- 7.1.3North America Ready to Drink Shakes Market by Country
- 7.1.3.1US Ready to Drink Shakes Market
- 7.1.3.1.1US Ready to Drink Shakes Market by Type
- 7.1.3.1.2US Ready to Drink Shakes Market by Distribution Channel
- 7.1.3.2Canada Ready to Drink Shakes Market
- 7.1.3.2.1Canada Ready to Drink Shakes Market by Type
- 7.1.3.2.2Canada Ready to Drink Shakes Market by Distribution Channel
- 7.1.3.3Mexico Ready to Drink Shakes Market
- 7.1.3.3.1Mexico Ready to Drink Shakes Market by Type
- 7.1.3.3.2Mexico Ready to Drink Shakes Market by Distribution Channel
- 7.1.3.4Rest of North America Ready to Drink Shakes Market
- 7.1.3.4.1Rest of North America Ready to Drink Shakes Market by Type
- 7.1.3.4.2Rest of North America Ready to Drink Shakes Market by Distribution Channel
- 7.1.3.1US Ready to Drink Shakes Market
- 7.1.1North America Ready to Drink Shakes Market by Type
- 7.2Europe Ready to Drink Shakes Market
- 7.2.1Europe Ready to Drink Shakes Market by Type
- 7.2.1.1Europe Bottles Market by Country
- 7.2.1.2Europe Cans Market by Country
- 7.2.1.3Europe Tetra Packs Market by Country
- 7.2.2Europe Ready to Drink Shakes Market by Distribution Channel
- 7.2.2.1Europe Supermarkets & Hypermarkets Market by Country
- 7.2.2.2Europe Convenience Stores Market by Country
- 7.2.2.3Europe Online Market by Country
- 7.2.3Europe Ready to Drink Shakes Market by Country
- 7.2.3.1Germany Ready to Drink Shakes Market
- 7.2.3.1.1Germany Ready to Drink Shakes Market by Type
- 7.2.3.1.2Germany Ready to Drink Shakes Market by Distribution Channel
- 7.2.3.2UK Ready to Drink Shakes Market
- 7.2.3.2.1UK Ready to Drink Shakes Market by Type
- 7.2.3.2.2UK Ready to Drink Shakes Market by Distribution Channel
- 7.2.3.3France Ready to Drink Shakes Market
- 7.2.3.3.1France Ready to Drink Shakes Market by Type
- 7.2.3.3.2France Ready to Drink Shakes Market by Distribution Channel
- 7.2.3.4Russia Ready to Drink Shakes Market
- 7.2.3.4.1Russia Ready to Drink Shakes Market by Type
- 7.2.3.4.2Russia Ready to Drink Shakes Market by Distribution Channel
- 7.2.3.5Spain Ready to Drink Shakes Market
- 7.2.3.5.1Spain Ready to Drink Shakes Market by Type
- 7.2.3.5.2Spain Ready to Drink Shakes Market by Distribution Channel
- 7.2.3.6Italy Ready to Drink Shakes Market
- 7.2.3.6.1Italy Ready to Drink Shakes Market by Type
- 7.2.3.6.2Italy Ready to Drink Shakes Market by Distribution Channel
- 7.2.3.7Rest of Europe Ready to Drink Shakes Market
- 7.2.3.7.1Rest of Europe Ready to Drink Shakes Market by Type
- 7.2.3.7.2Rest of Europe Ready to Drink Shakes Market by Distribution Channel
- 7.2.3.1Germany Ready to Drink Shakes Market
- 7.2.1Europe Ready to Drink Shakes Market by Type
- 7.3Asia Pacific Ready to Drink Shakes Market
- 7.3.1Asia Pacific Ready to Drink Shakes Market by Type
- 7.3.1.1Asia Pacific Bottles Market by Country
- 7.3.1.2Asia Pacific Cans Market by Country
- 7.3.1.3Asia Pacific Tetra Packs Market by Country
- 7.3.2Asia Pacific Ready to Drink Shakes Market by Distribution Channel
- 7.3.2.1Asia Pacific Supermarkets & Hypermarkets Market by Country
- 7.3.2.2Asia Pacific Convenience Stores Market by Country
- 7.3.2.3Asia Pacific Online Market by Country
- 7.3.3Asia Pacific Ready to Drink Shakes Market by Country
- 7.3.3.1China Ready to Drink Shakes Market
- 7.3.3.1.1China Ready to Drink Shakes Market by Type
- 7.3.3.1.2China Ready to Drink Shakes Market by Distribution Channel
- 7.3.3.2Japan Ready to Drink Shakes Market
- 7.3.3.2.1Japan Ready to Drink Shakes Market by Type
- 7.3.3.2.2Japan Ready to Drink Shakes Market by Distribution Channel
- 7.3.3.3India Ready to Drink Shakes Market
- 7.3.3.3.1India Ready to Drink Shakes Market by Type
- 7.3.3.3.2India Ready to Drink Shakes Market by Distribution Channel
- 7.3.3.4South Korea Ready to Drink Shakes Market
- 7.3.3.4.1South Korea Ready to Drink Shakes Market by Type
- 7.3.3.4.2South Korea Ready to Drink Shakes Market by Distribution Channel
- 7.3.3.5Australia Ready to Drink Shakes Market
- 7.3.3.5.1Australia Ready to Drink Shakes Market by Type
- 7.3.3.5.2Australia Ready to Drink Shakes Market by Distribution Channel
- 7.3.3.6Malaysia Ready to Drink Shakes Market
- 7.3.3.6.1Malaysia Ready to Drink Shakes Market by Type
- 7.3.3.6.2Malaysia Ready to Drink Shakes Market by Distribution Channel
- 7.3.3.7Rest of Asia Pacific Ready to Drink Shakes Market
- 7.3.3.7.1Rest of Asia Pacific Ready to Drink Shakes Market by Type
- 7.3.3.7.2Rest of Asia Pacific Ready to Drink Shakes Market by Distribution Channel
- 7.3.3.1China Ready to Drink Shakes Market
- 7.3.1Asia Pacific Ready to Drink Shakes Market by Type
- 7.4LAMEA Ready to Drink Shakes Market
- 7.4.1LAMEA Ready to Drink Shakes Market by Type
- 7.4.1.1LAMEA Bottles Market by Country
- 7.4.1.2LAMEA Cans Market by Country
- 7.4.1.3LAMEA Tetra Packs Market by Country
- 7.4.2LAMEA Ready to Drink Shakes Market by Distribution Channel
- 7.4.2.1LAMEA Supermarkets & Hypermarkets Market by Country
- 7.4.2.2LAMEA Convenience Stores Market by Country
- 7.4.2.3LAMEA Online Market by Country
- 7.4.3LAMEA Ready to Drink Shakes Market by Country
- 7.4.3.1Brazil Ready to Drink Shakes Market
- 7.4.3.1.1Brazil Ready to Drink Shakes Market by Type
- 7.4.3.1.2Brazil Ready to Drink Shakes Market by Distribution Channel
- 7.4.3.2Argentina Ready to Drink Shakes Market
- 7.4.3.2.1Argentina Ready to Drink Shakes Market by Type
- 7.4.3.2.2Argentina Ready to Drink Shakes Market by Distribution Channel
- 7.4.3.3UAE Ready to Drink Shakes Market
- 7.4.3.3.1UAE Ready to Drink Shakes Market by Type
- 7.4.3.3.2UAE Ready to Drink Shakes Market by Distribution Channel
- 7.4.3.4Saudi Arabia Ready to Drink Shakes Market
- 7.4.3.4.1Saudi Arabia Ready to Drink Shakes Market by Type
- 7.4.3.4.2Saudi Arabia Ready to Drink Shakes Market by Distribution Channel
- 7.4.3.5South Africa Ready to Drink Shakes Market
- 7.4.3.5.1South Africa Ready to Drink Shakes Market by Type
- 7.4.3.5.2South Africa Ready to Drink Shakes Market by Distribution Channel
- 7.4.3.6Nigeria Ready to Drink Shakes Market
- 7.4.3.6.1Nigeria Ready to Drink Shakes Market by Type
- 7.4.3.6.2Nigeria Ready to Drink Shakes Market by Distribution Channel
- 7.4.3.7Rest of LAMEA Ready to Drink Shakes Market
- 7.4.3.7.1Rest of LAMEA Ready to Drink Shakes Market by Type
- 7.4.3.7.2Rest of LAMEA Ready to Drink Shakes Market by Distribution Channel
- 7.4.3.1Brazil Ready to Drink Shakes Market
- 7.4.1LAMEA Ready to Drink Shakes Market by Type
Chapter 8.Company Profiles
- 8.1Abbott Laboratories
- 8.1.1Company Overview
- 8.1.2Financial Analysis
- 8.1.3Segmental and Regional Analysis
- 8.1.4Research & Development Expense
- 8.1.5Recent strategies and developments:
- 8.1.5.1Product Launches and Product Expansions:
- 8.1.6SWOT Analysis
- 8.2Kellogg Company
- 8.2.1Company Overview
- 8.2.2Financial Analysis
- 8.2.3Segmental and Regional Analysis
- 8.2.4Research & Development Expense
- 8.2.5Recent strategies and developments:
- 8.2.5.1Partnerships, Collaborations, and Agreements:
- 8.2.6SWOT Analysis
- 8.3The Coca Cola Company
- 8.3.1Company Overview
- 8.3.2Financial Analysis
- 8.3.3Segmental and Regional Analysis
- 8.3.4Recent strategies and developments:
- 8.3.4.1Partnerships, Collaborations, and Agreements:
- 8.3.4.2Product Launches and Product Expansions:
- 8.3.4.3Acquisition and Mergers:
- 8.3.5SWOT Analysis
- 8.4PepsiCo, Inc.
- 8.4.1Company Overview
- 8.4.2Financial Analysis
- 8.4.3Segmental and Regional Analysis
- 8.4.4Research & Development Expense
- 8.4.5Recent strategies and developments:
- 8.4.5.1Product Launches and Product Expansions:
- 8.4.5.2Acquisition and Mergers:
- 8.4.6SWOT Analysis
- 8.5Nestle S.A
- 8.5.1Company Overview
- 8.5.2Financial Analysis
- 8.5.3Segmental and Regional Analysis
- 8.5.4Research & Development Expenses
- 8.5.5Recent strategies and developments:
- 8.5.5.1Partnerships, Collaborations, and Agreements:
- 8.5.6SWOT Analysis
- 8.6Hormel Foods Corporation (MegaMex Foods, LLC)
- 8.6.1Company Overview
- 8.6.2Financial Analysis
- 8.6.3Segmental and Regional Analysis
- 8.6.4Research & Development Expenses
- 8.6.5SWOT Analysis
- 8.7Danone S.A.
- 8.7.1Company Overview
- 8.7.2Financial Analysis
- 8.7.3Category and Regional Analysis
- 8.7.4Recent strategies and developments:
- 8.7.4.1Product Launches and Product Expansions:
- 8.7.5SWOT Analysis
- 8.8Campbell Soup Company
- 8.8.1Company Overview
- 8.8.2Financial Analysis
- 8.8.3Segmental Analysis
- 8.8.4Research & Development Expenses
- 8.8.5SWOT Analysis
- 8.9KeHE Distributors, LLC
- 8.9.1Company Overview
- 8.9.2SWOT Analysis
- 8.10.Huel Limited
- 8.10.1Company Overview
- 8.10.2Recent strategies and developments:
- 8.10.2.1Product Launches and Product Expansions:
- 8.10.3SWOT Analysis

