|
|
市場調査レポート
商品コード
1405270
ラテンアメリカ、中東・アフリカの食品トレーサビリティ市場規模、シェア、動向分析レポート:ソフトウェア別、最終用途別、タイプ別、国別、成長予測、2023年~2030年LAMEA Food Traceability Market Size, Share & Trends Analysis Report By Software, By End-use, By Type (Barcodes, Radio Frequency Identification, Global Positioning Systems, Infrared, Biometrics, and Others), By Country and Growth Forecast, 2023 - 2030 |
||||||
|
|||||||
|
|||||||

| ラテンアメリカ、中東・アフリカの食品トレーサビリティ市場規模、シェア、動向分析レポート:ソフトウェア別、最終用途別、タイプ別、国別、成長予測、2023年~2030年 |
|
出版日: 2024年01月05日
発行: KBV Research
ページ情報: 英文 134 Pages
納期: 即納可能
|

全表示
- 概要
- 図表
- 目次
ラテンアメリカ、中東・アフリカの食品トレーサビリティ市場は予測期間(2023~2030年)にCAGR10.6%の市場成長を遂げると思われます。
アラブ首長国連邦における食肉生産の増加により、食品の透明性と品質に対する消費者の期待が高まっています。消費者は、消費する食肉の安全基準、加工方法、原産地についてより多くの情報を得るようになり、これらの要素に対する意識が高まっています。農家から食卓に届くまでの製品の行程を透明性の高い記録として提供することで、こうした懸念に対応しています。したがって、LAMEA地域では魚、肉、魚介類セクターが拡大しており、この地域の食品トレーサビリティ需要を押し上げることになります。
ソフトウェア別に見ると、市場はサプライチェーン管理(SCM)、企業資源計画(ERP)、倉庫ソフトウェア、ラボ情報システム、その他に区分されます。用途別では、市場は魚、肉、シーフード、乳製品、加工食品、果物&野菜、ベーカリー&菓子、フルーツパルプ&濃縮物、その他に区分されます。タイプ別では、市場はバーコード、無線識別、全地球測位システム、赤外線、バイオメトリクス、その他に区分されます。国別では、市場はブラジル、アルゼンチン、アラブ首長国連邦、サウジアラビア、南アフリカ、ナイジェリア、その他に区分されます。
目次
第1章 市場範囲と調査手法
- 市場の定義
- 目的
- 市場範囲
- セグメンテーション
- 調査手法
第2章 市場要覧
- 主なハイライト
第3章 市場概要
- イントロダクション
- 概要
- 市場構成とシナリオ
- 概要
- 市場に影響を与える主な要因
- 市場促進要因
- 市場抑制要因
- ポーターのファイブフォース分析
第4章 ラテンアメリカ、中東・アフリカの食品トレーサビリティ市場:ソフトウェア別
- LAMEAの国別サプライチェーンマネジメント(SCM)市場
- LAMEAの国別エンタープライズリソースプランニング(ERP)市場
- LAMEAの国別ウェアハウスソフトウェア市場
- LAMEAの国別検査室情報システム市場
- LAMEAの国別その他市場
第5章 ラテンアメリカ、中東・アフリカの食品トレーサビリティ市場:最終用途別
- LAMEAの国別魚、肉、シーフード市場
- LAMEAの国別乳製品市場
- LAMEAの国別加工食品市場
- LAMEAの国別青果物市場
- LAMEAの国別ベーカリー&菓子市場
- LAMEAの国別果肉および濃縮物市場
- LAMEAの国別その他市場
第6章 ラテンアメリカ、中東・アフリカの食品トレーサビリティ市場:タイプ別
- LAMEAの国別バーコード市場
- LAMEAの国別無線周波数識別市場
- LAMEAの国別全地球測位システム市場
- LAMEAの国別赤外線市場
- LAMEAの国別バイオメトリクス市場
- LAMEAの国別その他市場
第7章 ラテンアメリカ、中東・アフリカの食品トレーサビリティ市場:国別
- ブラジル
- アルゼンチン
- UAE
- サウジアラビア
- 南アフリカ
- ナイジェリア
- その他
第8章 企業プロファイル
- Cognex Corporation
- Honeywell International, Inc
- SGS SA
- Zebra Technologies Corporation
- Carlisle Technology
- Bio-Rad laboratories, Inc
- CH. Robinson Worldwide, Inc.
- Optel Group
- Bar Code Integrators, Inc
- Food Forensics Ltd
LIST OF TABLES
- TABLE 1 LAMEA Food Traceability Market, 2019 - 2022, USD Million
- TABLE 2 LAMEA Food Traceability Market, 2023 - 2030, USD Million
- TABLE 3 LAMEA Food Traceability Market by Software, 2019 - 2022, USD Million
- TABLE 4 LAMEA Food Traceability Market by Software, 2023 - 2030, USD Million
- TABLE 5 LAMEA Supply Chain Management (SCM) Market by Country, 2019 - 2022, USD Million
- TABLE 6 LAMEA Supply Chain Management (SCM) Market by Country, 2023 - 2030, USD Million
- TABLE 7 LAMEA Enterprise Resources Planning (ERP) Market by Country, 2019 - 2022, USD Million
- TABLE 8 LAMEA Enterprise Resources Planning (ERP) Market by Country, 2023 - 2030, USD Million
- TABLE 9 LAMEA Warehouse Software Market by Country, 2019 - 2022, USD Million
- TABLE 10 LAMEA Warehouse Software Market by Country, 2023 - 2030, USD Million
- TABLE 11 LAMEA Laboratory Information Systems Market by Country, 2019 - 2022, USD Million
- TABLE 12 LAMEA Laboratory Information Systems Market by Country, 2023 - 2030, USD Million
- TABLE 13 LAMEA Others Market by Country, 2019 - 2022, USD Million
- TABLE 14 LAMEA Others Market by Country, 2023 - 2030, USD Million
- TABLE 15 LAMEA Food Traceability Market by End-use, 2019 - 2022, USD Million
- TABLE 16 LAMEA Food Traceability Market by End-use, 2023 - 2030, USD Million
- TABLE 17 LAMEA Fish, Meat, & Seafood Market by Country, 2019 - 2022, USD Million
- TABLE 18 LAMEA Fish, Meat, & Seafood Market by Country, 2023 - 2030, USD Million
- TABLE 19 LAMEA Dairy Products Market by Country, 2019 - 2022, USD Million
- TABLE 20 LAMEA Dairy Products Market by Country, 2023 - 2030, USD Million
- TABLE 21 LAMEA Processed Food Market by Country, 2019 - 2022, USD Million
- TABLE 22 LAMEA Processed Food Market by Country, 2023 - 2030, USD Million
- TABLE 23 LAMEA Fruits & Vegetables Market by Country, 2019 - 2022, USD Million
- TABLE 24 LAMEA Fruits & Vegetables Market by Country, 2023 - 2030, USD Million
- TABLE 25 LAMEA Bakery & Confectionary Market by Country, 2019 - 2022, USD Million
- TABLE 26 LAMEA Bakery & Confectionary Market by Country, 2023 - 2030, USD Million
- TABLE 27 LAMEA Fruit Pulp & Concentrates Market by Country, 2019 - 2022, USD Million
- TABLE 28 LAMEA Fruit Pulp & Concentrates Market by Country, 2023 - 2030, USD Million
- TABLE 29 LAMEA Others Market by Country, 2019 - 2022, USD Million
- TABLE 30 LAMEA Others Market by Country, 2023 - 2030, USD Million
- TABLE 31 LAMEA Food Traceability Market by Type, 2019 - 2022, USD Million
- TABLE 32 LAMEA Food Traceability Market by Type, 2023 - 2030, USD Million
- TABLE 33 LAMEA Barcodes Market by Country, 2019 - 2022, USD Million
- TABLE 34 LAMEA Barcodes Market by Country, 2023 - 2030, USD Million
- TABLE 35 LAMEA Radio Frequency Identification Market by Country, 2019 - 2022, USD Million
- TABLE 36 LAMEA Radio Frequency Identification Market by Country, 2023 - 2030, USD Million
- TABLE 37 LAMEA Global Positioning Systems Market by Country, 2019 - 2022, USD Million
- TABLE 38 LAMEA Global Positioning Systems Market by Country, 2023 - 2030, USD Million
- TABLE 39 LAMEA Infrared Market by Country, 2019 - 2022, USD Million
- TABLE 40 LAMEA Infrared Market by Country, 2023 - 2030, USD Million
- TABLE 41 LAMEA Biometrics Market by Country, 2019 - 2022, USD Million
- TABLE 42 LAMEA Biometrics Market by Country, 2023 - 2030, USD Million
- TABLE 43 LAMEA Others Market by Country, 2019 - 2022, USD Million
- TABLE 44 LAMEA Others Market by Country, 2023 - 2030, USD Million
- TABLE 45 LAMEA Food Traceability Market by Country, 2019 - 2022, USD Million
- TABLE 46 LAMEA Food Traceability Market by Country, 2023 - 2030, USD Million
- TABLE 47 Brazil Food Traceability Market, 2019 - 2022, USD Million
- TABLE 48 Brazil Food Traceability Market, 2023 - 2030, USD Million
- TABLE 49 Brazil Food Traceability Market by Software, 2019 - 2022, USD Million
- TABLE 50 Brazil Food Traceability Market by Software, 2023 - 2030, USD Million
- TABLE 51 Brazil Food Traceability Market by End-use, 2019 - 2022, USD Million
- TABLE 52 Brazil Food Traceability Market by End-use, 2023 - 2030, USD Million
- TABLE 53 Brazil Food Traceability Market by Type, 2019 - 2022, USD Million
- TABLE 54 Brazil Food Traceability Market by Type, 2023 - 2030, USD Million
- TABLE 55 Argentina Food Traceability Market, 2019 - 2022, USD Million
- TABLE 56 Argentina Food Traceability Market, 2023 - 2030, USD Million
- TABLE 57 Argentina Food Traceability Market by Software, 2019 - 2022, USD Million
- TABLE 58 Argentina Food Traceability Market by Software, 2023 - 2030, USD Million
- TABLE 59 Argentina Food Traceability Market by End-use, 2019 - 2022, USD Million
- TABLE 60 Argentina Food Traceability Market by End-use, 2023 - 2030, USD Million
- TABLE 61 Argentina Food Traceability Market by Type, 2019 - 2022, USD Million
- TABLE 62 Argentina Food Traceability Market by Type, 2023 - 2030, USD Million
- TABLE 63 UAE Food Traceability Market, 2019 - 2022, USD Million
- TABLE 64 UAE Food Traceability Market, 2023 - 2030, USD Million
- TABLE 65 UAE Food Traceability Market by Software, 2019 - 2022, USD Million
- TABLE 66 UAE Food Traceability Market by Software, 2023 - 2030, USD Million
- TABLE 67 UAE Food Traceability Market by End-use, 2019 - 2022, USD Million
- TABLE 68 UAE Food Traceability Market by End-use, 2023 - 2030, USD Million
- TABLE 69 UAE Food Traceability Market by Type, 2019 - 2022, USD Million
- TABLE 70 UAE Food Traceability Market by Type, 2023 - 2030, USD Million
- TABLE 71 Saudi Arabia Food Traceability Market, 2019 - 2022, USD Million
- TABLE 72 Saudi Arabia Food Traceability Market, 2023 - 2030, USD Million
- TABLE 73 Saudi Arabia Food Traceability Market by Software, 2019 - 2022, USD Million
- TABLE 74 Saudi Arabia Food Traceability Market by Software, 2023 - 2030, USD Million
- TABLE 75 Saudi Arabia Food Traceability Market by End-use, 2019 - 2022, USD Million
- TABLE 76 Saudi Arabia Food Traceability Market by End-use, 2023 - 2030, USD Million
- TABLE 77 Saudi Arabia Food Traceability Market by Type, 2019 - 2022, USD Million
- TABLE 78 Saudi Arabia Food Traceability Market by Type, 2023 - 2030, USD Million
- TABLE 79 South Africa Food Traceability Market, 2019 - 2022, USD Million
- TABLE 80 South Africa Food Traceability Market, 2023 - 2030, USD Million
- TABLE 81 South Africa Food Traceability Market by Software, 2019 - 2022, USD Million
- TABLE 82 South Africa Food Traceability Market by Software, 2023 - 2030, USD Million
- TABLE 83 South Africa Food Traceability Market by End-use, 2019 - 2022, USD Million
- TABLE 84 South Africa Food Traceability Market by End-use, 2023 - 2030, USD Million
- TABLE 85 South Africa Food Traceability Market by Type, 2019 - 2022, USD Million
- TABLE 86 South Africa Food Traceability Market by Type, 2023 - 2030, USD Million
- TABLE 87 Nigeria Food Traceability Market, 2019 - 2022, USD Million
- TABLE 88 Nigeria Food Traceability Market, 2023 - 2030, USD Million
- TABLE 89 Nigeria Food Traceability Market by Software, 2019 - 2022, USD Million
- TABLE 90 Nigeria Food Traceability Market by Software, 2023 - 2030, USD Million
- TABLE 91 Nigeria Food Traceability Market by End-use, 2019 - 2022, USD Million
- TABLE 92 Nigeria Food Traceability Market by End-use, 2023 - 2030, USD Million
- TABLE 93 Nigeria Food Traceability Market by Type, 2019 - 2022, USD Million
- TABLE 94 Nigeria Food Traceability Market by Type, 2023 - 2030, USD Million
- TABLE 95 Rest of LAMEA Food Traceability Market, 2019 - 2022, USD Million
- TABLE 96 Rest of LAMEA Food Traceability Market, 2023 - 2030, USD Million
- TABLE 97 Rest of LAMEA Food Traceability Market by Software, 2019 - 2022, USD Million
- TABLE 98 Rest of LAMEA Food Traceability Market by Software, 2023 - 2030, USD Million
- TABLE 99 Rest of LAMEA Food Traceability Market by End-use, 2019 - 2022, USD Million
- TABLE 100 Rest of LAMEA Food Traceability Market by End-use, 2023 - 2030, USD Million
- TABLE 101 Rest of LAMEA Food Traceability Market by Type, 2019 - 2022, USD Million
- TABLE 102 Rest of LAMEA Food Traceability Market by Type, 2023 - 2030, USD Million
- TABLE 103 Key information - Cognex Corporation
- TABLE 104 Key Information - Honeywell International, Inc.
- TABLE 105 Key Information - SGS S.A.
- TABLE 106 Key information - Zebra Technologies Corporation
- TABLE 107 Key Information - Carlisle Technology
- TABLE 108 Key Information - Bio-Rad Laboratories, Inc.
- TABLE 109 Key information - C.H. Robinson Worldwide, Inc.
- TABLE 110 Key Information - Optel Group
- TABLE 111 Key Information - Bar Code Integrators, Inc.
- TABLE 112 Key Information - Food Forensics Ltd
The Latin America, Middle East and Africa Food Traceability Market would witness market growth of 10.6% CAGR during the forecast period (2023-2030).
The food industry is undergoing a transformative shift driven by the imperative for increased transparency, safety, and accountability throughout the supply chain. In this changing context, food traceability solutions are essential for businesses to overcome obstacles, comply with strict regulations, and fulfill the growing demands of customers who care more than ever about food origins and safety.
Moreover, adopting food traceability systems represents a paradigm shift in how the food industry approaches supply chain management. Traditionally, the food supply chain has been characterized by complex networks of producers, distributors, retailers, and other stakeholders, each contributing to the journey of products from farm to fork. However, the industry has faced growing challenges related to food safety, quality assurance, and the need to respond swiftly to contamination or recalls.
The increase in meat production in the UAE has heightened consumer expectations regarding the transparency and quality of food products. As consumers become more informed about the safety standards, processing methods, and origin of the meat they consume, they are becoming more conscientious of these factors. It addresses these concerns by providing a transparent record of a product's journey from farm to table. Thus, the growing fish, meat, and seafood sector in the LAMEA region will boost the demand for food traceability in the region.
The China market dominated the Asia Pacific Food Traceability Market by Country in 2022 and would continue to be a dominant market till 2030; thereby, achieving a market value of $2,345.9 million by 2030. The Japan market is experiencing a CAGR of 8.8% during (2023 - 2030). Additionally, The India market would exhibit a CAGR of 10.3% during (2023 - 2030).
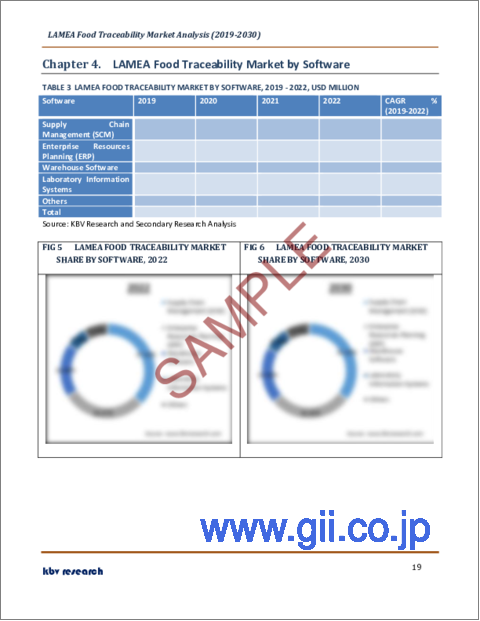
Based on Software, the market is segmented into Supply Chain Management (SCM), Enterprise Resources Planning (ERP), Warehouse Software, Laboratory Information Systems, and Others. Based on End-use, the market is segmented into Fish, Meat, & Seafood, Dairy Products, Processed Food, Fruits & Vegetables, Bakery & Confectionary, Fruit Pulp & Concentrates, and Others. Based on Type, the market is segmented into Barcodes, Radio Frequency Identification, Global Positioning Systems, Infrared, Biometrics, and Others. Based on countries, the market is segmented into Brazil, Argentina, UAE, Saudi Arabia, South Africa, Nigeria, and Rest of LAMEA.
The market research report covers the analysis of key stakeholders of the market. Key companies profiled in the report include Cognex Corporation, Honeywell International, Inc., SGS S.A., Zebra Technologies Corporation, Carlisle Technology, Bio-Rad Laboratories, Inc., C.H. Robinson Worldwide, Inc., Optel Group, Bar Code Integrators, Inc., and Food Forensics Ltd.
Scope of the Study
Market Segments covered in the Report:
By Software
- Supply Chain Management (SCM)
- Enterprise Resources Planning (ERP)
- Warehouse Software
- Laboratory Information Systems
- Others
By End-use
- Fish, Meat, & Seafood
- Dairy Products
- Processed Food
- Fruits & Vegetables
- Bakery & Confectionary
- Fruit Pulp & Concentrates
- Others
By Type
- Barcodes
- Radio Frequency Identification
- Global Positioning Systems
- Infrared
- Biometrics
- Others
By Country
- Brazil
- Argentina
- UAE
- Saudi Arabia
- South Africa
- Nigeria
- Rest of LAMEA
Companies Profiled
- Cognex Corporation
- Honeywell International, Inc.
- SGS S.A.
- Zebra Technologies Corporation
- Carlisle Technology
- Bio-Rad Laboratories, Inc.
- C.H. Robinson Worldwide, Inc.
- Optel Group
- Bar Code Integrators, Inc.
- Food Forensics Ltd
Unique Offerings from KBV Research
- Exhaustive coverage
- Highest number of market tables and figures
- Subscription based model available
- Guaranteed best price
- Assured post sales research support with 10% customization free
Table of Contents
Chapter 1. Market Scope & Methodology
- 1.1 Market Definition
- 1.2 Objectives
- 1.3 Market Scope
- 1.4 Segmentation
- 1.4.1 LAMEA Food Traceability Market, by Software
- 1.4.2 LAMEA Food Traceability Market, by End-use
- 1.4.3 LAMEA Food Traceability Market, by Type
- 1.4.4 LAMEA Food Traceability Market, by Country
- 1.5 Methodology for the research
Chapter 2. Market at a Glance
- 2.1 Key Highlights
Chapter 3. Market Overview
- 3.1 Introduction
- 3.1.1 Overview
- 3.1.1.1 Market Composition and Scenario
- 3.1.1 Overview
- 3.2 Key Factors Impacting the Market
- 3.2.1 Market Drivers
- 3.2.2 Market Restraints
- 3.3 Porter's Five Force Analysis
Chapter 4. LAMEA Food Traceability Market by Software
- 4.1 LAMEA Supply Chain Management (SCM) Market by Country
- 4.2 LAMEA Enterprise Resources Planning (ERP) Market by Country
- 4.3 LAMEA Warehouse Software Market by Country
- 4.4 LAMEA Laboratory Information Systems Market by Country
- 4.5 LAMEA Others Market by Country
Chapter 5. LAMEA Food Traceability Market by End-use
- 5.1 LAMEA Fish, Meat, & Seafood Market by Country
- 5.2 LAMEA Dairy Products Market by Country
- 5.3 LAMEA Processed Food Market by Country
- 5.4 LAMEA Fruits & Vegetables Market by Country
- 5.5 LAMEA Bakery & Confectionary Market by Country
- 5.6 LAMEA Fruit Pulp & Concentrates Market by Country
- 5.7 LAMEA Others Market by Country
Chapter 6. LAMEA Food Traceability Market by Type
- 6.1 LAMEA Barcodes Market by Country
- 6.2 LAMEA Radio Frequency Identification Market by Country
- 6.3 LAMEA Global Positioning Systems Market by Country
- 6.4 LAMEA Infrared Market by Country
- 6.5 LAMEA Biometrics Market by Country
- 6.6 LAMEA Others Market by Country
Chapter 7. LAMEA Food Traceability Market by Country
- 7.1 Brazil Food Traceability Market
- 7.1.1 Brazil Food Traceability Market by Software
- 7.1.2 Brazil Food Traceability Market by End-use
- 7.1.3 Brazil Food Traceability Market by Type
- 7.2 Argentina Food Traceability Market
- 7.2.1 Argentina Food Traceability Market by Software
- 7.2.2 Argentina Food Traceability Market by End-use
- 7.2.3 Argentina Food Traceability Market by Type
- 7.3 UAE Food Traceability Market
- 7.3.1 UAE Food Traceability Market by Software
- 7.3.2 UAE Food Traceability Market by End-use
- 7.3.3 UAE Food Traceability Market by Type
- 7.4 Saudi Arabia Food Traceability Market
- 7.4.1 Saudi Arabia Food Traceability Market by Software
- 7.4.2 Saudi Arabia Food Traceability Market by End-use
- 7.4.3 Saudi Arabia Food Traceability Market by Type
- 7.5 South Africa Food Traceability Market
- 7.5.1 South Africa Food Traceability Market by Software
- 7.5.2 South Africa Food Traceability Market by End-use
- 7.5.3 South Africa Food Traceability Market by Type
- 7.6 Nigeria Food Traceability Market
- 7.6.1 Nigeria Food Traceability Market by Software
- 7.6.2 Nigeria Food Traceability Market by End-use
- 7.6.3 Nigeria Food Traceability Market by Type
- 7.7 Rest of LAMEA Food Traceability Market
- 7.7.1 Rest of LAMEA Food Traceability Market by Software
- 7.7.2 Rest of LAMEA Food Traceability Market by End-use
- 7.7.3 Rest of LAMEA Food Traceability Market by Type
Chapter 8. Company Profiles
- 8.1 Cognex Corporation
- 8.1.1 Company Overview
- 8.1.2 Financial Analysis
- 8.1.3 Regional Analysis
- 8.1.4 Research & Development Expense
- 8.1.5 SWOT Analysis
- 8.2 Honeywell International, Inc.
- 8.2.1 Company Overview
- 8.2.3 Segmental and Regional Analysis
- 8.2.4 Research & Development Expenses
- 8.2.5 SWOT Analysis
- 8.3 SGS S.A.
- 8.3.1 Company Overview
- 8.3.2 Financial Analysis
- 8.3.3 Segmental Analysis
- 8.3.4 SWOT Analysis
- 8.4 Zebra Technologies Corporation
- 8.4.1 Company Overview
- 8.4.2 Financial Analysis
- 8.4.3 Regional & Segmental Analysis
- 8.4.4 Research & Development Expenses
- 8.4.5 SWOT Analysis
- 8.5 Carlisle Technology
- 8.5.1 Company Overview
- 8.6 Bio-Rad laboratories, Inc.
- 8.6.1 Company Overview
- 8.6.2 Financial Analysis
- 8.6.3 Segmental and Regional Analysis
- 8.6.4 Research & Development Expenses
- 8.6.5 Recent strategies and developments:
- 8.6.5.1 Product Launches and Product Expansions:
- 8.6.6 SWOT Analysis
- 8.7 C.H. Robinson Worldwide, Inc.
- 8.7.1 Company Overview
- 8.7.2 Financial Analysis
- 8.7.3 Regional & Segmental Analysis
- 8.7.4 SWOT Analysis
- 8.8 Optel Group
- 8.8.1 Company Overview
- 8.8.2 Recent strategies and developments:
- 8.8.2.1 Acquisition and Mergers:
- 8.8.3 SWOT Analysis
- 8.9 Bar Code Integrators, Inc.
- 8.9.1 Company Overview
- 8.9.2 SWOT Analysis
- 8.10. Food Forensics Ltd
- 8.10.1 Company Overview
- 8.10.2 SWOT Analysis
