|
|
市場調査レポート
商品コード
1395728
インタラクティブプロジェクターの世界市場規模、シェア、産業動向分析レポート:技術別、用途別、投影距離別、地域別展望と予測、2023年~2030年Global Interactive Projector Market Size, Share & Industry Trends Analysis Report By Technology, By Application (Education, Business, Healthcare, and Others), By Projection Distance, By Regional Outlook and Forecast, 2023 - 2030 |
||||||
|
|
|||||||
|
|||||||


| インタラクティブプロジェクターの世界市場規模、シェア、産業動向分析レポート:技術別、用途別、投影距離別、地域別展望と予測、2023年~2030年 |
|
出版日: 2023年11月30日
発行: KBV Research
ページ情報: 英文 252 Pages
納期: 即納可能
|

- 全表示
- 概要
- 図表
- 目次
インタラクティブプロジェクター市場規模は、予測期間中にCAGR 22.2%で成長し、2030年には116億米ドルに達すると予測されています。
しかし、ディスプレイ技術は儲かるため、業界参加者は革新的な製品やソリューションを生み出すために研究開発に多額の投資を行っています。テレビ、コンピュータ端末、自動車の情報ディスプレイ、医療機器、電卓、その他多数の機器は、すべてディスプレイの一般的な用途の例です。ディスプレイ・デバイスは、これらのアプリケーションのそれぞれにおいて、コンピューターやセンサーから発信される入力からの指示に従って出力を表示します。人工知能(AI)をインタラクティブ・ホワイトボードに組み込み、イベントや見本市でインタラクティブ・ディスプレイの人気が高まるにつれ、これらのプロジェクターの需要は大幅に減少しています。さらに、インタラクティブ・ディスプレイはコスト効率と競合価格が向上しており、インタラクティブ・ディスプレイとプロジェクターの間のコスト格差が縮小しています。インタラクティブ・ディスプレイの価格が低下するにつれて、より幅広い消費者層にとってより利用しやすくなり、これらのソリューションへの嗜好にさらに影響を与えています。したがって、これらの要因によって、消費者の嗜好はプロジェクターからフラット・パネル・ディスプレイにシフトします。
技術展望
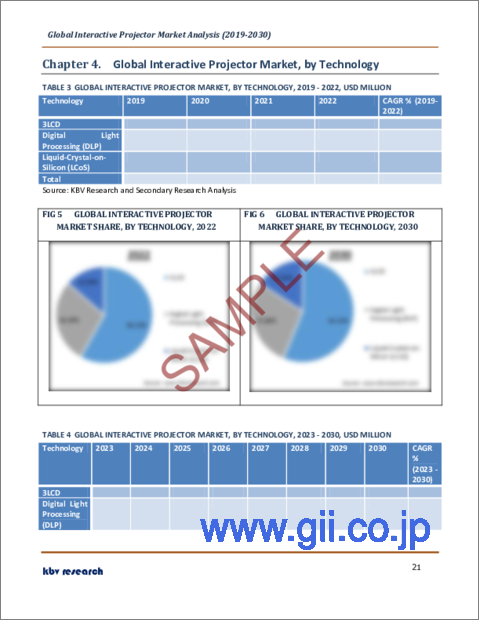
技術別に見ると、市場はデジタルライティングプロセス(DLP)、3LCD、液晶オンシリコン(LCoS)に分けられます。2022年には、3LCDセグメントが市場で最も高い収益シェアを獲得しました。3LCDプロジェクターは、その卓越した輝度レベルと色精度で有名です。プロジェクション技術の継続的な発展の結果、プロジェクターが利用されるアプリケーションの数が増加しています。一例として、エプソンは6,000ルーメンの3LCDプロジェクターと25,000ルーメンのレーザープロジェクターを生産しています。
用途展望
用途別では、市場は教育、ビジネス、ヘルスケア、その他に細分化されます。2022年には、ヘルスケア分野が市場で注目すべき収益シェアを記録しました。インタラクティブプロジェクターは、職員、患者、訪問者に情報を伝えます。また、待合室の患者に健康、保険、ヘルスケア製品やサービスに関する情報を提供します。医療教育では、講義、プレゼンテーション、学習セッションに使用されます。没入型の教育が可能になり、学生がダイナミックにコンテンツに関わることができるため、理解度や定着度の向上につながります。
投影距離の展望
投影距離によって、市場は標準投影、短焦点投影、超短焦点投影に分類されます。2022年には、超短焦点セグメントが市場で最大の収益シェアを獲得しました。超短焦点プロジェクターは、最適な性能を発揮するために、投影面からわずか数インチの距離しか必要としないです。大掛かりな取り付けが不要なこの設計は、スペースが限られた場所でも、より大きな画像の投影を可能にします。超短焦点プロジェクターのセットアップを利用することで、情報の遅延を感じることなく、より正確で快適な投影を行うことができます。
地域別展望
地域別に見ると、市場は北米、欧州、アジア太平洋、LAMEAで分析されます。北米地域は、2022年の同市場における最大収益シェアを示しました。米国におけるクラウドベースのストリーミングサービスの急拡大が主因であり、北米を含む新興経済諸国は、エンドユーザーの意識と生物多様性により、大幅な成長が見込まれています。北米地域は主に、大規模な消費者ベースとBYOD(Bring-your-own-device)イニシアチブの普及の高まりによって推進されています。
目次
第1章 市場範囲と調査手法
- 市場の定義
- 目的
- 市場範囲
- セグメンテーション
- 調査手法
第2章 市場要覧
- 主なハイライト
第3章 市場概要
- イントロダクション
- 概要
- 市場構成とシナリオ
- 概要
- 市場に影響を与える主な要因
- 市場促進要因
- 市場抑制要因
- ポーターのファイブフォース分析
第4章 世界のインタラクティブプロジェクター市場:技術別
- 世界の3LCD市場:地域別
- 世界のデジタル光処理(DLP)市場:地域別
- 世界の液晶オンシリコン(LCoS)市場:地域別
第5章 世界のインタラクティブプロジェクター市場:用途別
- 世界の教育市場:地域別
- 世界のビジネス市場:地域別
- 世界のヘルスケア市場:地域別
- 世界のその他の市場:地域別
第6章 世界のインタラクティブプロジェクター市場:投影距離別
- 世界の超短焦点市場:地域別
- 世界の短焦点市場:地域別
- 世界の標準焦点市場:地域別
第7章 世界のインタラクティブプロジェクター市場:地域別
- 北米
- 欧州
- アジア太平洋
- ラテンアメリカ・中東・アフリカ
第8章 企業プロファイル
- Qisda Corporation(BenQ)
- Casio Computer Co, Ltd.
- Dell Technologies, Inc
- Delta Electronics, Inc
- Boxlight Corporation
- Sharp NEC Display Solutions, Ltd(Sharp Corporation)
- Coretronic Corporation(Optoma Corporation)
- Panasonic Holdings Corporation
- Seiko Epson Corporation
- Hitachi, Ltd
第9章 市場の成功必須条件
LIST OF TABLES
- TABLE 1 Global Interactive Projector Market, 2019 - 2022, USD Million
- TABLE 2 Global Interactive Projector Market, 2023 - 2030, USD Million
- TABLE 3 Global Interactive Projector Market, by Technology, 2019 - 2022, USD Million
- TABLE 4 Global Interactive Projector Market, by Technology, 2023 - 2030, USD Million
- TABLE 5 Global 3LCD Market, by Region, 2019 - 2022, USD Million
- TABLE 6 Global 3LCD Market, by Region, 2023 - 2030, USD Million
- TABLE 7 Global Digital Light Processing (DLP) Market, by Region, 2019 - 2022, USD Million
- TABLE 8 Global Digital Light Processing (DLP) Market, by Region, 2023 - 2030, USD Million
- TABLE 9 Global Liquid-Crystal-on-Silicon (LCoS) Market, by Region, 2019 - 2022, USD Million
- TABLE 10 Global Liquid-Crystal-on-Silicon (LCoS) Market, by Region, 2023 - 2030, USD Million
- TABLE 11 Global Interactive Projector Market, by Application, 2019 - 2022, USD Million
- TABLE 12 Global Interactive Projector Market, by Application, 2023 - 2030, USD Million
- TABLE 13 Global Education Market, by Region, 2019 - 2022, USD Million
- TABLE 14 Global Education Market, by Region, 2023 - 2030, USD Million
- TABLE 15 Global Business Market, by Region, 2019 - 2022, USD Million
- TABLE 16 Global Business Market, by Region, 2023 - 2030, USD Million
- TABLE 17 Global Healthcare Market, by Region, 2019 - 2022, USD Million
- TABLE 18 Global Healthcare Market, by Region, 2023 - 2030, USD Million
- TABLE 19 Global Others Market, by Region, 2019 - 2022, USD Million
- TABLE 20 Global Others Market, by Region, 2023 - 2030, USD Million
- TABLE 21 Global Interactive Projector Market, by Projection Distance, 2019 - 2022, USD Million
- TABLE 22 Global Interactive Projector Market, by Projection Distance, 2023 - 2030, USD Million
- TABLE 23 Global Ultra-short throw Market, by Region, 2019 - 2022, USD Million
- TABLE 24 Global Ultra-short throw Market, by Region, 2023 - 2030, USD Million
- TABLE 25 Global Short throw Market, by Region, 2019 - 2022, USD Million
- TABLE 26 Global Short throw Market, by Region, 2023 - 2030, USD Million
- TABLE 27 Global Standard throw Market, by Region, 2019 - 2022, USD Million
- TABLE 28 Global Standard throw Market, by Region, 2023 - 2030, USD Million
- TABLE 29 Global Interactive Projector Market, by Region, 2019 - 2022, USD Million
- TABLE 30 Global Interactive Projector Market, by Region, 2023 - 2030, USD Million
- TABLE 31 North America Interactive Projector Market, 2019 - 2022, USD Million
- TABLE 32 North America Interactive Projector Market, 2023 - 2030, USD Million
- TABLE 33 North America Interactive Projector Market, by Technology, 2019 - 2022, USD Million
- TABLE 34 North America Interactive Projector Market, by Technology, 2023 - 2030, USD Million
- TABLE 35 North America 3LCD Market, by Country, 2019 - 2022, USD Million
- TABLE 36 North America 3LCD Market, by Country, 2023 - 2030, USD Million
- TABLE 37 North America Digital Light Processing (DLP) Market, by Country, 2019 - 2022, USD Million
- TABLE 38 North America Digital Light Processing (DLP) Market, by Country, 2023 - 2030, USD Million
- TABLE 39 North America Liquid-Crystal-on-Silicon (LCoS) Market, by Country, 2019 - 2022, USD Million
- TABLE 40 North America Liquid-Crystal-on-Silicon (LCoS) Market, by Country, 2023 - 2030, USD Million
- TABLE 41 North America Interactive Projector Market, by Application, 2019 - 2022, USD Million
- TABLE 42 North America Interactive Projector Market, by Application, 2023 - 2030, USD Million
- TABLE 43 North America Education Market, by Country, 2019 - 2022, USD Million
- TABLE 44 North America Education Market, by Country, 2023 - 2030, USD Million
- TABLE 45 North America Business Market, by Country, 2019 - 2022, USD Million
- TABLE 46 North America Business Market, by Country, 2023 - 2030, USD Million
- TABLE 47 North America Healthcare Market, by Country, 2019 - 2022, USD Million
- TABLE 48 North America Healthcare Market, by Country, 2023 - 2030, USD Million
- TABLE 49 North America Others Market, by Country, 2019 - 2022, USD Million
- TABLE 50 North America Others Market, by Country, 2023 - 2030, USD Million
- TABLE 51 North America Interactive Projector Market, by Projection Distance, 2019 - 2022, USD Million
- TABLE 52 North America Interactive Projector Market, by Projection Distance, 2023 - 2030, USD Million
- TABLE 53 North America Ultra-short throw Market, by Country, 2019 - 2022, USD Million
- TABLE 54 North America Ultra-short throw Market, by Country, 2023 - 2030, USD Million
- TABLE 55 North America Short throw Market, by Country, 2019 - 2022, USD Million
- TABLE 56 North America Short throw Market, by Country, 2023 - 2030, USD Million
- TABLE 57 North America Standard throw Market, by Country, 2019 - 2022, USD Million
- TABLE 58 North America Standard throw Market, by Country, 2023 - 2030, USD Million
- TABLE 59 North America Interactive Projector Market, by Country, 2019 - 2022, USD Million
- TABLE 60 North America Interactive Projector Market, by Country, 2023 - 2030, USD Million
- TABLE 61 US Interactive Projector Market, 2019 - 2022, USD Million
- TABLE 62 US Interactive Projector Market, 2023 - 2030, USD Million
- TABLE 63 US Interactive Projector Market, by Technology, 2019 - 2022, USD Million
- TABLE 64 US Interactive Projector Market, by Technology, 2023 - 2030, USD Million
- TABLE 65 US Interactive Projector Market, by Application, 2019 - 2022, USD Million
- TABLE 66 US Interactive Projector Market, by Application, 2023 - 2030, USD Million
- TABLE 67 US Interactive Projector Market, by Projection Distance, 2019 - 2022, USD Million
- TABLE 68 US Interactive Projector Market, by Projection Distance, 2023 - 2030, USD Million
- TABLE 69 Canada Interactive Projector Market, 2019 - 2022, USD Million
- TABLE 70 Canada Interactive Projector Market, 2023 - 2030, USD Million
- TABLE 71 Canada Interactive Projector Market, by Technology, 2019 - 2022, USD Million
- TABLE 72 Canada Interactive Projector Market, by Technology, 2023 - 2030, USD Million
- TABLE 73 Canada Interactive Projector Market, by Application, 2019 - 2022, USD Million
- TABLE 74 Canada Interactive Projector Market, by Application, 2023 - 2030, USD Million
- TABLE 75 Canada Interactive Projector Market, by Projection Distance, 2019 - 2022, USD Million
- TABLE 76 Canada Interactive Projector Market, by Projection Distance, 2023 - 2030, USD Million
- TABLE 77 Mexico Interactive Projector Market, 2019 - 2022, USD Million
- TABLE 78 Mexico Interactive Projector Market, 2023 - 2030, USD Million
- TABLE 79 Mexico Interactive Projector Market, by Technology, 2019 - 2022, USD Million
- TABLE 80 Mexico Interactive Projector Market, by Technology, 2023 - 2030, USD Million
- TABLE 81 Mexico Interactive Projector Market, by Application, 2019 - 2022, USD Million
- TABLE 82 Mexico Interactive Projector Market, by Application, 2023 - 2030, USD Million
- TABLE 83 Mexico Interactive Projector Market, by Projection Distance, 2019 - 2022, USD Million
- TABLE 84 Mexico Interactive Projector Market, by Projection Distance, 2023 - 2030, USD Million
- TABLE 85 Rest of North America Interactive Projector Market, 2019 - 2022, USD Million
- TABLE 86 Rest of North America Interactive Projector Market, 2023 - 2030, USD Million
- TABLE 87 Rest of North America Interactive Projector Market, by Technology, 2019 - 2022, USD Million
- TABLE 88 Rest of North America Interactive Projector Market, by Technology, 2023 - 2030, USD Million
- TABLE 89 Rest of North America Interactive Projector Market, by Application, 2019 - 2022, USD Million
- TABLE 90 Rest of North America Interactive Projector Market, by Application, 2023 - 2030, USD Million
- TABLE 91 Rest of North America Interactive Projector Market, by Projection Distance, 2019 - 2022, USD Million
- TABLE 92 Rest of North America Interactive Projector Market, by Projection Distance, 2023 - 2030, USD Million
- TABLE 93 Europe Interactive Projector Market, 2019 - 2022, USD Million
- TABLE 94 Europe Interactive Projector Market, 2023 - 2030, USD Million
- TABLE 95 Europe Interactive Projector Market, by Technology, 2019 - 2022, USD Million
- TABLE 96 Europe Interactive Projector Market, by Technology, 2023 - 2030, USD Million
- TABLE 97 Europe 3LCD Market, by Country, 2019 - 2022, USD Million
- TABLE 98 Europe 3LCD Market, by Country, 2023 - 2030, USD Million
- TABLE 99 Europe Digital Light Processing (DLP) Market, by Country, 2019 - 2022, USD Million
- TABLE 100 Europe Digital Light Processing (DLP) Market, by Country, 2023 - 2030, USD Million
- TABLE 101 Europe Liquid-Crystal-on-Silicon (LCoS) Market, by Country, 2019 - 2022, USD Million
- TABLE 102 Europe Liquid-Crystal-on-Silicon (LCoS) Market, by Country, 2023 - 2030, USD Million
- TABLE 103 Europe Interactive Projector Market, by Application, 2019 - 2022, USD Million
- TABLE 104 Europe Interactive Projector Market, by Application, 2023 - 2030, USD Million
- TABLE 105 Europe Education Market, by Country, 2019 - 2022, USD Million
- TABLE 106 Europe Education Market, by Country, 2023 - 2030, USD Million
- TABLE 107 Europe Business Market, by Country, 2019 - 2022, USD Million
- TABLE 108 Europe Business Market, by Country, 2023 - 2030, USD Million
- TABLE 109 Europe Healthcare Market, by Country, 2019 - 2022, USD Million
- TABLE 110 Europe Healthcare Market, by Country, 2023 - 2030, USD Million
- TABLE 111 Europe Others Market, by Country, 2019 - 2022, USD Million
- TABLE 112 Europe Others Market, by Country, 2023 - 2030, USD Million
- TABLE 113 Europe Interactive Projector Market, by Projection Distance, 2019 - 2022, USD Million
- TABLE 114 Europe Interactive Projector Market, by Projection Distance, 2023 - 2030, USD Million
- TABLE 115 Europe Ultra-short throw Market, by Country, 2019 - 2022, USD Million
- TABLE 116 Europe Ultra-short throw Market, by Country, 2023 - 2030, USD Million
- TABLE 117 Europe Short throw Market, by Country, 2019 - 2022, USD Million
- TABLE 118 Europe Short throw Market, by Country, 2023 - 2030, USD Million
- TABLE 119 Europe Standard throw Market, by Country, 2019 - 2022, USD Million
- TABLE 120 Europe Standard throw Market, by Country, 2023 - 2030, USD Million
- TABLE 121 Europe Interactive Projector Market, by Country, 2019 - 2022, USD Million
- TABLE 122 Europe Interactive Projector Market, by Country, 2023 - 2030, USD Million
- TABLE 123 Germany Interactive Projector Market, 2019 - 2022, USD Million
- TABLE 124 Germany Interactive Projector Market, 2023 - 2030, USD Million
- TABLE 125 Germany Interactive Projector Market, by Technology, 2019 - 2022, USD Million
- TABLE 126 Germany Interactive Projector Market, by Technology, 2023 - 2030, USD Million
- TABLE 127 Germany Interactive Projector Market, by Application, 2019 - 2022, USD Million
- TABLE 128 Germany Interactive Projector Market, by Application, 2023 - 2030, USD Million
- TABLE 129 Germany Interactive Projector Market, by Projection Distance, 2019 - 2022, USD Million
- TABLE 130 Germany Interactive Projector Market, by Projection Distance, 2023 - 2030, USD Million
- TABLE 131 UK Interactive Projector Market, 2019 - 2022, USD Million
- TABLE 132 UK Interactive Projector Market, 2023 - 2030, USD Million
- TABLE 133 UK Interactive Projector Market, by Technology, 2019 - 2022, USD Million
- TABLE 134 UK Interactive Projector Market, by Technology, 2023 - 2030, USD Million
- TABLE 135 UK Interactive Projector Market, by Application, 2019 - 2022, USD Million
- TABLE 136 UK Interactive Projector Market, by Application, 2023 - 2030, USD Million
- TABLE 137 UK Interactive Projector Market, by Projection Distance, 2019 - 2022, USD Million
- TABLE 138 UK Interactive Projector Market, by Projection Distance, 2023 - 2030, USD Million
- TABLE 139 France Interactive Projector Market, 2019 - 2022, USD Million
- TABLE 140 France Interactive Projector Market, 2023 - 2030, USD Million
- TABLE 141 France Interactive Projector Market, by Technology, 2019 - 2022, USD Million
- TABLE 142 France Interactive Projector Market, by Technology, 2023 - 2030, USD Million
- TABLE 143 France Interactive Projector Market, by Application, 2019 - 2022, USD Million
- TABLE 144 France Interactive Projector Market, by Application, 2023 - 2030, USD Million
- TABLE 145 France Interactive Projector Market, by Projection Distance, 2019 - 2022, USD Million
- TABLE 146 France Interactive Projector Market, by Projection Distance, 2023 - 2030, USD Million
- TABLE 147 Russia Interactive Projector Market, 2019 - 2022, USD Million
- TABLE 148 Russia Interactive Projector Market, 2023 - 2030, USD Million
- TABLE 149 Russia Interactive Projector Market, by Technology, 2019 - 2022, USD Million
- TABLE 150 Russia Interactive Projector Market, by Technology, 2023 - 2030, USD Million
- TABLE 151 Russia Interactive Projector Market, by Application, 2019 - 2022, USD Million
- TABLE 152 Russia Interactive Projector Market, by Application, 2023 - 2030, USD Million
- TABLE 153 Russia Interactive Projector Market, by Projection Distance, 2019 - 2022, USD Million
- TABLE 154 Russia Interactive Projector Market, by Projection Distance, 2023 - 2030, USD Million
- TABLE 155 Spain Interactive Projector Market, 2019 - 2022, USD Million
- TABLE 156 Spain Interactive Projector Market, 2023 - 2030, USD Million
- TABLE 157 Spain Interactive Projector Market, by Technology, 2019 - 2022, USD Million
- TABLE 158 Spain Interactive Projector Market, by Technology, 2023 - 2030, USD Million
- TABLE 159 Spain Interactive Projector Market, by Application, 2019 - 2022, USD Million
- TABLE 160 Spain Interactive Projector Market, by Application, 2023 - 2030, USD Million
- TABLE 161 Spain Interactive Projector Market, by Projection Distance, 2019 - 2022, USD Million
- TABLE 162 Spain Interactive Projector Market, by Projection Distance, 2023 - 2030, USD Million
- TABLE 163 Italy Interactive Projector Market, 2019 - 2022, USD Million
- TABLE 164 Italy Interactive Projector Market, 2023 - 2030, USD Million
- TABLE 165 Italy Interactive Projector Market, by Technology, 2019 - 2022, USD Million
- TABLE 166 Italy Interactive Projector Market, by Technology, 2023 - 2030, USD Million
- TABLE 167 Italy Interactive Projector Market, by Application, 2019 - 2022, USD Million
- TABLE 168 Italy Interactive Projector Market, by Application, 2023 - 2030, USD Million
- TABLE 169 Italy Interactive Projector Market, by Projection Distance, 2019 - 2022, USD Million
- TABLE 170 Italy Interactive Projector Market, by Projection Distance, 2023 - 2030, USD Million
- TABLE 171 Rest of Europe Interactive Projector Market, 2019 - 2022, USD Million
- TABLE 172 Rest of Europe Interactive Projector Market, 2023 - 2030, USD Million
- TABLE 173 Rest of Europe Interactive Projector Market, by Technology, 2019 - 2022, USD Million
- TABLE 174 Rest of Europe Interactive Projector Market, by Technology, 2023 - 2030, USD Million
- TABLE 175 Rest of Europe Interactive Projector Market, by Application, 2019 - 2022, USD Million
- TABLE 176 Rest of Europe Interactive Projector Market, by Application, 2023 - 2030, USD Million
- TABLE 177 Rest of Europe Interactive Projector Market, by Projection Distance, 2019 - 2022, USD Million
- TABLE 178 Rest of Europe Interactive Projector Market, by Projection Distance, 2023 - 2030, USD Million
- TABLE 179 Asia Pacific Interactive Projector Market, 2019 - 2022, USD Million
- TABLE 180 Asia Pacific Interactive Projector Market, 2023 - 2030, USD Million
- TABLE 181 Asia Pacific Interactive Projector Market, by Technology, 2019 - 2022, USD Million
- TABLE 182 Asia Pacific Interactive Projector Market, by Technology, 2023 - 2030, USD Million
- TABLE 183 Asia Pacific 3LCD Market, by Country, 2019 - 2022, USD Million
- TABLE 184 Asia Pacific 3LCD Market, by Country, 2023 - 2030, USD Million
- TABLE 185 Asia Pacific Digital Light Processing (DLP) Market, by Country, 2019 - 2022, USD Million
- TABLE 186 Asia Pacific Digital Light Processing (DLP) Market, by Country, 2023 - 2030, USD Million
- TABLE 187 Asia Pacific Liquid-Crystal-on-Silicon (LCoS) Market, by Country, 2019 - 2022, USD Million
- TABLE 188 Asia Pacific Liquid-Crystal-on-Silicon (LCoS) Market, by Country, 2023 - 2030, USD Million
- TABLE 189 Asia Pacific Interactive Projector Market, by Application, 2019 - 2022, USD Million
- TABLE 190 Asia Pacific Interactive Projector Market, by Application, 2023 - 2030, USD Million
- TABLE 191 Asia Pacific Education Market, by Country, 2019 - 2022, USD Million
- TABLE 192 Asia Pacific Education Market, by Country, 2023 - 2030, USD Million
- TABLE 193 Asia Pacific Business Market, by Country, 2019 - 2022, USD Million
- TABLE 194 Asia Pacific Business Market, by Country, 2023 - 2030, USD Million
- TABLE 195 Asia Pacific Healthcare Market, by Country, 2019 - 2022, USD Million
- TABLE 196 Asia Pacific Healthcare Market, by Country, 2023 - 2030, USD Million
- TABLE 197 Asia Pacific Others Market, by Country, 2019 - 2022, USD Million
- TABLE 198 Asia Pacific Others Market, by Country, 2023 - 2030, USD Million
- TABLE 199 Asia Pacific Interactive Projector Market, by Projection Distance, 2019 - 2022, USD Million
- TABLE 200 Asia Pacific Interactive Projector Market, by Projection Distance, 2023 - 2030, USD Million
- TABLE 201 Asia Pacific Ultra-short throw Market, by Country, 2019 - 2022, USD Million
- TABLE 202 Asia Pacific Ultra-short throw Market, by Country, 2023 - 2030, USD Million
- TABLE 203 Asia Pacific Short throw Market, by Country, 2019 - 2022, USD Million
- TABLE 204 Asia Pacific Short throw Market, by Country, 2023 - 2030, USD Million
- TABLE 205 Asia Pacific Standard throw Market, by Country, 2019 - 2022, USD Million
- TABLE 206 Asia Pacific Standard throw Market, by Country, 2023 - 2030, USD Million
- TABLE 207 Asia Pacific Interactive Projector Market, by Country, 2019 - 2022, USD Million
- TABLE 208 Asia Pacific Interactive Projector Market, by Country, 2023 - 2030, USD Million
- TABLE 209 China Interactive Projector Market, 2019 - 2022, USD Million
- TABLE 210 China Interactive Projector Market, 2023 - 2030, USD Million
- TABLE 211 China Interactive Projector Market, by Technology, 2019 - 2022, USD Million
- TABLE 212 China Interactive Projector Market, by Technology, 2023 - 2030, USD Million
- TABLE 213 China Interactive Projector Market, by Application, 2019 - 2022, USD Million
- TABLE 214 China Interactive Projector Market, by Application, 2023 - 2030, USD Million
- TABLE 215 China Interactive Projector Market, by Projection Distance, 2019 - 2022, USD Million
- TABLE 216 China Interactive Projector Market, by Projection Distance, 2023 - 2030, USD Million
- TABLE 217 Japan Interactive Projector Market, 2019 - 2022, USD Million
- TABLE 218 Japan Interactive Projector Market, 2023 - 2030, USD Million
- TABLE 219 Japan Interactive Projector Market, by Technology, 2019 - 2022, USD Million
- TABLE 220 Japan Interactive Projector Market, by Technology, 2023 - 2030, USD Million
- TABLE 221 Japan Interactive Projector Market, by Application, 2019 - 2022, USD Million
- TABLE 222 Japan Interactive Projector Market, by Application, 2023 - 2030, USD Million
- TABLE 223 Japan Interactive Projector Market, by Projection Distance, 2019 - 2022, USD Million
- TABLE 224 Japan Interactive Projector Market, by Projection Distance, 2023 - 2030, USD Million
- TABLE 225 India Interactive Projector Market, 2019 - 2022, USD Million
- TABLE 226 India Interactive Projector Market, 2023 - 2030, USD Million
- TABLE 227 India Interactive Projector Market, by Technology, 2019 - 2022, USD Million
- TABLE 228 India Interactive Projector Market, by Technology, 2023 - 2030, USD Million
- TABLE 229 India Interactive Projector Market, by Application, 2019 - 2022, USD Million
- TABLE 230 India Interactive Projector Market, by Application, 2023 - 2030, USD Million
- TABLE 231 India Interactive Projector Market, by Projection Distance, 2019 - 2022, USD Million
- TABLE 232 India Interactive Projector Market, by Projection Distance, 2023 - 2030, USD Million
- TABLE 233 South Korea Interactive Projector Market, 2019 - 2022, USD Million
- TABLE 234 South Korea Interactive Projector Market, 2023 - 2030, USD Million
- TABLE 235 South Korea Interactive Projector Market, by Technology, 2019 - 2022, USD Million
- TABLE 236 South Korea Interactive Projector Market, by Technology, 2023 - 2030, USD Million
- TABLE 237 South Korea Interactive Projector Market, by Application, 2019 - 2022, USD Million
- TABLE 238 South Korea Interactive Projector Market, by Application, 2023 - 2030, USD Million
- TABLE 239 South Korea Interactive Projector Market, by Projection Distance, 2019 - 2022, USD Million
- TABLE 240 South Korea Interactive Projector Market, by Projection Distance, 2023 - 2030, USD Million
- TABLE 241 Singapore Interactive Projector Market, 2019 - 2022, USD Million
- TABLE 242 Singapore Interactive Projector Market, 2023 - 2030, USD Million
- TABLE 243 Singapore Interactive Projector Market, by Technology, 2019 - 2022, USD Million
- TABLE 244 Singapore Interactive Projector Market, by Technology, 2023 - 2030, USD Million
- TABLE 245 Singapore Interactive Projector Market, by Application, 2019 - 2022, USD Million
- TABLE 246 Singapore Interactive Projector Market, by Application, 2023 - 2030, USD Million
- TABLE 247 Singapore Interactive Projector Market, by Projection Distance, 2019 - 2022, USD Million
- TABLE 248 Singapore Interactive Projector Market, by Projection Distance, 2023 - 2030, USD Million
- TABLE 249 Malaysia Interactive Projector Market, 2019 - 2022, USD Million
- TABLE 250 Malaysia Interactive Projector Market, 2023 - 2030, USD Million
- TABLE 251 Malaysia Interactive Projector Market, by Technology, 2019 - 2022, USD Million
- TABLE 252 Malaysia Interactive Projector Market, by Technology, 2023 - 2030, USD Million
- TABLE 253 Malaysia Interactive Projector Market, by Application, 2019 - 2022, USD Million
- TABLE 254 Malaysia Interactive Projector Market, by Application, 2023 - 2030, USD Million
- TABLE 255 Malaysia Interactive Projector Market, by Projection Distance, 2019 - 2022, USD Million
- TABLE 256 Malaysia Interactive Projector Market, by Projection Distance, 2023 - 2030, USD Million
- TABLE 257 Rest of Asia Pacific Interactive Projector Market, 2019 - 2022, USD Million
- TABLE 258 Rest of Asia Pacific Interactive Projector Market, 2023 - 2030, USD Million
- TABLE 259 Rest of Asia Pacific Interactive Projector Market, by Technology, 2019 - 2022, USD Million
- TABLE 260 Rest of Asia Pacific Interactive Projector Market, by Technology, 2023 - 2030, USD Million
- TABLE 261 Rest of Asia Pacific Interactive Projector Market, by Application, 2019 - 2022, USD Million
- TABLE 262 Rest of Asia Pacific Interactive Projector Market, by Application, 2023 - 2030, USD Million
- TABLE 263 Rest of Asia Pacific Interactive Projector Market, by Projection Distance, 2019 - 2022, USD Million
- TABLE 264 Rest of Asia Pacific Interactive Projector Market, by Projection Distance, 2023 - 2030, USD Million
- TABLE 265 LAMEA Interactive Projector Market, 2019 - 2022, USD Million
- TABLE 266 LAMEA Interactive Projector Market, 2023 - 2030, USD Million
- TABLE 267 LAMEA Interactive Projector Market, by Technology, 2019 - 2022, USD Million
- TABLE 268 LAMEA Interactive Projector Market, by Technology, 2023 - 2030, USD Million
- TABLE 269 LAMEA 3LCD Market, by Country, 2019 - 2022, USD Million
- TABLE 270 LAMEA 3LCD Market, by Country, 2023 - 2030, USD Million
- TABLE 271 LAMEA Digital Light Processing (DLP) Market, by Country, 2019 - 2022, USD Million
- TABLE 272 LAMEA Digital Light Processing (DLP) Market, by Country, 2023 - 2030, USD Million
- TABLE 273 LAMEA Liquid-Crystal-on-Silicon (LCoS) Market, by Country, 2019 - 2022, USD Million
- TABLE 274 LAMEA Liquid-Crystal-on-Silicon (LCoS) Market, by Country, 2023 - 2030, USD Million
- TABLE 275 LAMEA Interactive Projector Market, by Application, 2019 - 2022, USD Million
- TABLE 276 LAMEA Interactive Projector Market, by Application, 2023 - 2030, USD Million
- TABLE 277 LAMEA Education Market, by Country, 2019 - 2022, USD Million
- TABLE 278 LAMEA Education Market, by Country, 2023 - 2030, USD Million
- TABLE 279 LAMEA Business Market, by Country, 2019 - 2022, USD Million
- TABLE 280 LAMEA Business Market, by Country, 2023 - 2030, USD Million
- TABLE 281 LAMEA Healthcare Market, by Country, 2019 - 2022, USD Million
- TABLE 282 LAMEA Healthcare Market, by Country, 2023 - 2030, USD Million
- TABLE 283 LAMEA Others Market, by Country, 2019 - 2022, USD Million
- TABLE 284 LAMEA Others Market, by Country, 2023 - 2030, USD Million
- TABLE 285 LAMEA Interactive Projector Market, by Projection Distance, 2019 - 2022, USD Million
- TABLE 286 LAMEA Interactive Projector Market, by Projection Distance, 2023 - 2030, USD Million
- TABLE 287 LAMEA Ultra-short throw Market, by Country, 2019 - 2022, USD Million
- TABLE 288 LAMEA Ultra-short throw Market, by Country, 2023 - 2030, USD Million
- TABLE 289 LAMEA Short throw Market, by Country, 2019 - 2022, USD Million
- TABLE 290 LAMEA Short throw Market, by Country, 2023 - 2030, USD Million
- TABLE 291 LAMEA Standard throw Market, by Country, 2019 - 2022, USD Million
- TABLE 292 LAMEA Standard throw Market, by Country, 2023 - 2030, USD Million
- TABLE 293 LAMEA Interactive Projector Market, by Country, 2019 - 2022, USD Million
- TABLE 294 LAMEA Interactive Projector Market, by Country, 2023 - 2030, USD Million
- TABLE 295 Brazil Interactive Projector Market, 2019 - 2022, USD Million
- TABLE 296 Brazil Interactive Projector Market, 2023 - 2030, USD Million
- TABLE 297 Brazil Interactive Projector Market, by Technology, 2019 - 2022, USD Million
- TABLE 298 Brazil Interactive Projector Market, by Technology, 2023 - 2030, USD Million
- TABLE 299 Brazil Interactive Projector Market, by Application, 2019 - 2022, USD Million
- TABLE 300 Brazil Interactive Projector Market, by Application, 2023 - 2030, USD Million
- TABLE 301 Brazil Interactive Projector Market, by Projection Distance, 2019 - 2022, USD Million
- TABLE 302 Brazil Interactive Projector Market, by Projection Distance, 2023 - 2030, USD Million
- TABLE 303 Argentina Interactive Projector Market, 2019 - 2022, USD Million
- TABLE 304 Argentina Interactive Projector Market, 2023 - 2030, USD Million
- TABLE 305 Argentina Interactive Projector Market, by Technology, 2019 - 2022, USD Million
- TABLE 306 Argentina Interactive Projector Market, by Technology, 2023 - 2030, USD Million
- TABLE 307 Argentina Interactive Projector Market, by Application, 2019 - 2022, USD Million
- TABLE 308 Argentina Interactive Projector Market, by Application, 2023 - 2030, USD Million
- TABLE 309 Argentina Interactive Projector Market, by Projection Distance, 2019 - 2022, USD Million
- TABLE 310 Argentina Interactive Projector Market, by Projection Distance, 2023 - 2030, USD Million
The Global Interactive Projector Market size is expected to reach $11.6 billion by 2030, rising at a market growth of 22.2% CAGR during the forecast period.
Digitization has contributed to the success of K-12 education by transforming the conventional education system. Consequently, the education segment has captured $1,089.5 million revenue in the market in 2022. The digital education industry is highly competitive, with local and national universities, emerging online education giants, and newer nondegree providers contending for market share. A proliferation of digital education start-ups is causing significant disruption in the industry, primarily propelled by increased venture capital funding. An illustration of this can be seen in a July 2022 article by McKinsey & Company, which states that venture capital funding for education technology (edtech) in the United States increased to $8 billion between 2017 and 2021. Some of the factors impacting the market are Increasing demand for innovation and cost-effectiveness, Rising usage of interactive projectors in various sectors and Shift from these projectors to interactive flat panel display.
Interactive projectors have undergone significant innovation, offering advanced features that enhance functionality while maintaining cost-effectiveness. One of the key innovative features driving demand is multi-touch capability. Advanced interactive projectors now offer multi-touch functionality, allowing multiple users to interact simultaneously with the projected content using their fingers or styluses. The integration of wireless connectivity and compatibility with various devices is a game-changing innovation. Additionally, Beyond education, interactive projectors are experiencing rising usage in several sectors, transforming traditional presentations and enhancing collaboration in innovative ways. Businesses utilize these projectors for brainstorming sessions, strategy planning, and project management. The interactive features enable real-time annotation, data manipulation, and seamless integration with collaborative software, facilitating efficient communication among team members, both in-person and remotely. Moreover, the healthcare sector has embraced interactive projectors for various applications. From medical conferences and presentations to interactive patient education, these projectors offer a versatile platform for medical professionals. This technology enables stakeholders to visualize and interact with proposed designs, fostering better communication and decision-making in architectural and urban development projects. Therefore, the rising usage of interactive projectors in various sectors drives the expansion of the market.
However, Due to the lucrative nature of display technology, industry participants invest heavily in R&D to create innovative products and solutions. Televisions, computer terminals, information displays in automobiles, medical devices, calculators, and numerous other instruments are all examples of general applications for displays. The display device illustrates output in each of these applications in accordance with the instructions transmitted to it from an input, which may originate from a computer or a sensor. Incorporating artificial intelligence (AI) into interactive whiteboards and the rising popularity of interactive displays at events and tradeshows substantially reduce the demand for these projectors. Moreover, interactive displays are becoming more cost-effective and competitively priced, narrowing the cost gap between interactive displays and projectors. As the prices of interactive displays decrease, they become more accessible to a broader consumer base, further influencing preferences toward these solutions. Therefore, these factors shift consumer preference from projectors to flat panel displays.
Technology Outlook
On the basis of technology, the market is divided into digital lighting process (DLP), 3LCD, and liquid-crystal-on-silicon (LCoS). In 2022, the 3LCD segment gained the highest revenue share in the market. 3LCD projectors are renowned for their exceptional luminosity levels and color accuracy. As a result of the continuing development of projection technology, the number of applications for which projectors are utilized has increased. As an illustration, Epson produced a 3LCD projector boasting a lumen output of 6,000 and a laser projector with a lumen output of 25,000.
Application Outlook
On the basis of application, the market is fragmented into education, business, healthcare, and others. In 2022, the healthcare segment recorded a noteworthy revenue share in the market. Interactive projectors convey information to personnel, patients, and visitors. They also provide patients in the waiting room with information about health, insurance, and healthcare products and services. In medical education, they are used for lectures, presentations, and learning sessions. They enable immersive teaching experiences, allowing students to engage with content dynamically, leading to better comprehension and retention.
Projection Distance Outlook
Based on the projection distance, the market is classified into standard throw, short throw, and ultra-short throw. In 2022, the ultra-short throw segment procured the largest revenue share in the market. For optimal performance, ultra-short throw projectors require only a few inches from the projection surface. By eliminating the need for extensive mounting, this design enables the projection of a larger image, even in spaces with limited space. By utilizing an ultra-short-throw projection setup, individuals can engage with the projected material with enhanced precision and comfort without any discernible delay in information.
Regional Outlook
Region-wise, the market is analyzed across North America, Europe, Asia Pacific, and LAMEA. The North America region witnessed the maximum revenue share in the market in 2022. Predominantly attributable to the exponential expansion of cloud-based streaming services in the United States, developed economies, including North America, are anticipated to experience substantial growth because of end-user awareness and biodiversity. The North American region is primarily propelled by the sizable consumer base and the rising prevalence of bring-your-own-device (BYOD) initiatives.
The market research report covers the analysis of key stake holders of the market. Key companies profiled in the report include Qisda Corporation (BenQ), Casio Computer Co., Ltd., Dell Technologies, Inc., Delta Electronics, Inc., Boxlight Corporation, Sharp NEC Display Solutions, Ltd. (Sharp Corporation), Coretronic Corporation, Panasonic Holdings Corporation, Seiko Epson Corporation and Hitachi, Ltd.
Scope of the Study
Market Segments covered in the Report:
By Technology
- 3LCD
- Digital Light Processing (DLP)
- Liquid-Crystal-on-Silicon (LCoS)
By Application
- Education
- Business
- Healthcare
- Others
By Projection Distance
- Ultra-short throw
- Short throw
- Standard throw
By Geography
- North America
- US
- Canada
- Mexico
- Rest of North America
- Europe
- Germany
- UK
- France
- Russia
- Spain
- Italy
- Rest of Europe
- Asia Pacific
- China
- Japan
- India
- South Korea
- Singapore
- Malaysia
- Rest of Asia Pacific
- LAMEA
- Brazil
- Argentina
- UAE
- Saudi Arabia
- South Africa
- Nigeria
- Rest of LAMEA
Companies Profiled
- Qisda Corporation (BenQ)
- Casio Computer Co., Ltd.
- Dell Technologies, Inc.
- Delta Electronics, Inc.
- Boxlight Corporation
- Sharp NEC Display Solutions, Ltd. (Sharp Corporation)
- Coretronic Corporation
- Panasonic Holdings Corporation
- Seiko Epson Corporation
- Hitachi, Ltd.
Unique Offerings from KBV Research
- Exhaustive coverage
- Highest number of market tables and figures
- Subscription based model available
- Guaranteed best price
- Assured post sales research support with 10% customization free
Table of Contents
Chapter 1. Market Scope & Methodology
- 1.1 Market Definition
- 1.2 Objectives
- 1.3 Market Scope
- 1.4 Segmentation
- 1.4.1 Global Interactive Projector Market, by Technology
- 1.4.2 Global Interactive Projector Market, by Application
- 1.4.3 Global Interactive Projector Market, by Projection Distance
- 1.4.4 Global Interactive Projector Market, by Geography
- 1.5 Methodology for the research
Chapter 2. Market at a Glance
- 2.1 Key Highlights
Chapter 3. Market Overview
- 3.1 Introduction
- 3.1.1 Overview
- 3.1.1.1 Market Composition and Scenario
- 3.1.1 Overview
- 3.2 Key Factors Impacting the Market
- 3.2.1 Market Drivers
- 3.2.2 Market Restraints
- 3.3 Porter's Five Forces Analysis
Chapter 4. Global Interactive Projector Market, by Technology
- 4.1 Global 3LCD Market, by Region
- 4.2 Global Digital Light Processing (DLP) Market, by Region
- 4.3 Global Liquid-Crystal-on-Silicon (LCoS) Market, by Region
Chapter 5. Global Interactive Projector Market, by Application
- 5.1 Global Education Market, by Region
- 5.2 Global Business Market, by Region
- 5.3 Global Healthcare Market, by Region
- 5.4 Global Others Market, by Region
Chapter 6. Global Interactive Projector Market, by Projection Distance
- 6.1 Global Ultra-short throw Market, by Region
- 6.2 Global Short throw Market, by Region
- 6.3 Global Standard throw Market, by Region
Chapter 7. Global Interactive Projector Market, by Region
- 7.1 North America Interactive Projector Market
- 7.1.1 North America Interactive Projector Market, by Technology
- 7.1.1.1 North America 3LCD Market, by Country
- 7.1.1.2 North America Digital Light Processing (DLP) Market, by Country
- 7.1.1.3 North America Liquid-Crystal-on-Silicon (LCoS) Market, by Country
- 7.1.2 North America Interactive Projector Market, by Application
- 7.1.2.1 North America Education Market, by Country
- 7.1.2.2 North America Business Market, by Country
- 7.1.2.3 North America Healthcare Market, by Country
- 7.1.2.4 North America Others Market, by Country
- 7.1.3 North America Interactive Projector Market, by Projection Distance
- 7.1.3.1 North America Ultra-short throw Market, by Country
- 7.1.3.2 North America Short throw Market, by Country
- 7.1.3.3 North America Standard throw Market, by Country
- 7.1.4 North America Interactive Projector Market, by Country
- 7.1.4.1 US Interactive Projector Market
- 7.1.4.1.1 US Interactive Projector Market, by Technology
- 7.1.4.1.2 US Interactive Projector Market, by Application
- 7.1.4.1.3 US Interactive Projector Market, by Projection Distance
- 7.1.4.2 Canada Interactive Projector Market
- 7.1.4.2.1 Canada Interactive Projector Market, by Technology
- 7.1.4.2.2 Canada Interactive Projector Market, by Application
- 7.1.4.2.3 Canada Interactive Projector Market, by Projection Distance
- 7.1.4.3 Mexico Interactive Projector Market
- 7.1.4.3.1 Mexico Interactive Projector Market, by Technology
- 7.1.4.3.2 Mexico Interactive Projector Market, by Application
- 7.1.4.3.3 Mexico Interactive Projector Market, by Projection Distance
- 7.1.4.4 Rest of North America Interactive Projector Market
- 7.1.4.4.1 Rest of North America Interactive Projector Market, by Technology
- 7.1.4.4.2 Rest of North America Interactive Projector Market, by Application
- 7.1.4.4.3 Rest of North America Interactive Projector Market, by Projection Distance
- 7.1.4.1 US Interactive Projector Market
- 7.1.1 North America Interactive Projector Market, by Technology
- 7.2 Europe Interactive Projector Market
- 7.2.1 Europe Interactive Projector Market, by Technology
- 7.2.1.1 Europe 3LCD Market, by Country
- 7.2.1.2 Europe Digital Light Processing (DLP) Market, by Country
- 7.2.1.3 Europe Liquid-Crystal-on-Silicon (LCoS) Market, by Country
- 7.2.2 Europe Interactive Projector Market, by Application
- 7.2.2.1 Europe Education Market, by Country
- 7.2.2.2 Europe Business Market, by Country
- 7.2.2.3 Europe Healthcare Market, by Country
- 7.2.2.4 Europe Others Market, by Country
- 7.2.3 Europe Interactive Projector Market, by Projection Distance
- 7.2.3.1 Europe Ultra-short throw Market, by Country
- 7.2.3.2 Europe Short throw Market, by Country
- 7.2.3.3 Europe Standard throw Market, by Country
- 7.2.4 Europe Interactive Projector Market, by Country
- 7.2.4.1 Germany Interactive Projector Market
- 7.2.4.1.1 Germany Interactive Projector Market, by Technology
- 7.2.4.1.2 Germany Interactive Projector Market, by Application
- 7.2.4.1.3 Germany Interactive Projector Market, by Projection Distance
- 7.2.4.2 UK Interactive Projector Market
- 7.2.4.2.1 UK Interactive Projector Market, by Technology
- 7.2.4.2.2 UK Interactive Projector Market, by Application
- 7.2.4.2.3 UK Interactive Projector Market, by Projection Distance
- 7.2.4.3 France Interactive Projector Market
- 7.2.4.3.1 France Interactive Projector Market, by Technology
- 7.2.4.3.2 France Interactive Projector Market, by Application
- 7.2.4.3.3 France Interactive Projector Market, by Projection Distance
- 7.2.4.4 Russia Interactive Projector Market
- 7.2.4.4.1 Russia Interactive Projector Market, by Technology
- 7.2.4.4.2 Russia Interactive Projector Market, by Application
- 7.2.4.4.3 Russia Interactive Projector Market, by Projection Distance
- 7.2.4.5 Spain Interactive Projector Market
- 7.2.4.5.1 Spain Interactive Projector Market, by Technology
- 7.2.4.5.2 Spain Interactive Projector Market, by Application
- 7.2.4.5.3 Spain Interactive Projector Market, by Projection Distance
- 7.2.4.6 Italy Interactive Projector Market
- 7.2.4.6.1 Italy Interactive Projector Market, by Technology
- 7.2.4.6.2 Italy Interactive Projector Market, by Application
- 7.2.4.6.3 Italy Interactive Projector Market, by Projection Distance
- 7.2.4.7 Rest of Europe Interactive Projector Market
- 7.2.4.7.1 Rest of Europe Interactive Projector Market, by Technology
- 7.2.4.7.2 Rest of Europe Interactive Projector Market, by Application
- 7.2.4.7.3 Rest of Europe Interactive Projector Market, by Projection Distance
- 7.2.4.1 Germany Interactive Projector Market
- 7.2.1 Europe Interactive Projector Market, by Technology
- 7.3 Asia Pacific Interactive Projector Market
- 7.3.1 Asia Pacific Interactive Projector Market, by Technology
- 7.3.1.1 Asia Pacific 3LCD Market, by Country
- 7.3.1.2 Asia Pacific Digital Light Processing (DLP) Market, by Country
- 7.3.1.3 Asia Pacific Liquid-Crystal-on-Silicon (LCoS) Market, by Country
- 7.3.2 Asia Pacific Interactive Projector Market, by Application
- 7.3.2.1 Asia Pacific Education Market, by Country
- 7.3.2.2 Asia Pacific Business Market, by Country
- 7.3.2.3 Asia Pacific Healthcare Market, by Country
- 7.3.2.4 Asia Pacific Others Market, by Country
- 7.3.3 Asia Pacific Interactive Projector Market, by Projection Distance
- 7.3.3.1 Asia Pacific Ultra-short throw Market, by Country
- 7.3.3.2 Asia Pacific Short throw Market, by Country
- 7.3.3.3 Asia Pacific Standard throw Market, by Country
- 7.3.4 Asia Pacific Interactive Projector Market, by Country
- 7.3.4.1 China Interactive Projector Market
- 7.3.4.1.1 China Interactive Projector Market, by Technology
- 7.3.4.1.2 China Interactive Projector Market, by Application
- 7.3.4.1.3 China Interactive Projector Market, by Projection Distance
- 7.3.4.2 Japan Interactive Projector Market
- 7.3.4.2.1 Japan Interactive Projector Market, by Technology
- 7.3.4.2.2 Japan Interactive Projector Market, by Application
- 7.3.4.2.3 Japan Interactive Projector Market, by Projection Distance
- 7.3.4.3 India Interactive Projector Market
- 7.3.4.3.1 India Interactive Projector Market, by Technology
- 7.3.4.3.2 India Interactive Projector Market, by Application
- 7.3.4.3.3 India Interactive Projector Market, by Projection Distance
- 7.3.4.4 South Korea Interactive Projector Market
- 7.3.4.4.1 South Korea Interactive Projector Market, by Technology
- 7.3.4.4.2 South Korea Interactive Projector Market, by Application
- 7.3.4.4.3 South Korea Interactive Projector Market, by Projection Distance
- 7.3.4.5 Singapore Interactive Projector Market
- 7.3.4.5.1 Singapore Interactive Projector Market, by Technology
- 7.3.4.5.2 Singapore Interactive Projector Market, by Application
- 7.3.4.5.3 Singapore Interactive Projector Market, by Projection Distance
- 7.3.4.6 Malaysia Interactive Projector Market
- 7.3.4.6.1 Malaysia Interactive Projector Market, by Technology
- 7.3.4.6.2 Malaysia Interactive Projector Market, by Application
- 7.3.4.6.3 Malaysia Interactive Projector Market, by Projection Distance
- 7.3.4.7 Rest of Asia Pacific Interactive Projector Market
- 7.3.4.7.1 Rest of Asia Pacific Interactive Projector Market, by Technology
- 7.3.4.7.2 Rest of Asia Pacific Interactive Projector Market, by Application
- 7.3.4.7.3 Rest of Asia Pacific Interactive Projector Market, by Projection Distance
- 7.3.4.1 China Interactive Projector Market
- 7.3.1 Asia Pacific Interactive Projector Market, by Technology
- 7.4 LAMEA Interactive Projector Market
- 7.4.1 LAMEA Interactive Projector Market, by Technology
- 7.4.1.1 LAMEA 3LCD Market, by Country
- 7.4.1.2 LAMEA Digital Light Processing (DLP) Market, by Country
- 7.4.1.3 LAMEA Liquid-Crystal-on-Silicon (LCoS) Market, by Country
- 7.4.2 LAMEA Interactive Projector Market, by Application
- 7.4.2.1 LAMEA Education Market, by Country
- 7.4.2.2 LAMEA Business Market, by Country
- 7.4.2.3 LAMEA Healthcare Market, by Country
- 7.4.2.4 LAMEA Others Market, by Country
- 7.4.3 LAMEA Interactive Projector Market, by Projection Distance
- 7.4.3.1 LAMEA Ultra-short throw Market, by Country
- 7.4.3.2 LAMEA Short throw Market, by Country
- 7.4.3.3 LAMEA Standard throw Market, by Country
- 7.4.4 LAMEA Interactive Projector Market, by Country
- 7.4.4.1 Brazil Interactive Projector Market
- 7.4.4.1.1 Brazil Interactive Projector Market, by Technology
- 7.4.4.1.2 Brazil Interactive Projector Market, by Application
- 7.4.4.1.3 Brazil Interactive Projector Market, by Projection Distance
- 7.4.4.2 Argentina Interactive Projector Market
- 7.4.4.2.1 Argentina Interactive Projector Market, by Technology
- 7.4.4.2.2 Argentina Interactive Projector Market, by Application
- 7.4.4.2.3 Argentina Interactive Projector Market, by Projection Distance
- 7.4.4.3 UAE Interactive Projector Market
- 7.4.4.3.1 UAE Interactive Projector Market, by Technology
- 7.4.4.3.2 UAE Interactive Projector Market, by Application
- 7.4.4.3.3 UAE Interactive Projector Market, by Projection Distance
- 7.4.4.4 Saudi Arabia Interactive Projector Market
- 7.4.4.4.1 Saudi Arabia Interactive Projector Market, by Technology
- 7.4.4.4.2 Saudi Arabia Interactive Projector Market, by Application
- 7.4.4.4.3 Saudi Arabia Interactive Projector Market, by Projection Distance
- 7.4.4.5 South Africa Interactive Projector Market
- 7.4.4.5.1 South Africa Interactive Projector Market, by Technology
- 7.4.4.5.2 South Africa Interactive Projector Market, by Application
- 7.4.4.5.3 South Africa Interactive Projector Market, by Projection Distance
- 7.4.4.6 Nigeria Interactive Projector Market
- 7.4.4.6.1 Nigeria Interactive Projector Market, by Technology
- 7.4.4.6.2 Nigeria Interactive Projector Market, by Application
- 7.4.4.6.3 Nigeria Interactive Projector Market, by Projection Distance
- 7.4.4.7 Rest of LAMEA Interactive Projector Market
- 7.4.4.7.1 Rest of LAMEA Interactive Projector Market, by Technology
- 7.4.4.7.2 Rest of LAMEA Interactive Projector Market, by Application
- 7.4.4.7.3 Rest of LAMEA Interactive Projector Market, by Projection Distance
- 7.4.4.1 Brazil Interactive Projector Market
- 7.4.1 LAMEA Interactive Projector Market, by Technology
Chapter 8. Company Profiles
- 8.1 Qisda Corporation (BenQ)
- 8.1.1 Company Overview
- 8.1.2 Financial Analysis
- 8.1.3 Segmental and Regional Analysis
- 8.1.4 Research & Development Expenses
- 8.1.5 Recent strategies and developments:
- 8.1.5.1 Product Launches and Product Expansions:
- 8.1.6 SWOT Analysis
- 8.2 Casio Computer Co., Ltd.
- 8.2.1 Company Overview
- 8.2.2 Financial Analysis
- 8.2.3 Segmental and Regional Analysis
- 8.2.4 Research & Development Expenses
- 8.3 Dell Technologies, Inc.
- 8.3.1 Company Overview
- 8.3.2 Financial Analysis
- 8.3.3 Segmental and Regional Analysis
- 8.3.4 Research & Development Expense
- 8.3.5 SWOT Analysis
- 8.4 Delta Electronics, Inc.
- 8.4.1 Company Overview
- 8.4.2 Financial Analysis
- 8.4.3 Research & Development Expense
- 8.4.4 SWOT Analysis
- 8.5 Boxlight Corporation
- 8.5.1 Company Overview
- 8.5.2 Financial Analysis
- 8.5.3 Research & Development Expenses
- 8.5.4 Recent strategies and developments:
- 8.5.4.1 Product Launches and Product Expansions:
- 8.5.4.2 Acquisition and Mergers:
- 8.6 Sharp NEC Display Solutions, Ltd. (Sharp Corporation)
- 8.6.1 Company Overview
- 8.6.2 Financial Analysis
- 8.6.3 Segmental and Regional Analysis
- 8.6.4 Research & Development Expenses
- 8.6.5 Recent strategies and developments:
- 8.6.5.1 Acquisition, Mergers and Joint Venture:
- 8.6.6 SWOT Analysis
- 8.7 Coretronic Corporation (Optoma Corporation)
- 8.7.1 Company Overview
- 8.7.2 Financial Analysis
- 8.7.3 Segmental and Regional Analysis
- 8.7.4 Research & Development Expenses
- 8.7.5 SWOT Analysis
- 8.8 Panasonic Holdings Corporation
- 8.8.1 Company Overview
- 8.8.2 Financial Analysis
- 8.8.3 Segmental and Regional Analysis
- 8.8.4 Research & Development Expenses
- 8.8.5 SWOT Analysis
- 8.9 Seiko Epson Corporation
- 8.9.1 Company Overview
- 8.9.2 Financial Analysis
- 8.9.3 Segmental and Regional Analysis
- 8.9.4 Research & Development Expenses
- 8.9.5 Recent strategies and developments:
- 8.9.5.1 Partnerships, Collaborations, and Agreements:
- 8.9.6 SWOT Analysis
- 8.10. Hitachi, Ltd.
- 8.10.1 Company Overview
- 8.10.2 Financial Analysis
- 8.10.3 Segmental and Regional Analysis
- 8.10.4 Research & Development Expenses
- 8.10.5 SWOT Analysis
