|
|
市場調査レポート
商品コード
1384967
紙コップの世界市場規模、シェア、産業動向分析レポート:エンドユーザー別、タイプ別、壁タイプ別、地域別展望と予測、2023年~2030年Global Paper Cups Market Size, Share & Industry Trends Analysis Report By End-User, By Type (Cold Paper Cups, and Hot Paper Cups), By Wall Type (Single Wall, and Multiple Wall), By Regional Outlook and Forecast, 2023 - 2030 |
||||||
|
|
|||||||
|
|||||||


| 紙コップの世界市場規模、シェア、産業動向分析レポート:エンドユーザー別、タイプ別、壁タイプ別、地域別展望と予測、2023年~2030年 |
|
出版日: 2023年10月31日
発行: KBV Research
ページ情報: 英文 291 Pages
納期: 即納可能
|

- 全表示
- 概要
- 図表
- 目次
紙コップの市場規模は、予測期間中にCAGR 3.8%で成長し、2030年には138億米ドルに達すると予測されます。2022年の市場規模は13億5,060万個で、成長率は4.0%(2019年~2022年)です。
しかし、使い捨てと再利用可能なプラスチックカップの両方が、これらのカップの一般的な代用品です。これらは軽量で耐久性があり、価格も手頃です。ガラスコップやマグカップは、紙コップの代替品として、特にフォーマルな場所や座敷でよく使われます。再利用が可能で耐久性があり、プラスチックごみを出さないです。陶器のカップは、店やカフェ、家庭でコーヒーやお茶を出すのによく使われます。審美的な魅力と、飲み物に与える味わいが好まれています。状況によっては、人々はカップを使うことを完全に忘れてしまうかもしれないです。そのため、代用品が入手可能になれば、市場の課題となりうる。
エンドユーザーの展望
エンドユーザー別では、家庭用、クイックサービスレストラン(QSR)、その他に分類されます。家庭用セグメントは2022年の市場で顕著な収益シェアを記録しました。紙コップは後片付けが簡単で食器を洗う手間が省けるため、パーティーや集まりでよく使われます。紙コップはさまざまな色やデザインがあり、さまざまなテーマや機会に適しています。人形やお面を作ったり、絵の具や接着剤などを入れる小さな容器を作ったりと、アートやクラフトのプロジェクトにも使えます。また、DIYのデコレーションにも使われます。パーティーや祝祭の動向の高まりと、家庭でのケータリングサービスの進化が、家庭での使い捨てテーブルの消費を支え、家庭用セグメントの成長を促進すると思われます。
タイプ別展望
タイプ別では、市場はホット紙コップとコールド紙コップに区分されます。ホット紙コップ市場は2022年に市場でかなりの収益シェアを獲得しました。ホット紙コップは、レギュラーコーヒー、エスプレッソ、カプチーノ、その他のコーヒー系飲料など、コーヒーを提供する際に最もよく使われます。ホット紙コップは、飲料の高温から利用者の手を保護するために断熱材が入っていることが多いです。ホット紙コップは、ブランディング、ロゴ、またはビジネスを促進したり、特別なイベントに個人的なタッチを追加するための装飾的なデザインでカスタマイズすることができます。使い捨てのプラスチックカップや発泡スチロールカップが環境に与える影響を軽減しながら、温かい飲み物を提供するための便利で衛生的、そして環境に優しいソリューションを提供します。
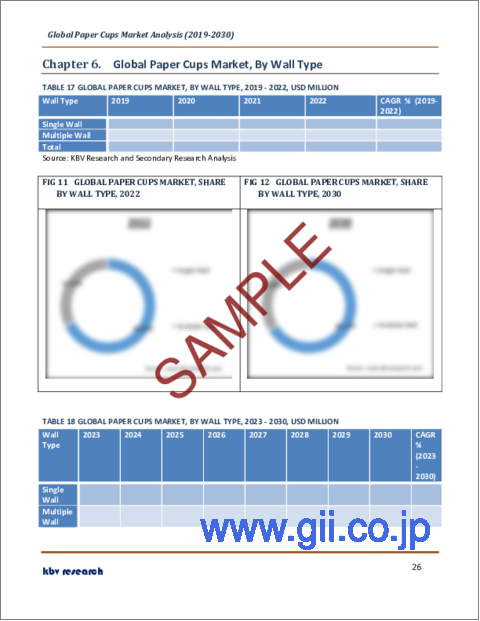
ウォールタイプ
ウォールタイプに基づき、市場はシングルウォールカップとマルチウォールカップに細分化されます。マルチウォールカップセグメントは2022年の市場で大きな収益シェアを獲得しました。多重壁紙コップは、断熱性に優れた紙の追加層で設計されています。この追加層は、熱い飲料を長時間保温するのに役立ち、カップの外面を接触冷媒に保ち、火傷のリスクを低下させる。この機能は、飲み物が冷めるのを待たずにすぐに飲みたいお客様には欠かせないものです。多重壁構造は、カップにさらなる強度と耐久性を与え、主に熱い飲み物に使用する場合に、変形や漏れを起こしにくくします。
地域別展望
地域別に見ると、市場は北米、欧州、アジア太平洋、ラテンアメリカ・中東・アフリカで分析されます。2022年には、北米地域が市場で最大の収益シェアを占めました。埋立地におけるプラスチック廃棄物の増加に関する政府の政策が有利なためです。例えば、カナダ環境大臣評議会(CCME)は、プラスチック廃棄物ゼロに関するカナダ全体の戦略を立ち上げ、政府はプラスチック廃棄物ゼロ実施計画の第1段階の発表に成功した(CCME、2019年)。したがって、この地域は今後も持続可能な解決策の実施に貢献し、地域市場の成長を後押しする可能性があります。
目次
第1章 市場範囲と調査手法
- 市場の定義
- 目的
- 市場範囲
- セグメンテーション
- 調査手法
第2章 市場の概要
- 主なハイライト
第3章 市場概要
- イントロダクション
- 概要
- 市場構成とシナリオ
- 概要
- 市場に影響を与える主な要因
- 市場促進要因
- 市場抑制要因
- ポーターファイブフォース分析
第4章 世界の紙コップ市場:エンドユーザー別
- 世界のクイックサービスレストラン(QSR)市場:地域別
- 世界の家庭市場:地域別
- 世界のその他の市場:地域別
第5章 世界の市場:タイプ別
- 世界のコールド紙カップ市場:地域別
- 世界のホット紙カップ市場:地域別
第6章 世界の市場:壁タイプ別
- 世界のシングルウォール市場:地域別
- 世界のマルチウォール市場:地域別
第7章 世界の市場:地域別
- 北米の市場
- 北米の市場:エンドユーザー別
- 北米の国別クイックサービスレストラン(QSR)市場
- 北米の国別家庭用市場
- その他の北米の国別市場
- 北米の市場:タイプ別
- 北米の国別コールド紙カップ市場
- 北米の国別ホット紙カップ市場
- 北米の市場:壁のタイプ別
- 北米の国別シングルウォール市場
- 北米の国別マルチウォール市場
- 北米の市場:国別
- 米国の紙コップ市場
- カナダの紙コップ市場
- メキシコの紙コップ市場
- その他の北米の市場
- 北米の市場:エンドユーザー別
- 欧州の市場
- 欧州の市場:エンドユーザー別
- 欧州の国別クイックサービスレストラン(QSR)市場
- 欧州の国別家庭用市場
- その他の欧州の国別市場
- 欧州の市場:タイプ別
- 欧州の国別コールド紙カップ市場
- 欧州の国別ホット紙カップ市場
- 欧州の市場:壁のタイプ別
- 欧州の国別シングルウォール市場
- 欧州の国別マルチウォール市場
- 欧州の市場:国別
- ドイツの紙コップ市場
- 英国の紙コップ市場
- フランスの紙コップ市場
- ロシアの紙コップ市場
- スペインの紙コップ市場
- イタリアの紙コップ市場
- その他の欧州の市場
- 欧州の市場:エンドユーザー別
- アジア太平洋の市場
- アジア太平洋の市場:エンドユーザー別
- アジア太平洋の国別クイックサービスレストラン(QSR)市場
- アジア太平洋の国別世帯市場
- アジア太平洋その他の国別市場
- アジア太平洋の市場:タイプ別
- アジア太平洋の国別コールド紙カップ市場
- アジア太平洋の国別ホット紙カップ市場
- アジア太平洋の市場:壁のタイプ別
- アジア太平洋の国別シングルウォール市場
- アジア太平洋の国別マルチウォール市場
- アジア太平洋の市場:国別
- 中国の紙コップ市場
- 日本の紙コップ市場
- インドの紙コップ市場
- 韓国の紙コップ市場
- シンガポールの紙コップ市場
- マレーシアの紙コップ市場
- その他のアジア太平洋の市場
- アジア太平洋の市場:エンドユーザー別
- ラテンアメリカ・中東・アフリカの市場
- ラテンアメリカ・中東・アフリカの市場:エンドユーザー別
- ラテンアメリカ・中東・アフリカの国別クイックサービスレストラン(QSR)市場
- ラテンアメリカ・中東・アフリカの国別家庭用市場
- ラテンアメリカ・中東・アフリカの国別その他市場
- ラテンアメリカ・中東・アフリカの市場:タイプ別
- ラテンアメリカ・中東・アフリカの国別コールド紙カップ市場
- ラテンアメリカ・中東・アフリカの国別ホット紙カップ市場
- ラテンアメリカ・中東・アフリカの市場:壁のタイプ別
- ラテンアメリカ・中東・アフリカの国別シングルウォール市場
- ラテンアメリカ・中東・アフリカの国別マルチウォール市場
- ラテンアメリカ・中東・アフリカの市場:国別
- ブラジルの紙コップ市場
- アルゼンチンの紙コップ市場
- アラブ首長国連邦の紙コップ市場
- サウジアラビアの紙コップ市場
- 南アフリカの紙コップ市場
- ナイジェリアの紙コップ市場
- その他のラテンアメリカ・中東・アフリカの市場
- ラテンアメリカ・中東・アフリカの市場:エンドユーザー別
第8章 企業プロファイル
- Georgia-Pacific LLC(Koch Industries, Inc)
- Printed Cup Company
- Pactiv Evergeen Inc
- Hotpack Packaging Industries LLC
- Konie Cups International, Inc
- Graphic Packaging Holding Company
- Dart Container Corporation(Aprinta Group)
- Genpak, LLC(Great Pacific Enterprises, Inc)
- Bender, Inc
- Huhtamaki Oyj
第9章 紙コップ市場の勝利の必須条件
LIST OF TABLES
- TABLE 1 Global Paper Cups Market, 2019 - 2022, USD Million
- TABLE 2 Global Paper Cups Market, 2023 - 2030, USD Million
- TABLE 3 Global Paper Cups Market, 2019 - 2022, Million Units (Pack of 100)
- TABLE 4 Global Paper Cups Market, 2023 - 2030, Million Units (Pack of 100)
- TABLE 5 Global Paper Cups Market, By End-User, 2019 - 2022, USD Million
- TABLE 6 Global Paper Cups Market, By End-User, 2023 - 2030, USD Million
- TABLE 7 Global Paper Cups Market, By End-User, 2019 - 2022, Million Units (Pack of 100)
- TABLE 8 Global Paper Cups Market, By End-User, 2023 - 2030, Million Units (Pack of 100)
- TABLE 9 Global Quick Service Restaurants (QSR) Market, By Region, 2019 - 2022, USD Million
- TABLE 10 Global Quick Service Restaurants (QSR) Market, By Region, 2023 - 2030, USD Million
- TABLE 11 Global Quick Service Restaurants (QSR) Market, By Region, 2019 - 2022, Million Units (Pack of 100)
- TABLE 12 Global Quick Service Restaurants (QSR) Market, By Region, 2023 - 2030, Million Units (Pack of 100)
- TABLE 13 Global Households Market, By Region, 2019 - 2022, USD Million
- TABLE 14 Global Households Market, By Region, 2023 - 2030, USD Million
- TABLE 15 Global Households Market, By Region, 2019 - 2022, Million Units (Pack of 100)
- TABLE 16 Global Households Market, By Region, 2023 - 2030, Million Units (Pack of 100)
- TABLE 17 Global Others Market, By Region, 2019 - 2022, USD Million
- TABLE 18 Global Others Market, By Region, 2023 - 2030, USD Million
- TABLE 19 Global Others Market, By Region, 2019 - 2022, Million Units (Pack of 100)
- TABLE 20 Global Others Market, By Region, 2023 - 2030, Million Units (Pack of 100)
- TABLE 21 Global Paper Cups Market, By Type, 2019 - 2022, USD Million
- TABLE 22 Global Paper Cups Market, By Type, 2023 - 2030, USD Million
- TABLE 23 Global Paper Cups Market, By Type, 2019 - 2022, Million Units (Pack of 100)
- TABLE 24 Global Paper Cups Market, By Type, 2023 - 2030, Million Units (Pack of 100)
- TABLE 25 Global Cold Paper Cups Market, By Region, 2019 - 2022, USD Million
- TABLE 26 Global Cold Paper Cups Market, By Region, 2023 - 2030, USD Million
- TABLE 27 Global Cold Paper Cups Market, By Region, 2019 - 2022, Million Units (Pack of 100)
- TABLE 28 Global Cold Paper Cups Market, By Region, 2023 - 2030, Million Units (Pack of 100)
- TABLE 29 Global Hot Paper Cups Market, By Region, 2019 - 2022, USD Million
- TABLE 30 Global Hot Paper Cups Market, By Region, 2023 - 2030, USD Million
- TABLE 31 Global Hot Paper Cups Market, By Region, 2019 - 2022, Million Units (Pack of 100)
- TABLE 32 Global Hot Paper Cups Market, By Region, 2023 - 2030, Million Units (Pack of 100)
- TABLE 33 Global Paper Cups Market, By Wall Type, 2019 - 2022, USD Million
- TABLE 34 Global Paper Cups Market, By Wall Type, 2023 - 2030, USD Million
- TABLE 35 Global Paper Cups Market, By Wall Type, 2019 - 2022, Million Units (Pack of 100)
- TABLE 36 Global Paper Cups Market, By Wall Type, 2023 - 2030, Million Units (Pack of 100)
- TABLE 37 Global Single Wall Market, By Region, 2019 - 2022, USD Million
- TABLE 38 Global Single Wall Market, By Region, 2023 - 2030, USD Million
- TABLE 39 Global Single Wall Market, By Region, 2019 - 2022, Million Units (Pack of 100)
- TABLE 40 Global Single Wall Market, By Region, 2023 - 2030, Million Units (Pack of 100)
- TABLE 41 Global Multiple Wall Market, By Region, 2019 - 2022, USD Million
- TABLE 42 Global Multiple Wall Market, By Region, 2023 - 2030, USD Million
- TABLE 43 Global Multiple Wall Market, By Region, 2019 - 2022, Million Units (Pack of 100)
- TABLE 44 Global Multiple Wall Market, By Region, 2023 - 2030, Million Units (Pack of 100)
- TABLE 45 Global Paper Cups Market, By Region, 2019 - 2022, USD Million
- TABLE 46 Global Paper Cups Market, By Region, 2023 - 2030, USD Million
- TABLE 47 Global Paper Cups Market, By Region, 2019 - 2022, Million Units (Pack of 100)
- TABLE 48 Global Paper Cups Market, By Region, 2023 - 2030, Million Units (Pack of 100)
- TABLE 49 North America Paper Cups Market, 2019 - 2022, USD Million
- TABLE 50 North America Paper Cups Market, 2023 - 2030, USD Million
- TABLE 51 North America Paper Cups Market, 2019 - 2022, Million Units (Pack of 100)
- TABLE 52 North America Paper Cups Market, 2023 - 2030, Million Units (Pack of 100)
- TABLE 53 North America Paper Cups Market, By End-User, 2019 - 2022, USD Million
- TABLE 54 North America Paper Cups Market, By End-User, 2023 - 2030, USD Million
- TABLE 55 North America Paper Cups Market, By End-User, 2019 - 2022, Million Units (Pack of 100)
- TABLE 56 North America Paper Cups Market, By End-User, 2023 - 2030, Million Units (Pack of 100)
- TABLE 57 North America Quick Service Restaurants (QSR) Market, By Country, 2019 - 2022, USD Million
- TABLE 58 North America Quick Service Restaurants (QSR) Market, By Country, 2023 - 2030, USD Million
- TABLE 59 North America Quick Service Restaurants (QSR) Market, By Country, 2019 - 2022, Million Units (Pack of 100)
- TABLE 60 North America Quick Service Restaurants (QSR) Market, By Country, 2023 - 2030, Million Units (Pack of 100)
- TABLE 61 North America Households Market, By Country, 2019 - 2022, USD Million
- TABLE 62 North America Households Market, By Country, 2023 - 2030, USD Million
- TABLE 63 North America Households Market, By Country, 2019 - 2022, Million Units (Pack of 100)
- TABLE 64 North America Households Market, By Country, 2023 - 2030, Million Units (Pack of 100)
- TABLE 65 North America Others Market, By Country, 2019 - 2022, USD Million
- TABLE 66 North America Others Market, By Country, 2023 - 2030, USD Million
- TABLE 67 North America Others Market, By Country, 2019 - 2022, Million Units (Pack of 100)
- TABLE 68 North America Others Market, By Country, 2023 - 2030, Million Units (Pack of 100)
- TABLE 69 North America Paper Cups Market, By Type, 2019 - 2022, USD Million
- TABLE 70 North America Paper Cups Market, By Type, 2023 - 2030, USD Million
- TABLE 71 North America Paper Cups Market, By Type, 2019 - 2022, Million Units (Pack of 100)
- TABLE 72 North America Paper Cups Market, By Type, 2023 - 2030, Million Units (Pack of 100)
- TABLE 73 North America Cold Paper Cups Market, By Country, 2019 - 2022, USD Million
- TABLE 74 North America Cold Paper Cups Market, By Country, 2023 - 2030, USD Million
- TABLE 75 North America Cold Paper Cups Market, By Country, 2019 - 2022, Million Units (Pack of 100)
- TABLE 76 North America Cold Paper Cups Market, By Country, 2023 - 2030, Million Units (Pack of 100)
- TABLE 77 North America Hot Paper Cups Market, By Country, 2019 - 2022, USD Million
- TABLE 78 North America Hot Paper Cups Market, By Country, 2023 - 2030, USD Million
- TABLE 79 North America Hot Paper Cups Market, By Country, 2019 - 2022, Million Units (Pack of 100)
- TABLE 80 North America Hot Paper Cups Market, By Country, 2023 - 2030, Million Units (Pack of 100)
- TABLE 81 North America Paper Cups Market, By Wall Type, 2019 - 2022, USD Million
- TABLE 82 North America Paper Cups Market, By Wall Type, 2023 - 2030, USD Million
- TABLE 83 North America Paper Cups Market, By Wall Type, 2019 - 2022, Million Units (Pack of 100)
- TABLE 84 North America Paper Cups Market, By Wall Type, 2023 - 2030, Million Units (Pack of 100)
- TABLE 85 North America Single Wall Market, By Country, 2019 - 2022, USD Million
- TABLE 86 North America Single Wall Market, By Country, 2023 - 2030, USD Million
- TABLE 87 North America Single Wall Market, By Country, 2019 - 2022, Million Units (Pack of 100)
- TABLE 88 North America Single Wall Market, By Country, 2023 - 2030, Million Units (Pack of 100)
- TABLE 89 North America Multiple Wall Market, By Country, 2019 - 2022, USD Million
- TABLE 90 North America Multiple Wall Market, By Country, 2023 - 2030, USD Million
- TABLE 91 North America Multiple Wall Market, By Country, 2019 - 2022, Million Units (Pack of 100)
- TABLE 92 North America Multiple Wall Market, By Country, 2023 - 2030, Million Units (Pack of 100)
- TABLE 93 North America Paper Cups Market, By Country, 2019 - 2022, USD Million
- TABLE 94 North America Paper Cups Market, By Country, 2023 - 2030, USD Million
- TABLE 95 North America Paper Cups Market, By Country, 2019 - 2022, Million Units (Pack of 100)
- TABLE 96 North America Paper Cups Market, By Country, 2023 - 2030, Million Units (Pack of 100)
- TABLE 97 US Paper Cups Market, 2019 - 2022, USD Million
- TABLE 98 US Paper Cups Market, 2023 - 2030, USD Million
- TABLE 99 US Paper Cups Market, 2019 - 2022, Million Units (Pack of 100)
- TABLE 100 US Paper Cups Market, 2023 - 2030, Million Units (Pack of 100)
- TABLE 101 US Paper Cups Market, By End-User, 2019 - 2022, USD Million
- TABLE 102 US Paper Cups Market, By End-User, 2023 - 2030, USD Million
- TABLE 103 US Paper Cups Market, By End-User, 2019 - 2022, Million Units (Pack of 100)
- TABLE 104 US Paper Cups Market, By End-User, 2023 - 2030, Million Units (Pack of 100)
- TABLE 105 US Paper Cups Market, By Type, 2019 - 2022, USD Million
- TABLE 106 US Paper Cups Market, By Type, 2023 - 2030, USD Million
- TABLE 107 US Paper Cups Market, By Type, 2019 - 2022, Million Units (Pack of 100)
- TABLE 108 US Paper Cups Market, By Type, 2023 - 2030, Million Units (Pack of 100)
- TABLE 109 US Paper Cups Market, By Wall Type, 2019 - 2022, USD Million
- TABLE 110 US Paper Cups Market, By Wall Type, 2023 - 2030, USD Million
- TABLE 111 US Paper Cups Market, By Wall Type, 2019 - 2022, Million Units (Pack of 100)
- TABLE 112 US Paper Cups Market, By Wall Type, 2023 - 2030, Million Units (Pack of 100)
- TABLE 113 Canada Paper Cups Market, 2019 - 2022, USD Million
- TABLE 114 Canada Paper Cups Market, 2023 - 2030, USD Million
- TABLE 115 Canada Paper Cups Market, 2019 - 2022, Million Units (Pack of 100)
- TABLE 116 Canada Paper Cups Market, 2023 - 2030, Million Units (Pack of 100)
- TABLE 117 Canada Paper Cups Market, By End-User, 2019 - 2022, USD Million
- TABLE 118 Canada Paper Cups Market, By End-User, 2023 - 2030, USD Million
- TABLE 119 Canada Paper Cups Market, By End-User, 2019 - 2022, Million Units (Pack of 100)
- TABLE 120 Canada Paper Cups Market, By End-User, 2023 - 2030, Million Units (Pack of 100)
- TABLE 121 Canada Paper Cups Market, By Type, 2019 - 2022, USD Million
- TABLE 122 Canada Paper Cups Market, By Type, 2023 - 2030, USD Million
- TABLE 123 Canada Paper Cups Market, By Type, 2019 - 2022, Million Units (Pack of 100)
- TABLE 124 Canada Paper Cups Market, By Type, 2023 - 2030, Million Units (Pack of 100)
- TABLE 125 Canada Paper Cups Market, By Wall Type, 2019 - 2022, USD Million
- TABLE 126 Canada Paper Cups Market, By Wall Type, 2023 - 2030, USD Million
- TABLE 127 Canada Paper Cups Market, By Wall Type, 2019 - 2022, Million Units (Pack of 100)
- TABLE 128 Canada Paper Cups Market, By Wall Type, 2023 - 2030, Million Units (Pack of 100)
- TABLE 129 Mexico Paper Cups Market, 2019 - 2022, USD Million
- TABLE 130 Mexico Paper Cups Market, 2023 - 2030, USD Million
- TABLE 131 Mexico Paper Cups Market, 2019 - 2022, Million Units (Pack of 100)
- TABLE 132 Mexico Paper Cups Market, 2023 - 2030, Million Units (Pack of 100)
- TABLE 133 Mexico Paper Cups Market, By End-User, 2019 - 2022, USD Million
- TABLE 134 Mexico Paper Cups Market, By End-User, 2023 - 2030, USD Million
- TABLE 135 Mexico Paper Cups Market, By End-User, 2019 - 2022, Million Units (Pack of 100)
- TABLE 136 Mexico Paper Cups Market, By End-User, 2023 - 2030, Million Units (Pack of 100)
- TABLE 137 Mexico Paper Cups Market, By Type, 2019 - 2022, USD Million
- TABLE 138 Mexico Paper Cups Market, By Type, 2023 - 2030, USD Million
- TABLE 139 Mexico Paper Cups Market, By Type, 2019 - 2022, Million Units (Pack of 100)
- TABLE 140 Mexico Paper Cups Market, By Type, 2023 - 2030, Million Units (Pack of 100)
- TABLE 141 Mexico Paper Cups Market, By Wall Type, 2019 - 2022, USD Million
- TABLE 142 Mexico Paper Cups Market, By Wall Type, 2023 - 2030, USD Million
- TABLE 143 Mexico Paper Cups Market, By Wall Type, 2019 - 2022, Million Units (Pack of 100)
- TABLE 144 Mexico Paper Cups Market, By Wall Type, 2023 - 2030, Million Units (Pack of 100)
- TABLE 145 Rest of North America Paper Cups Market, 2019 - 2022, USD Million
- TABLE 146 Rest of North America Paper Cups Market, 2023 - 2030, USD Million
- TABLE 147 Rest of North America Paper Cups Market, 2019 - 2022, Million Units (Pack of 100)
- TABLE 148 Rest of North America Paper Cups Market, 2023 - 2030, Million Units (Pack of 100)
- TABLE 149 Rest of North America Paper Cups Market, By End-User, 2019 - 2022, USD Million
- TABLE 150 Rest of North America Paper Cups Market, By End-User, 2023 - 2030, USD Million
- TABLE 151 Rest of North America Paper Cups Market, By End-User, 2019 - 2022, Million Units (Pack of 100)
- TABLE 152 Rest of North America Paper Cups Market, By End-User, 2023 - 2030, Million Units (Pack of 100)
- TABLE 153 Rest of North America Paper Cups Market, By Type, 2019 - 2022, USD Million
- TABLE 154 Rest of North America Paper Cups Market, By Type, 2023 - 2030, USD Million
- TABLE 155 Rest of North America Paper Cups Market, By Type, 2019 - 2022, Million Units (Pack of 100)
- TABLE 156 Rest of North America Paper Cups Market, By Type, 2023 - 2030, Million Units (Pack of 100)
- TABLE 157 Rest of North America Paper Cups Market, By Wall Type, 2019 - 2022, USD Million
- TABLE 158 Rest of North America Paper Cups Market, By Wall Type, 2023 - 2030, USD Million
- TABLE 159 Rest of North America Paper Cups Market, By Wall Type, 2019 - 2022, Million Units (Pack of 100)
- TABLE 160 Rest of North America Paper Cups Market, By Wall Type, 2023 - 2030, Million Units (Pack of 100)
- TABLE 161 Europe Paper Cups Market, 2019 - 2022, USD Million
- TABLE 162 Europe Paper Cups Market, 2023 - 2030, USD Million
- TABLE 163 Europe Paper Cups Market, 2019 - 2022, Million Units (Pack of 100)
- TABLE 164 Europe Paper Cups Market, 2023 - 2030, Million Units (Pack of 100)
- TABLE 165 Europe Paper Cups Market, By End-User, 2019 - 2022, USD Million
- TABLE 166 Europe Paper Cups Market, By End-User, 2023 - 2030, USD Million
- TABLE 167 Europe Paper Cups Market, By End-User, 2019 - 2022, Million Units (Pack of 100)
- TABLE 168 Europe Paper Cups Market, By End-User, 2023 - 2030, Million Units (Pack of 100)
- TABLE 169 Europe Quick Service Restaurants (QSR) Market, By Country, 2019 - 2022, USD Million
- TABLE 170 Europe Quick Service Restaurants (QSR) Market, By Country, 2023 - 2030, USD Million
- TABLE 171 Europe Quick Service Restaurants (QSR) Market, By Country, 2019 - 2022, Million Units (Pack of 100)
- TABLE 172 Europe Quick Service Restaurants (QSR) Market, By Country, 2023 - 2030, Million Units (Pack of 100)
- TABLE 173 Europe Households Market, By Country, 2019 - 2022, USD Million
- TABLE 174 Europe Households Market, By Country, 2023 - 2030, USD Million
- TABLE 175 Europe Households Market, By Country, 2019 - 2022, Million Units (Pack of 100)
- TABLE 176 Europe Households Market, By Country, 2023 - 2030, Million Units (Pack of 100)
- TABLE 177 Europe Others Market, By Country, 2019 - 2022, USD Million
- TABLE 178 Europe Others Market, By Country, 2023 - 2030, USD Million
- TABLE 179 Europe Others Market, By Country, 2019 - 2022, Million Units (Pack of 100)
- TABLE 180 Europe Others Market, By Country, 2023 - 2030, Million Units (Pack of 100)
- TABLE 181 Europe Paper Cups Market, By Type, 2019 - 2022, USD Million
- TABLE 182 Europe Paper Cups Market, By Type, 2023 - 2030, USD Million
- TABLE 183 Europe Paper Cups Market, By Type, 2019 - 2022, Million Units (Pack of 100)
- TABLE 184 Europe Paper Cups Market, By Type, 2023 - 2030, Million Units (Pack of 100)
- TABLE 185 Europe Cold Paper Cups Market, By Country, 2019 - 2022, USD Million
- TABLE 186 Europe Cold Paper Cups Market, By Country, 2023 - 2030, USD Million
- TABLE 187 Europe Cold Paper Cups Market, By Country, 2019 - 2022, Million Units (Pack of 100)
- TABLE 188 Europe Cold Paper Cups Market, By Country, 2023 - 2030, Million Units (Pack of 100)
- TABLE 189 Europe Hot Paper Cups Market, By Country, 2019 - 2022, USD Million
- TABLE 190 Europe Hot Paper Cups Market, By Country, 2023 - 2030, USD Million
- TABLE 191 Europe Hot Paper Cups Market, By Country, 2019 - 2022, Million Units (Pack of 100)
- TABLE 192 Europe Hot Paper Cups Market, By Country, 2023 - 2030, Million Units (Pack of 100)
- TABLE 193 Europe Paper Cups Market, By Wall Type, 2019 - 2022, USD Million
- TABLE 194 Europe Paper Cups Market, By Wall Type, 2023 - 2030, USD Million
- TABLE 195 Europe Paper Cups Market, By Wall Type, 2019 - 2022, Million Units (Pack of 100)
- TABLE 196 Europe Paper Cups Market, By Wall Type, 2023 - 2030, Million Units (Pack of 100)
- TABLE 197 Europe Single Wall Market, By Country, 2019 - 2022, USD Million
- TABLE 198 Europe Single Wall Market, By Country, 2023 - 2030, USD Million
- TABLE 199 Europe Single Wall Market, By Country, 2019 - 2022, Million Units (Pack of 100)
- TABLE 200 Europe Single Wall Market, By Country, 2023 - 2030, Million Units (Pack of 100)
- TABLE 201 Europe Multiple Wall Market, By Country, 2019 - 2022, USD Million
- TABLE 202 Europe Multiple Wall Market, By Country, 2023 - 2030, USD Million
- TABLE 203 Europe Multiple Wall Market, By Country, 2019 - 2022, Million Units (Pack of 100)
- TABLE 204 Europe Multiple Wall Market, By Country, 2023 - 2030, Million Units (Pack of 100)
- TABLE 205 Europe Paper Cups Market, By Country, 2019 - 2022, USD Million
- TABLE 206 Europe Paper Cups Market, By Country, 2023 - 2030, USD Million
- TABLE 207 Europe Paper Cups Market, By Country, 2019 - 2022, Million Units (Pack of 100)
- TABLE 208 Europe Paper Cups Market, By Country, 2023 - 2030, Million Units (Pack of 100)
- TABLE 209 Germany Paper Cups Market, 2019 - 2022, USD Million
- TABLE 210 Germany Paper Cups Market, 2023 - 2030, USD Million
- TABLE 211 Germany Paper Cups Market, 2019 - 2022, Million Units (Pack of 100)
- TABLE 212 Germany Paper Cups Market, 2023 - 2030, Million Units (Pack of 100)
- TABLE 213 Germany Paper Cups Market, By End-User, 2019 - 2022, USD Million
- TABLE 214 Germany Paper Cups Market, By End-User, 2023 - 2030, USD Million
- TABLE 215 Germany Paper Cups Market, By End-User, 2019 - 2022, Million Units (Pack of 100)
- TABLE 216 Germany Paper Cups Market, By End-User, 2023 - 2030, Million Units (Pack of 100)
- TABLE 217 Germany Paper Cups Market, By Type, 2019 - 2022, USD Million
- TABLE 218 Germany Paper Cups Market, By Type, 2023 - 2030, USD Million
- TABLE 219 Germany Paper Cups Market, By Type, 2019 - 2022, Million Units (Pack of 100)
- TABLE 220 Germany Paper Cups Market, By Type, 2023 - 2030, Million Units (Pack of 100)
- TABLE 221 Germany Paper Cups Market, By Wall Type, 2019 - 2022, USD Million
- TABLE 222 Germany Paper Cups Market, By Wall Type, 2023 - 2030, USD Million
- TABLE 223 Germany Paper Cups Market, By Wall Type, 2019 - 2022, Million Units (Pack of 100)
- TABLE 224 Germany Paper Cups Market, By Wall Type, 2023 - 2030, Million Units (Pack of 100)
- TABLE 225 UK Paper Cups Market, 2019 - 2022, USD Million
- TABLE 226 UK Paper Cups Market, 2023 - 2030, USD Million
- TABLE 227 UK Paper Cups Market, 2019 - 2022, Million Units (Pack of 100)
- TABLE 228 UK Paper Cups Market, 2023 - 2030, Million Units (Pack of 100)
- TABLE 229 UK Paper Cups Market, By End-User, 2019 - 2022, USD Million
- TABLE 230 UK Paper Cups Market, By End-User, 2023 - 2030, USD Million
- TABLE 231 UK Paper Cups Market, By End-User, 2019 - 2022, Million Units (Pack of 100)
- TABLE 232 UK Paper Cups Market, By End-User, 2023 - 2030, Million Units (Pack of 100)
- TABLE 233 UK Paper Cups Market, By Type, 2019 - 2022, USD Million
- TABLE 234 UK Paper Cups Market, By Type, 2023 - 2030, USD Million
- TABLE 235 UK Paper Cups Market, By Type, 2019 - 2022, Million Units (Pack of 100)
- TABLE 236 UK Paper Cups Market, By Type, 2023 - 2030, Million Units (Pack of 100)
- TABLE 237 UK Paper Cups Market, By Wall Type, 2019 - 2022, USD Million
- TABLE 238 UK Paper Cups Market, By Wall Type, 2023 - 2030, USD Million
- TABLE 239 UK Paper Cups Market, By Wall Type, 2019 - 2022, Million Units (Pack of 100)
- TABLE 240 UK Paper Cups Market, By Wall Type, 2023 - 2030, Million Units (Pack of 100)
- TABLE 241 France Paper Cups Market, 2019 - 2022, USD Million
- TABLE 242 France Paper Cups Market, 2023 - 2030, USD Million
- TABLE 243 France Paper Cups Market, 2019 - 2022, Million Units (Pack of 100)
- TABLE 244 France Paper Cups Market, 2023 - 2030, Million Units (Pack of 100)
- TABLE 245 France Paper Cups Market, By End-User, 2019 - 2022, USD Million
- TABLE 246 France Paper Cups Market, By End-User, 2023 - 2030, USD Million
- TABLE 247 France Paper Cups Market, By End-User, 2019 - 2022, Million Units (Pack of 100)
- TABLE 248 France Paper Cups Market, By End-User, 2023 - 2030, Million Units (Pack of 100)
- TABLE 249 France Paper Cups Market, By Type, 2019 - 2022, USD Million
- TABLE 250 France Paper Cups Market, By Type, 2023 - 2030, USD Million
- TABLE 251 France Paper Cups Market, By Type, 2019 - 2022, Million Units (Pack of 100)
- TABLE 252 France Paper Cups Market, By Type, 2023 - 2030, Million Units (Pack of 100)
- TABLE 253 France Paper Cups Market, By Wall Type, 2019 - 2022, USD Million
- TABLE 254 France Paper Cups Market, By Wall Type, 2023 - 2030, USD Million
- TABLE 255 France Paper Cups Market, By Wall Type, 2019 - 2022, Million Units (Pack of 100)
- TABLE 256 France Paper Cups Market, By Wall Type, 2023 - 2030, Million Units (Pack of 100)
- TABLE 257 Russia Paper Cups Market, 2019 - 2022, USD Million
- TABLE 258 Russia Paper Cups Market, 2023 - 2030, USD Million
- TABLE 259 Russia Paper Cups Market, 2019 - 2022, Million Units (Pack of 100)
- TABLE 260 Russia Paper Cups Market, 2023 - 2030, Million Units (Pack of 100)
- TABLE 261 Russia Paper Cups Market, By End-User, 2019 - 2022, USD Million
- TABLE 262 Russia Paper Cups Market, By End-User, 2023 - 2030, USD Million
- TABLE 263 Russia Paper Cups Market, By End-User, 2019 - 2022, Million Units (Pack of 100)
- TABLE 264 Russia Paper Cups Market, By End-User, 2023 - 2030, Million Units (Pack of 100)
- TABLE 265 Russia Paper Cups Market, By Type, 2019 - 2022, USD Million
- TABLE 266 Russia Paper Cups Market, By Type, 2023 - 2030, USD Million
- TABLE 267 Russia Paper Cups Market, By Type, 2019 - 2022, Million Units (Pack of 100)
- TABLE 268 Russia Paper Cups Market, By Type, 2023 - 2030, Million Units (Pack of 100)
- TABLE 269 Russia Paper Cups Market, By Wall Type, 2019 - 2022, USD Million
- TABLE 270 Russia Paper Cups Market, By Wall Type, 2023 - 2030, USD Million
- TABLE 271 Russia Paper Cups Market, By Wall Type, 2019 - 2022, Million Units (Pack of 100)
- TABLE 272 Russia Paper Cups Market, By Wall Type, 2023 - 2030, Million Units (Pack of 100)
- TABLE 273 Spain Paper Cups Market, 2019 - 2022, USD Million
- TABLE 274 Spain Paper Cups Market, 2023 - 2030, USD Million
- TABLE 275 Spain Paper Cups Market, 2019 - 2022, Million Units (Pack of 100)
- TABLE 276 Spain Paper Cups Market, 2023 - 2030, Million Units (Pack of 100)
- TABLE 277 Spain Paper Cups Market, By End-User, 2019 - 2022, USD Million
- TABLE 278 Spain Paper Cups Market, By End-User, 2023 - 2030, USD Million
- TABLE 279 Spain Paper Cups Market, By End-User, 2019 - 2022, Million Units (Pack of 100)
- TABLE 280 Spain Paper Cups Market, By End-User, 2023 - 2030, Million Units (Pack of 100)
- TABLE 281 Spain Paper Cups Market, By Type, 2019 - 2022, USD Million
- TABLE 282 Spain Paper Cups Market, By Type, 2023 - 2030, USD Million
- TABLE 283 Spain Paper Cups Market, By Type, 2019 - 2022, Million Units (Pack of 100)
- TABLE 284 Spain Paper Cups Market, By Type, 2023 - 2030, Million Units (Pack of 100)
- TABLE 285 Spain Paper Cups Market, By Wall Type, 2019 - 2022, USD Million
- TABLE 286 Spain Paper Cups Market, By Wall Type, 2023 - 2030, USD Million
- TABLE 287 Spain Paper Cups Market, By Wall Type, 2019 - 2022, Million Units (Pack of 100)
- TABLE 288 Spain Paper Cups Market, By Wall Type, 2023 - 2030, Million Units (Pack of 100)
- TABLE 289 Italy Paper Cups Market, 2019 - 2022, USD Million
- TABLE 290 Italy Paper Cups Market, 2023 - 2030, USD Million
- TABLE 291 Italy Paper Cups Market, 2019 - 2022, Million Units (Pack of 100)
- TABLE 292 Italy Paper Cups Market, 2023 - 2030, Million Units (Pack of 100)
- TABLE 293 Italy Paper Cups Market, By End-User, 2019 - 2022, USD Million
- TABLE 294 Italy Paper Cups Market, By End-User, 2023 - 2030, USD Million
- TABLE 295 Italy Paper Cups Market, By End-User, 2019 - 2022, Million Units (Pack of 100)
- TABLE 296 Italy Paper Cups Market, By End-User, 2023 - 2030, Million Units (Pack of 100)
- TABLE 297 Italy Paper Cups Market, By Type, 2019 - 2022, USD Million
- TABLE 298 Italy Paper Cups Market, By Type, 2023 - 2030, USD Million
- TABLE 299 Italy Paper Cups Market, By Type, 2019 - 2022, Million Units (Pack of 100)
- TABLE 300 Italy Paper Cups Market, By Type, 2023 - 2030, Million Units (Pack of 100)
- TABLE 301 Italy Paper Cups Market, By Wall Type, 2019 - 2022, USD Million
- TABLE 302 Italy Paper Cups Market, By Wall Type, 2023 - 2030, USD Million
- TABLE 303 Italy Paper Cups Market, By Wall Type, 2019 - 2022, Million Units (Pack of 100)
- TABLE 304 Italy Paper Cups Market, By Wall Type, 2023 - 2030, Million Units (Pack of 100)
- TABLE 305 Rest of Europe Paper Cups Market, 2019 - 2022, USD Million
- TABLE 306 Rest of Europe Paper Cups Market, 2023 - 2030, USD Million
- TABLE 307 Rest of Europe Paper Cups Market, 2019 - 2022, Million Units (Pack of 100)
- TABLE 308 Rest of Europe Paper Cups Market, 2023 - 2030, Million Units (Pack of 100)
- TABLE 309 Rest of Europe Paper Cups Market, By End-User, 2019 - 2022, USD Million
- TABLE 310 Rest of Europe Paper Cups Market, By End-User, 2023 - 2030, USD Million
- TABLE 311 Rest of Europe Paper Cups Market, By End-User, 2019 - 2022, Million Units (Pack of 100)
- TABLE 312 Rest of Europe Paper Cups Market, By End-User, 2023 - 2030, Million Units (Pack of 100)
- TABLE 313 Rest of Europe Paper Cups Market, By Type, 2019 - 2022, USD Million
- TABLE 314 Rest of Europe Paper Cups Market, By Type, 2023 - 2030, USD Million
- TABLE 315 Rest of Europe Paper Cups Market, By Type, 2019 - 2022, Million Units (Pack of 100)
- TABLE 316 Rest of Europe Paper Cups Market, By Type, 2023 - 2030, Million Units (Pack of 100)
- TABLE 317 Rest of Europe Paper Cups Market, By Wall Type, 2019 - 2022, USD Million
- TABLE 318 Rest of Europe Paper Cups Market, By Wall Type, 2023 - 2030, USD Million
- TABLE 319 Rest of Europe Paper Cups Market, By Wall Type, 2019 - 2022, Million Units (Pack of 100)
- TABLE 320 Rest of Europe Paper Cups Market, By Wall Type, 2023 - 2030, Million Units (Pack of 100)
The Global Paper Cups Market size is expected to reach $13.8 billion by 2030, rising at a market growth of 3.8% CAGR during the forecast period. In the year 2022, the market attained a volume of 1350.6 million units experiencing a growth of 4.0% (2019-2022).
The growing trend of on-the-go consumption, particularly in busy urban areas, fueled the demand for these cups in the Asia-Pacific region. Thus, the region would account for nearly 33% of the total market share by 2030. The convenience offered by paper cups aligns with the fast-paced lifestyles of consumers who prefer takeaway and delivery services. The region witnessed a significant expansion of the food service sector, including quick-service restaurants, cafes, and street food vendors. These establishments rely heavily on these cups for serving beverages and takeaways, driving the demand in the market. Some of the factors affecting the market are rising demand for eco-friendly and recycled paper-based disposable cups, growing coffee and tea consumption and availability of substitute products.
Increased awareness of environmental issues, including plastic pollution and climate change, has led to a greater emphasis on sustainability. Many consumers and businesses are looking for alternatives to traditional plastic cups. Paper-based cups can be recycled more easily than plastic cups. Also, some cups are made from recycled materials, contributing to waste reduction and resource conservation. Additionally, the global coffee culture has been expanding, with more people worldwide enjoying coffee as a daily beverage. Coffee shops, cafes, and specialty coffee businesses have increased, increasing demand for disposable cups. Coffee and tea are staples on the menus of quick-service restaurants (QSRs), and these establishments use these cups for efficient customer service. These cups serve coffee and tea at events, conferences, and catering services. The growing consumption of coffee and tea is expected to continue driving the demand for the market.
However, both single-use and reusable plastic cups are a common substitute for these cups. They are lightweight, durable, and affordable. Glass cups and mugs are often used as alternatives to paper cups, especially in more formal or sit-down settings. They are reusable, durable, and don't contribute to plastic waste. Ceramic cups are common for serving coffee and tea in shops, cafes, and at home. They are favored for their aesthetic appeal and the taste they impart to beverages. In some situations, people may choose to forget using cups altogether. Thus, the availability of substitute products can challenge the market.
End-User Outlook
By end user, the market is classified into households, quick service restaurants (QSR), and others. The households segment recorded a remarkable revenue share in the market in 2022. Paper cups are often used for parties and gatherings, as they simplify cleanup and reduce the need for washing dishes. They are available in various colors and designs, making them suitable for different themes and occasions. These cups can be used in arts and crafts projects, such as making puppets, masks, or small containers for paint, glue, or other materials. They are also used for creating DIY decorations. Growing party & festival celebration trends and evolving at-home food catering services will likely support the consumption of disposable tables among households and drive household segmental growth.
Type Outlook
On the basis of type, the market is segmented into hot paper cups and cold paper cups. The hot paper cups market acquired a substantial revenue share in the market in 2022. Hot paper cups are most commonly associated with serving coffee, whether it's regular coffee, espresso, cappuccino, or any other coffee-based beverage. Hot paper cups are often insulated to protect the user's hands from the high temperature of the beverage. Hot paper cups can be customized with branding, logos, or decorative designs to promote businesses or add a personal touch to special events. They offer a convenient, hygienic, and eco-friendly solution for serving hot beverages while reducing the environmental impact of single-use plastic or foam cups.
Wall Type
Based on wall type, the market is fragmented into single wall and multiple wall. The multiple wall cups segment garnered a significant revenue share in the market in 2022. Multiple wall paper cups are designed with an additional layer of paper, which provides superior insulation. This extra layer helps keep hot beverages hot for extended periods and keeps the cup's outer surface cool to the contact, lowering the risk of burns. This feature is essential for customers who prefer to consume their drinks immediately without waiting for them to cool down. The multiple wall construction provides additional strength and durability to the cup, making it less prone to deformation and leakage, primarily when used for hot beverages.
Regional Outlook
Region-wise, the market is analysed across North America, Europe, Asia Pacific, and LAMEA. In 2022, the North America region witnessed the largest revenue share in the market. Due to favorable government policies regarding the increasing plastic waste in landfills. For example, the Canadian Council of Ministers of the Environment (CCME) launched a Canada-wide strategy on zero plastic waste, and the government successfully released its first phase of the zero plastic waste implementation plans (CCME, 2019). Hence, the region may continue to contribute to implementing sustainable solutions along the way, thus boosting the regional market growth.
The market research report covers the analysis of key stake holders of the market. Key companies profiled in the report include Graphic Packaging Holding Company, Dart Container Corporation, Huhtamaki Oyj, Genpak LLC, Bender, Inc., Georgia-Pacific LLC (Koch Industries, Inc.), Printed Cup Company, Pactiv Evergeen Inc., Konie Cups International, Inc. and Hotpack Packaging Industries LLC
Scope of the Study
Market Segments covered in the Report:
By End-User (Volume, Million Units, USD Billion/Million, 2019 to 2030)
- Quick Service Restaurants (QSR)
- Households
- Others
By Type (Volume, Million Units, USD Billion/Million, 2019 to 2030)
- Cold Paper Cups
- Hot Paper Cups
By Wall Type (Volume, Million Units, USD Billion/Million, 2019 to 2030)
- Single Wall
- Multiple Wall
By Geography (Volume, Million Units, USD Billion/Million, 2019 to 2030)
- North America
- US
- Canada
- Mexico
- Rest of North America
- Europe
- Germany
- UK
- France
- Russia
- Spain
- Italy
- Rest of Europe
- Asia Pacific
- China
- Japan
- India
- South Korea
- Singapore
- Malaysia
- Rest of Asia Pacific
- LAMEA
- Brazil
- Argentina
- UAE
- Saudi Arabia
- South Africa
- Nigeria
- Rest of LAMEA
Companies Profiled
- Graphic Packaging Holding Company
- Dart Container Corporation
- Huhtamaki Oyj
- Genpak LLC
- Bender, Inc.
- Georgia-Pacific LLC (Koch Industries, Inc.)
- Printed Cup Company
- Pactiv Evergeen Inc.
- Konie Cups International, Inc.
- Hotpack Packaging Industries LLC
Unique Offerings from KBV Research
- Exhaustive coverage
- Highest number of market tables and figures
- Subscription based model available
- Guaranteed best price
- Assured post sales research support with 10% customization free
Table of Contents
Chapter 1. Market Scope & Methodology
- 1.1 Market Definition
- 1.2 Objectives
- 1.3 Market Scope
- 1.4 Segmentation
- 1.4.1 Global Paper Cups Market, by End-User
- 1.4.2 Global Paper Cups Market, by Type
- 1.4.3 Global Paper Cups Market, by Wall Type
- 1.4.4 Global Paper Cups Market, by Geography
- 1.5 Methodology for the research
Chapter 2. Market At a Glance
- 2.1 Key Highlights
Chapter 3. Market Overview
- 3.1 Introduction
- 3.1.1 Overview
- 3.1.1.1 Market Composition and Scenario
- 3.1.1 Overview
- 3.2 Key Factors Impacting the Market
- 3.2.1 Market Drivers
- 3.2.2 Market Restraints
- 3.3 Porter Five Forces Analysis
Chapter 4. Global Paper Cups Market, By End-User
- 4.1 Global Quick Service Restaurants (QSR) Market, By Region
- 4.2 Global Households Market, By Region
- 4.3 Global Others Market, By Region
Chapter 5. Global Paper Cups Market, By Type
- 5.1 Global Cold Paper Cups Market, By Region
- 5.2 Global Hot Paper Cups Market, By Region
Chapter 6. Global Paper Cups Market, By Wall Type
- 6.1 Global Single Wall Market, By Region
- 6.2 Global Multiple Wall Market, By Region
Chapter 7. Global Paper Cups Market, By Region
- 7.1 North America Paper Cups Market
- 7.1.1 North America Paper Cups Market, By End-User
- 7.1.1.1 North America Quick Service Restaurants (QSR) Market, By Country
- 7.1.1.2 North America Households Market, By Country
- 7.1.1.3 North America Others Market, By Country
- 7.1.2 North America Paper Cups Market, By Type
- 7.1.2.1 North America Cold Paper Cups Market, By Country
- 7.1.2.2 North America Hot Paper Cups Market, By Country
- 7.1.3 North America Paper Cups Market, By Wall Type
- 7.1.3.1 North America Single Wall Market, By Country
- 7.1.3.2 North America Multiple Wall Market, By Country
- 7.1.4 North America Paper Cups Market, By Country
- 7.1.4.1 US Paper Cups Market
- 7.1.4.1.1 US Paper Cups Market, By End-User
- 7.1.4.1.2 US Paper Cups Market, By Type
- 7.1.4.1.3 US Paper Cups Market, By Wall Type
- 7.1.4.2 Canada Paper Cups Market
- 7.1.4.2.1 Canada Paper Cups Market, By End-User
- 7.1.4.2.2 Canada Paper Cups Market, By Type
- 7.1.4.2.3 Canada Paper Cups Market, By Wall Type
- 7.1.4.3 Mexico Paper Cups Market
- 7.1.4.3.1 Mexico Paper Cups Market, By End-User
- 7.1.4.3.2 Mexico Paper Cups Market, By Type
- 7.1.4.3.3 Mexico Paper Cups Market, By Wall Type
- 7.1.4.4 Rest of North America Paper Cups Market
- 7.1.4.4.1 Rest of North America Paper Cups Market, By End-User
- 7.1.4.4.2 Rest of North America Paper Cups Market, By Type
- 7.1.4.4.3 Rest of North America Paper Cups Market, By Wall Type
- 7.1.4.1 US Paper Cups Market
- 7.1.1 North America Paper Cups Market, By End-User
- 7.2 Europe Paper Cups Market
- 7.2.1 Europe Paper Cups Market, By End-User
- 7.2.1.1 Europe Quick Service Restaurants (QSR) Market, By Country
- 7.2.1.2 Europe Households Market, By Country
- 7.2.1.3 Europe Others Market, By Country
- 7.2.2 Europe Paper Cups Market, By Type
- 7.2.2.1 Europe Cold Paper Cups Market, By Country
- 7.2.2.2 Europe Hot Paper Cups Market, By Country
- 7.2.3 Europe Paper Cups Market, By Wall Type
- 7.2.3.1 Europe Single Wall Market, By Country
- 7.2.3.2 Europe Multiple Wall Market, By Country
- 7.2.4 Europe Paper Cups Market, By Country
- 7.2.4.1 Germany Paper Cups Market
- 7.2.4.1.1 Germany Paper Cups Market, By End-User
- 7.2.4.1.2 Germany Paper Cups Market, By Type
- 7.2.4.1.3 Germany Paper Cups Market, By Wall Type
- 7.2.4.2 UK Paper Cups Market
- 7.2.4.2.1 UK Paper Cups Market, By End-User
- 7.2.4.2.2 UK Paper Cups Market, By Type
- 7.2.4.2.3 UK Paper Cups Market, By Wall Type
- 7.2.4.3 France Paper Cups Market
- 7.2.4.3.1 France Paper Cups Market, By End-User
- 7.2.4.3.2 France Paper Cups Market, By Type
- 7.2.4.3.3 France Paper Cups Market, By Wall Type
- 7.2.4.4 Russia Paper Cups Market
- 7.2.4.4.1 Russia Paper Cups Market, By End-User
- 7.2.4.4.2 Russia Paper Cups Market, By Type
- 7.2.4.4.3 Russia Paper Cups Market, By Wall Type
- 7.2.4.5 Spain Paper Cups Market
- 7.2.4.5.1 Spain Paper Cups Market, By End-User
- 7.2.4.5.2 Spain Paper Cups Market, By Type
- 7.2.4.5.3 Spain Paper Cups Market, By Wall Type
- 7.2.4.6 Italy Paper Cups Market
- 7.2.4.6.1 Italy Paper Cups Market, By End-User
- 7.2.4.6.2 Italy Paper Cups Market, By Type
- 7.2.4.6.3 Italy Paper Cups Market, By Wall Type
- 7.2.4.7 Rest of Europe Paper Cups Market
- 7.2.4.7.1 Rest of Europe Paper Cups Market, By End-User
- 7.2.4.7.2 Rest of Europe Paper Cups Market, By Type
- 7.2.4.7.3 Rest of Europe Paper Cups Market, By Wall Type
- 7.2.4.1 Germany Paper Cups Market
- 7.2.1 Europe Paper Cups Market, By End-User
- 7.3 Asia Pacific Paper Cups Market
- 7.3.1 Asia Pacific Paper Cups Market, By End-User
- 7.3.1.1 Asia Pacific Quick Service Restaurants (QSR) Market, By Country
- 7.3.1.2 Asia Pacific Households Market, By Country
- 7.3.1.3 Asia Pacific Others Market, By Country
- 7.3.2 Asia Pacific Paper Cups Market, By Type
- 7.3.2.1 Asia Pacific Cold Paper Cups Market, By Country
- 7.3.2.2 Asia Pacific Hot Paper Cups Market, By Country
- 7.3.3 Asia Pacific Paper Cups Market, By Wall Type
- 7.3.3.1 Asia Pacific Single Wall Market, By Country
- 7.3.3.2 Asia Pacific Multiple Wall Market, By Country
- 7.3.4 Asia Pacific Paper Cups Market, By Country
- 7.3.4.1 China Paper Cups Market
- 7.3.4.1.1 China Paper Cups Market, By End-User
- 7.3.4.1.2 China Paper Cups Market, By Type
- 7.3.4.1.3 China Paper Cups Market, By Wall Type
- 7.3.4.2 Japan Paper Cups Market
- 7.3.4.2.1 Japan Paper Cups Market, By End-User
- 7.3.4.2.2 Japan Paper Cups Market, By Type
- 7.3.4.2.3 Japan Paper Cups Market, By Wall Type
- 7.3.4.3 India Paper Cups Market
- 7.3.4.3.1 India Paper Cups Market, By End-User
- 7.3.4.3.2 India Paper Cups Market, By Type
- 7.3.4.3.3 India Paper Cups Market, By Wall Type
- 7.3.4.4 South Korea Paper Cups Market
- 7.3.4.4.1 South Korea Paper Cups Market, By End-User
- 7.3.4.4.2 South Korea Paper Cups Market, By Type
- 7.3.4.4.3 South Korea Paper Cups Market, By Wall Type
- 7.3.4.5 Singapore Paper Cups Market
- 7.3.4.5.1 Singapore Paper Cups Market, By End-User
- 7.3.4.5.2 Singapore Paper Cups Market, By Type
- 7.3.4.5.3 Singapore Paper Cups Market, By Wall Type
- 7.3.4.6 Malaysia Paper Cups Market
- 7.3.4.6.1 Malaysia Paper Cups Market, By End-User
- 7.3.4.6.2 Malaysia Paper Cups Market, By Type
- 7.3.4.6.3 Malaysia Paper Cups Market, By Wall Type
- 7.3.4.7 Rest of Asia Pacific Paper Cups Market
- 7.3.4.7.1 Rest of Asia Pacific Paper Cups Market, By End-User
- 7.3.4.7.2 Rest of Asia Pacific Paper Cups Market, By Type
- 7.3.4.7.3 Rest of Asia Pacific Paper Cups Market, By Wall Type
- 7.3.4.1 China Paper Cups Market
- 7.3.1 Asia Pacific Paper Cups Market, By End-User
- 7.4 LAMEA Paper Cups Market
- 7.4.1 LAMEA Paper Cups Market, By End-User
- 7.4.1.1 LAMEA Quick Service Restaurants (QSR) Market, By Country
- 7.4.1.2 LAMEA Households Market, By Country
- 7.4.1.3 LAMEA Others Market, By Country
- 7.4.2 LAMEA Paper Cups Market, By Type
- 7.4.2.1 LAMEA Cold Paper Cups Market, By Country
- 7.4.2.2 LAMEA Hot Paper Cups Market, By Country
- 7.4.3 LAMEA Paper Cups Market, By Wall Type
- 7.4.3.1 LAMEA Single Wall Market, By Country
- 7.4.3.2 LAMEA Multiple Wall Market, By Country
- 7.4.4 LAMEA Paper Cups Market, By Country
- 7.4.4.1 Brazil Paper Cups Market
- 7.4.4.1.1 Brazil Paper Cups Market, By End-User
- 7.4.4.1.2 Brazil Paper Cups Market, By Type
- 7.4.4.1.3 Brazil Paper Cups Market, By Wall Type
- 7.4.4.2 Argentina Paper Cups Market
- 7.4.4.2.1 Argentina Paper Cups Market, By End-User
- 7.4.4.2.2 Argentina Paper Cups Market, By Type
- 7.4.4.2.3 Argentina Paper Cups Market, By Wall Type
- 7.4.4.3 UAE Paper Cups Market
- 7.4.4.3.1 UAE Paper Cups Market, By End-User
- 7.4.4.3.2 UAE Paper Cups Market, By Type
- 7.4.4.3.3 UAE Paper Cups Market, By Wall Type
- 7.4.4.4 Saudi Arabia Paper Cups Market
- 7.4.4.4.1 Saudi Arabia Paper Cups Market, By End-User
- 7.4.4.4.2 Saudi Arabia Paper Cups Market, By Type
- 7.4.4.4.3 Saudi Arabia Paper Cups Market, By Wall Type
- 7.4.4.5 South Africa Paper Cups Market
- 7.4.4.5.1 South Africa Paper Cups Market, By End-User
- 7.4.4.5.2 South Africa Paper Cups Market, By Type
- 7.4.4.5.3 South Africa Paper Cups Market, By Wall Type
- 7.4.4.6 Nigeria Paper Cups Market
- 7.4.4.6.1 Nigeria Paper Cups Market, By End-User
- 7.4.4.6.2 Nigeria Paper Cups Market, By Type
- 7.4.4.6.3 Nigeria Paper Cups Market, By Wall Type
- 7.4.4.7 Rest of LAMEA Paper Cups Market
- 7.4.4.7.1 Rest of LAMEA Paper Cups Market, By End-User
- 7.4.4.7.2 Rest of LAMEA Paper Cups Market, By Type
- 7.4.4.7.3 Rest of LAMEA Paper Cups Market, By Wall Type
- 7.4.4.1 Brazil Paper Cups Market
- 7.4.1 LAMEA Paper Cups Market, By End-User
Chapter 8. Company Profiles
- 8.1 Georgia-Pacific LLC (Koch Industries, Inc.)
- 8.1.1 Company Overview
- 8.2 Printed Cup Company
- 8.2.1 Company Overview
- 8.3 Pactiv Evergeen Inc.
- 8.3.1 Company Overview
- 8.3.2 Financial Analysis
- 8.3.3 Segmental and Regional Analysis
- 8.3.4 Research & Development Expenses
- 8.4 Hotpack Packaging Industries LLC
- 8.4.1 Company Overview
- 8.5 Konie Cups International, Inc.
- 8.5.1 Company Overview
- 8.6 Graphic Packaging Holding Company
- 8.6.1 Company Overview
- 8.6.2 Financial Analysis
- 8.6.3 Segmental and Regional Analysis
- 8.6.4 Research & Development Expenses
- 8.6.5 Recent strategies and developments:
- 8.6.5.1 Partnerships, Collaborations, and Agreements:
- 8.6.5.2 Acquisition and Mergers:
- 8.6.6 SWOT Analysis
- 8.7 Dart Container Corporation (Aprinta Group)
- 8.7.1 Company Overview
- 8.7.2 SWOT Analysis
- 8.8 Genpak, LLC (Great Pacific Enterprises, Inc.)
- 8.8.1 Company Overview
- 8.9 Bender, Inc.
- 8.9.1 Company Overview
- 8.10. Huhtamaki Oyj
- 8.10.1 Company Overview
- 8.10.2 Financial Analysis
- 8.10.3 Segmental and Regional Analysis
- 8.10.4 Research & Development Expenses