|
|
市場調査レポート
商品コード
1374397
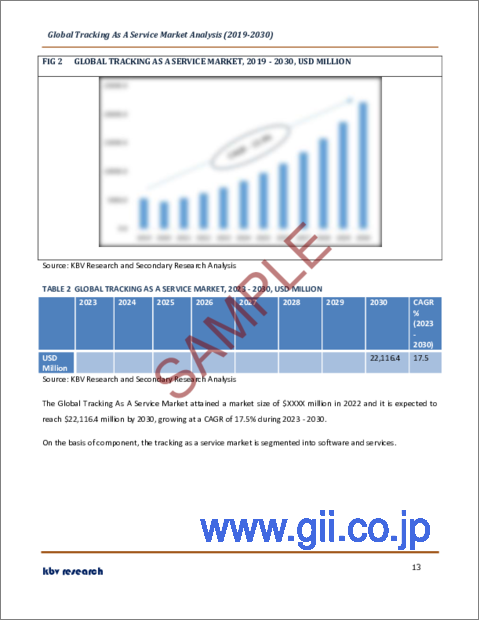
サービスとしてのトラッキングの世界市場規模、シェア、産業動向分析レポート:コンポーネント別、資産タイプ別、企業規模別、産業別、地域別展望と予測、2023年~2030年Global Tracking As A Service Market Size, Share & Industry Trends Analysis Report By Component (Software, and Services), By Asset Type, By Enterprise Size, By Industry, By Regional Outlook and Forecast, 2023 - 2030 |
||||||
|
|
|||||||
|
|||||||


| サービスとしてのトラッキングの世界市場規模、シェア、産業動向分析レポート:コンポーネント別、資産タイプ別、企業規模別、産業別、地域別展望と予測、2023年~2030年 |
|
出版日: 2023年09月30日
発行: KBV Research
ページ情報: 英文 300 Pages
納期: 即納可能
|

- 全表示
- 概要
- 図表
- 目次
サービスとしてのトラッキング市場規模は2030年までに221億米ドルに達すると予測され、予測期間中のCAGRは17.5%の市場成長率で上昇します。
しかし、位置情報や個人情報の収集に対する消費者の関心は高まっています。消費者は、プライバシーが侵害されるリスクを感じれば、追跡ソリューションの採用や情報の共有をためらうかもしれないです。このため、消費者向けアプリケーションにおけるTaaSの採用が遅れる可能性があります。セキュリティ侵害やデータ漏えいは、TaaSプロバイダーに深刻な結果をもたらす可能性があります。データ漏洩は、機密情報を漏洩させ、企業の評判を損ない、法的・金銭的負債をもたらす可能性があります。マッピングやジオロケーションを伴うアプリケーションでは、GIS(地理情報システム)を理解する地理空間専門家の存在が不可欠となります。以上のような要因が、市場の成長抑制につながる可能性があります。
コンポーネントの展望
コンポーネント別に見ると、市場はソフトウェアとサービスに区分されます。2022年の市場では、サービス分野が大きな収益シェアを獲得しました。プロフェッショナルサービスやマネージドサービスは、カスタマイズされたソリューションや導入支援を提供できることから拡大しています。これらのサービスは、カスタマイズ、シームレスな統合、追跡ソリューションの継続的な管理を提供することで、企業の複雑な要件に対応します。これらのサービスには、リスク軽減、コンプライアンス遵守、柔軟性が含まれ、モニタリングシステムが業界標準を遵守し、変動するビジネス要件に適応することを保証します。
資産タイプの展望
資産タイプ別では、電子機器・IT資産、輸送機器、製造資産、その他に分類されます。2022年には、製造資産セグメントが市場で最も高い収益シェアを記録しました。このセグメントの優位性は、重要な製造要件を満たす上で極めて重要な位置を占めていることに起因しています。これらのソリューションにより、製造業者は機械、設備、在庫をリアルタイムで可視化することで、リソース配分の最適化、予知保全によるダウンタイムの削減、サプライチェーン業務の迅速化を図ることができます。モニタリング技術の統合は、規制基準の遵守、データ主導の意思決定の改善、製品品質の維持においてメーカーを支援し、これらはすべて予測期間中に増加する見込みです。
企業規模の見通し
企業規模に基づき、市場は大企業と中小企業に細分化されます。中小企業セグメントは2022年に大きな収益シェアを獲得しました。中小企業は、多額の出費なしに高度な追跡技術へのアクセスを可能にする費用対効果の高さから、サービスとしての追跡ソフトウェアやサービスに魅力を感じています。中小企業の順応性の高さに従い、こうしたソリューションは業務効率とリソースの最適化も促進します。中小企業は追跡技術を活用することで、リアルタイムの最新情報を求める消費者の需要に応え、サプライチェーンの可視性を高め、リスクを軽減し、競争力を高めることができます。
産業別展望
産業別では、市場は輸送・物流、製造、ヘルスケア・ライフサイエンス、飲食品、小売、IT・通信、その他に分類されます。2022年には、製造業セグメントが市場で最大の収益シェアを占めました。このセグメントの発展は、機械から原材料に至るまで、製造資産のリアルタイム可視性を提供するサービス・ソリューションとしてのトラッキングに起因しています。これらのソリューションにより、製造業者は資産の利用率を最大化し、混乱を最小限に抑え、業務効率を高めることができます。モニタリング技術は、サプライチェーンの最適化を促進し、エンドツーエンドの可視化と情報に基づいた意思決定を可能にします。在庫量、ロケーション、回転率を監視する追跡サービスは、メーカーが最適な在庫レベルを維持するのに役立ちます。
地域別展望
地域別に見ると、市場は北米、欧州、アジア太平洋、LAMEAで分析されます。アジア太平洋地域は2022年の市場で大きな収益シェアを獲得しました。この地域の市場拡大は、eコマース活動の増加に起因しています。その結果、国全体のeコマースパターンの増加は、顧客の透明性を高めるために製品を追跡するトラッキングソリューションの受け入れを増加させました。複雑なサプライチェーン、製造の専門知識、加速する都市化を特徴とする環境では、サービスソリューションとしてのトラッキングは物流を簡素化し、サプライチェーンを最適化し、都市環境の持続可能性を促進します。
目次
第1章 市場範囲と調査手法
- 市場の定義
- 目的
- 市場範囲
- セグメンテーション
- 調査手法
第2章 市場の概要
- 主なハイライト
第3章 市場概要
- イントロダクション
- 概要
- 市場構成とシナリオ
- 概要
- 市場に影響を与える主な要因
- 市場促進要因
- 市場抑制要因
- ポーターのファイブフォース分析
第4章 サービスとしての世界の追跡市場:コンポーネント別
- 世界のソフトウェア市場:地域別
- 世界サービス市場:地域別
第5章 世界の市場:、資産タイプ別
- 世界の製造業資産市場:地域別
- 世界の輸送中機器市場:地域別
- 世界のエレクトロニクスおよびIT資産市場:地域別
- 世界のその他の資産タイプの市場:地域別
第6章 世界の市場:、企業規模別
- 世界の大企業市場:地域別
- 世界の中小企業市場:地域別
第7章 世界の市場:、業界別
- 世界の製造業市場:地域別
- 世界の輸送および物流市場:地域別
- 世界の飲食品市場:地域別
- 世界のヘルスケアおよびライフサイエンス市場:地域別
- 世界のITおよびテレコム市場:地域別
- 世界の小売市場:地域別
- 世界のその他の市場:地域別
第8章 世界の市場:、地域別
- 北米の市場
- 北米の市場:コンポーネント別
- 国別の北米ソフトウェア市場
- 国別の北米サービス市場
- 北米の市場:資産タイプ別
- 国別の北米製造業資産市場
- 北米の国別輸送機器市場
- 北米の国別エレクトロニクスおよびIT資産市場
- 北米の国別その他の資産タイプの市場
- 北米の市場:企業規模別
- 北米の国別大企業市場
- 北米の国別中小企業市場
- 北米の市場:業界別
- 国別の北米製造業市場
- 北米の国別輸送・物流市場
- 国別の北米飲食品市場
- 国別の北米ヘルスケアおよびライフサイエンス市場
- 国別の北米ITおよびテレコム市場
- 北米の国別小売市場
- 北米その他の国別市場
- 北米の市場:国別
- 米国のサービスとしての追跡市場
- カナダのサービスとしての追跡市場
- メキシコのサービスとしての追跡市場
- 残りの北米の市場
- 北米の市場:コンポーネント別
- 欧州の市場
- 欧州の市場:コンポーネント別
- 国別欧州ソフトウェア市場
- 国別の欧州サービス市場
- 欧州の市場:資産タイプ別
- 欧州の国別製造業資産市場
- 欧州の国別輸送機器市場
- 欧州の国別エレクトロニクスおよびIT資産市場
- 欧州の国別その他の資産タイプの市場
- 欧州の市場:企業規模別
- 欧州の国別大企業市場
- 国別の欧州中小企業市場
- 欧州の市場:業界別
- 欧州の国別製造業市場
- 国別の欧州の輸送および物流市場
- 欧州の国別飲食品市場
- 欧州の国別ヘルスケアおよびライフサイエンス市場
- 国別の欧州ITおよび通信市場
- 欧州の国別小売市場
- 欧州その他の国別市場
- 欧州の市場:国別
- ドイツのサービスとしての追跡市場
- 英国のサービスとしての追跡市場
- フランスのサービスとしての追跡市場
- ロシアのサービス市場としての追跡
- スペインのサービスとしての追跡市場
- イタリアのサービスとしての追跡市場
- 残りの欧州の市場
- 欧州の市場:コンポーネント別
- アジア太平洋の市場
- アジア太平洋の市場:コンポーネント別
- アジア太平洋地域の国別ソフトウェア市場
- アジア太平洋地域の国別サービス市場
- アジア太平洋の市場:資産タイプ別
- アジア太平洋地域の国別製造業資産市場
- アジア太平洋地域の国別輸送機器市場
- アジア太平洋地域の国別エレクトロニクスおよびIT資産市場
- アジア太平洋地域の国別その他の資産タイプの市場
- アジア太平洋の市場:企業規模別
- アジア太平洋地域の国別大企業市場
- アジア太平洋地域の国別中小企業市場
- アジア太平洋の市場:業界別
- アジア太平洋地域の国別製造業市場
- 国別のアジア太平洋輸送・物流市場
- アジア太平洋地域の国別飲食品市場
- アジア太平洋地域の国別ヘルスケアおよびライフサイエンス市場
- 国別のアジア太平洋ITおよび通信市場
- アジア太平洋地域の国別小売市場
- アジア太平洋地域その他の国別市場
- アジア太平洋の市場:国別
- 中国のサービス市場としての追跡
- 日本のトラッキング・アズ・ア・サービス市場
- インドのサービス市場としての追跡
- 韓国のサービス市場としての追跡
- シンガポールのサービスとしての追跡市場
- マレーシアのサービス市場としての追跡
- 残りのアジア太平洋の市場
- アジア太平洋の市場:コンポーネント別
- ラテンアメリカ・中東・アフリカの市場
- ラテンアメリカ・中東・アフリカの市場:コンポーネント別
- 国別のLAMEAソフトウェア市場
- 国別のLAMEAサービス市場
- ラテンアメリカ・中東・アフリカの市場:資産タイプ別
- 国別LAMEA製造業資産市場
- 国別LAMEA輸送中機器市場
- 国別のLAMEAエレクトロニクスおよびIT資産市場
- 国別のLAMEAその他の資産タイプの市場
- ラテンアメリカ・中東・アフリカの市場:企業規模別
- 国別LAMEA大企業市場
- 国別LAMEA中小企業市場
- ラテンアメリカ・中東・アフリカの市場:業界別
- 国別LAMEA製造市場
- 国別LAMEA輸送・物流市場
- 国別LAMEA飲食品市場
- 国別のLAMEAヘルスケアおよびライフサイエンス市場
- 国別のLAMEA ITおよびテレコム市場
- 国別LAMEA小売市場
- 国別LAMEAその他市場
- ラテンアメリカ・中東・アフリカの市場:国別
- ブラジルのサービスとしての追跡市場
- アルゼンチンのサービスとしての追跡市場
- UAEのトラッキング・アズ・ア・サービス市場
- サウジアラビアのサービス市場としての追跡
- 南アフリカのサービスとしての追跡市場
- ナイジェリアのサービスとしての追跡市場
- 残りのラテンアメリカ・中東・アフリカの市場
- ラテンアメリカ・中東・アフリカの市場:コンポーネント別
第9章 企業プロファイル
- Rockwell Automation, Inc
- Infor, Inc(Koch Industries)
- Midmark Corporation
- Sortly Inc
- EZO
- PCCW Limited
- MicroMain Corporation(JDM Technology Group Inc)
- Trimble, Inc
- Mojix, Inc(Peak Rock Capital)
- Finale Inventory, Inc
第10章 Tracking As A Service市場の勝利の必須条件
LIST OF TABLES
- TABLE 1 Global Tracking As A Service Market, 2019 - 2022, USD Million
- TABLE 2 Global Tracking As A Service Market, 2023 - 2030, USD Million
- TABLE 3 Global Tracking As A Service Market, By Component, 2019 - 2022, USD Million
- TABLE 4 Global Tracking As A Service Market, By Component, 2023 - 2030, USD Million
- TABLE 5 Global Software Market, By Region, 2019 - 2022, USD Million
- TABLE 6 Global Software Market, By Region, 2023 - 2030, USD Million
- TABLE 7 Global Services Market, By Region, 2019 - 2022, USD Million
- TABLE 8 Global Services Market, By Region, 2023 - 2030, USD Million
- TABLE 9 Global Tracking As A Service Market, By Asset Type, 2019 - 2022, USD Million
- TABLE 10 Global Tracking As A Service Market, By Asset Type, 2023 - 2030, USD Million
- TABLE 11 Global Manufacturing Assets Market, By Region, 2019 - 2022, USD Million
- TABLE 12 Global Manufacturing Assets Market, By Region, 2023 - 2030, USD Million
- TABLE 13 Global In-transit Equipment Market, By Region, 2019 - 2022, USD Million
- TABLE 14 Global In-transit Equipment Market, By Region, 2023 - 2030, USD Million
- TABLE 15 Global Electronics & IT Assets Market, By Region, 2019 - 2022, USD Million
- TABLE 16 Global Electronics & IT Assets Market, By Region, 2023 - 2030, USD Million
- TABLE 17 Global Other Asset Type Market, By Region, 2019 - 2022, USD Million
- TABLE 18 Global Other Asset Type Market, By Region, 2023 - 2030, USD Million
- TABLE 19 Global Tracking As A Service Market, By Enterprise Size, 2019 - 2022, USD Million
- TABLE 20 Global Tracking As A Service Market, By Enterprise Size, 2023 - 2030, USD Million
- TABLE 21 Global Large Enterprises Market, By Region, 2019 - 2022, USD Million
- TABLE 22 Global Large Enterprises Market, By Region, 2023 - 2030, USD Million
- TABLE 23 Global Small & Medium Enterprises Market, By Region, 2019 - 2022, USD Million
- TABLE 24 Global Small & Medium Enterprises Market, By Region, 2023 - 2030, USD Million
- TABLE 25 Global Tracking As A Service Market, By Industry, 2019 - 2022, USD Million
- TABLE 26 Global Tracking As A Service Market, By Industry, 2023 - 2030, USD Million
- TABLE 27 Global Manufacturing Market, By Region, 2019 - 2022, USD Million
- TABLE 28 Global Manufacturing Market, By Region, 2023 - 2030, USD Million
- TABLE 29 Global Transportation & Logistics Market, By Region, 2019 - 2022, USD Million
- TABLE 30 Global Transportation & Logistics Market, By Region, 2023 - 2030, USD Million
- TABLE 31 Global Food & Beverage Market, By Region, 2019 - 2022, USD Million
- TABLE 32 Global Food & Beverage Market, By Region, 2023 - 2030, USD Million
- TABLE 33 Global Healthcare & Lifesciences Market, By Region, 2019 - 2022, USD Million
- TABLE 34 Global Healthcare & Lifesciences Market, By Region, 2023 - 2030, USD Million
- TABLE 35 Global IT & Telecom Market, By Region, 2019 - 2022, USD Million
- TABLE 36 Global IT & Telecom Market, By Region, 2023 - 2030, USD Million
- TABLE 37 Global Retail Market, By Region, 2019 - 2022, USD Million
- TABLE 38 Global Retail Market, By Region, 2023 - 2030, USD Million
- TABLE 39 Global Others Market, By Region, 2019 - 2022, USD Million
- TABLE 40 Global Others Market, By Region, 2023 - 2030, USD Million
- TABLE 41 Global Tracking As A Service Market, By Region, 2019 - 2022, USD Million
- TABLE 42 Global Tracking As A Service Market, By Region, 2023 - 2030, USD Million
- TABLE 43 North America Tracking As A Service Market, 2019 - 2022, USD Million
- TABLE 44 North America Tracking As A Service Market, 2023 - 2030, USD Million
- TABLE 45 North America Tracking As A Service Market, By Component, 2019 - 2022, USD Million
- TABLE 46 North America Tracking As A Service Market, By Component, 2023 - 2030, USD Million
- TABLE 47 North America Software Market, By Country, 2019 - 2022, USD Million
- TABLE 48 North America Software Market, By Country, 2023 - 2030, USD Million
- TABLE 49 North America Services Market, By Country, 2019 - 2022, USD Million
- TABLE 50 North America Services Market, By Country, 2023 - 2030, USD Million
- TABLE 51 North America Tracking As A Service Market, By Asset Type, 2019 - 2022, USD Million
- TABLE 52 North America Tracking As A Service Market, By Asset Type, 2023 - 2030, USD Million
- TABLE 53 North America Manufacturing Assets Market, By Country, 2019 - 2022, USD Million
- TABLE 54 North America Manufacturing Assets Market, By Country, 2023 - 2030, USD Million
- TABLE 55 North America In-transit Equipment Market, By Country, 2019 - 2022, USD Million
- TABLE 56 North America In-transit Equipment Market, By Country, 2023 - 2030, USD Million
- TABLE 57 North America Electronics & IT Assets Market, By Country, 2019 - 2022, USD Million
- TABLE 58 North America Electronics & IT Assets Market, By Country, 2023 - 2030, USD Million
- TABLE 59 North America Other Asset Type Market, By Country, 2019 - 2022, USD Million
- TABLE 60 North America Other Asset Type Market, By Country, 2023 - 2030, USD Million
- TABLE 61 North America Tracking As A Service Market, By Enterprise Size, 2019 - 2022, USD Million
- TABLE 62 North America Tracking As A Service Market, By Enterprise Size, 2023 - 2030, USD Million
- TABLE 63 North America Large Enterprises Market, By Country, 2019 - 2022, USD Million
- TABLE 64 North America Large Enterprises Market, By Country, 2023 - 2030, USD Million
- TABLE 65 North America Small & Medium Enterprises Market, By Country, 2019 - 2022, USD Million
- TABLE 66 North America Small & Medium Enterprises Market, By Country, 2023 - 2030, USD Million
- TABLE 67 North America Tracking As A Service Market, By Industry, 2019 - 2022, USD Million
- TABLE 68 North America Tracking As A Service Market, By Industry, 2023 - 2030, USD Million
- TABLE 69 North America Manufacturing Market, By Country, 2019 - 2022, USD Million
- TABLE 70 North America Manufacturing Market, By Country, 2023 - 2030, USD Million
- TABLE 71 North America Transportation & Logistics Market, By Country, 2019 - 2022, USD Million
- TABLE 72 North America Transportation & Logistics Market, By Country, 2023 - 2030, USD Million
- TABLE 73 North America Food & Beverage Market, By Country, 2019 - 2022, USD Million
- TABLE 74 North America Food & Beverage Market, By Country, 2023 - 2030, USD Million
- TABLE 75 North America Healthcare & Lifesciences Market, By Country, 2019 - 2022, USD Million
- TABLE 76 North America Healthcare & Lifesciences Market, By Country, 2023 - 2030, USD Million
- TABLE 77 North America IT & Telecom Market, By Country, 2019 - 2022, USD Million
- TABLE 78 North America IT & Telecom Market, By Country, 2023 - 2030, USD Million
- TABLE 79 North America Retail Market, By Country, 2019 - 2022, USD Million
- TABLE 80 North America Retail Market, By Country, 2023 - 2030, USD Million
- TABLE 81 North America Others Market, By Country, 2019 - 2022, USD Million
- TABLE 82 North America Others Market, By Country, 2023 - 2030, USD Million
- TABLE 83 North America Tracking As A Service Market, By Country, 2019 - 2022, USD Million
- TABLE 84 North America Tracking As A Service Market, By Country, 2023 - 2030, USD Million
- TABLE 85 US Tracking As A Service Market, 2019 - 2022, USD Million
- TABLE 86 US Tracking As A Service Market, 2023 - 2030, USD Million
- TABLE 87 US Tracking As A Service Market, By Component, 2019 - 2022, USD Million
- TABLE 88 US Tracking As A Service Market, By Component, 2023 - 2030, USD Million
- TABLE 89 US Tracking As A Service Market, By Asset Type, 2019 - 2022, USD Million
- TABLE 90 US Tracking As A Service Market, By Asset Type, 2023 - 2030, USD Million
- TABLE 91 US Tracking As A Service Market, By Enterprise Size, 2019 - 2022, USD Million
- TABLE 92 US Tracking As A Service Market, By Enterprise Size, 2023 - 2030, USD Million
- TABLE 93 US Tracking As A Service Market, By Industry, 2019 - 2022, USD Million
- TABLE 94 US Tracking As A Service Market, By Industry, 2023 - 2030, USD Million
- TABLE 95 Canada Tracking As A Service Market, 2019 - 2022, USD Million
- TABLE 96 Canada Tracking As A Service Market, 2023 - 2030, USD Million
- TABLE 97 Canada Tracking As A Service Market, By Component, 2019 - 2022, USD Million
- TABLE 98 Canada Tracking As A Service Market, By Component, 2023 - 2030, USD Million
- TABLE 99 Canada Tracking As A Service Market, By Asset Type, 2019 - 2022, USD Million
- TABLE 100 Canada Tracking As A Service Market, By Asset Type, 2023 - 2030, USD Million
- TABLE 101 Canada Tracking As A Service Market, By Enterprise Size, 2019 - 2022, USD Million
- TABLE 102 Canada Tracking As A Service Market, By Enterprise Size, 2023 - 2030, USD Million
- TABLE 103 Canada Tracking As A Service Market, By Industry, 2019 - 2022, USD Million
- TABLE 104 Canada Tracking As A Service Market, By Industry, 2023 - 2030, USD Million
- TABLE 105 Mexico Tracking As A Service Market, 2019 - 2022, USD Million
- TABLE 106 Mexico Tracking As A Service Market, 2023 - 2030, USD Million
- TABLE 107 Mexico Tracking As A Service Market, By Component, 2019 - 2022, USD Million
- TABLE 108 Mexico Tracking As A Service Market, By Component, 2023 - 2030, USD Million
- TABLE 109 Mexico Tracking As A Service Market, By Asset Type, 2019 - 2022, USD Million
- TABLE 110 Mexico Tracking As A Service Market, By Asset Type, 2023 - 2030, USD Million
- TABLE 111 Mexico Tracking As A Service Market, By Enterprise Size, 2019 - 2022, USD Million
- TABLE 112 Mexico Tracking As A Service Market, By Enterprise Size, 2023 - 2030, USD Million
- TABLE 113 Mexico Tracking As A Service Market, By Industry, 2019 - 2022, USD Million
- TABLE 114 Mexico Tracking As A Service Market, By Industry, 2023 - 2030, USD Million
- TABLE 115 Rest of North America Tracking As A Service Market, 2019 - 2022, USD Million
- TABLE 116 Rest of North America Tracking As A Service Market, 2023 - 2030, USD Million
- TABLE 117 Rest of North America Tracking As A Service Market, By Component, 2019 - 2022, USD Million
- TABLE 118 Rest of North America Tracking As A Service Market, By Component, 2023 - 2030, USD Million
- TABLE 119 Rest of North America Tracking As A Service Market, By Asset Type, 2019 - 2022, USD Million
- TABLE 120 Rest of North America Tracking As A Service Market, By Asset Type, 2023 - 2030, USD Million
- TABLE 121 Rest of North America Tracking As A Service Market, By Enterprise Size, 2019 - 2022, USD Million
- TABLE 122 Rest of North America Tracking As A Service Market, By Enterprise Size, 2023 - 2030, USD Million
- TABLE 123 Rest of North America Tracking As A Service Market, By Industry, 2019 - 2022, USD Million
- TABLE 124 Rest of North America Tracking As A Service Market, By Industry, 2023 - 2030, USD Million
- TABLE 125 Europe Tracking As A Service Market, 2019 - 2022, USD Million
- TABLE 126 Europe Tracking As A Service Market, 2023 - 2030, USD Million
- TABLE 127 Europe Tracking As A Service Market, By Component, 2019 - 2022, USD Million
- TABLE 128 Europe Tracking As A Service Market, By Component, 2023 - 2030, USD Million
- TABLE 129 Europe Software Market, By Country, 2019 - 2022, USD Million
- TABLE 130 Europe Software Market, By Country, 2023 - 2030, USD Million
- TABLE 131 Europe Services Market, By Country, 2019 - 2022, USD Million
- TABLE 132 Europe Services Market, By Country, 2023 - 2030, USD Million
- TABLE 133 Europe Tracking As A Service Market, By Asset Type, 2019 - 2022, USD Million
- TABLE 134 Europe Tracking As A Service Market, By Asset Type, 2023 - 2030, USD Million
- TABLE 135 Europe Manufacturing Assets Market, By Country, 2019 - 2022, USD Million
- TABLE 136 Europe Manufacturing Assets Market, By Country, 2023 - 2030, USD Million
- TABLE 137 Europe In-transit Equipment Market, By Country, 2019 - 2022, USD Million
- TABLE 138 Europe In-transit Equipment Market, By Country, 2023 - 2030, USD Million
- TABLE 139 Europe Electronics & IT Assets Market, By Country, 2019 - 2022, USD Million
- TABLE 140 Europe Electronics & IT Assets Market, By Country, 2023 - 2030, USD Million
- TABLE 141 Europe Other Asset Type Market, By Country, 2019 - 2022, USD Million
- TABLE 142 Europe Other Asset Type Market, By Country, 2023 - 2030, USD Million
- TABLE 143 Europe Tracking As A Service Market, By Enterprise Size, 2019 - 2022, USD Million
- TABLE 144 Europe Tracking As A Service Market, By Enterprise Size, 2023 - 2030, USD Million
- TABLE 145 Europe Large Enterprises Market, By Country, 2019 - 2022, USD Million
- TABLE 146 Europe Large Enterprises Market, By Country, 2023 - 2030, USD Million
- TABLE 147 Europe Small & Medium Enterprises Market, By Country, 2019 - 2022, USD Million
- TABLE 148 Europe Small & Medium Enterprises Market, By Country, 2023 - 2030, USD Million
- TABLE 149 Europe Tracking As A Service Market, By Industry, 2019 - 2022, USD Million
- TABLE 150 Europe Tracking As A Service Market, By Industry, 2023 - 2030, USD Million
- TABLE 151 Europe Manufacturing Market, By Country, 2019 - 2022, USD Million
- TABLE 152 Europe Manufacturing Market, By Country, 2023 - 2030, USD Million
- TABLE 153 Europe Transportation & Logistics Market, By Country, 2019 - 2022, USD Million
- TABLE 154 Europe Transportation & Logistics Market, By Country, 2023 - 2030, USD Million
- TABLE 155 Europe Food & Beverage Market, By Country, 2019 - 2022, USD Million
- TABLE 156 Europe Food & Beverage Market, By Country, 2023 - 2030, USD Million
- TABLE 157 Europe Healthcare & Lifesciences Market, By Country, 2019 - 2022, USD Million
- TABLE 158 Europe Healthcare & Lifesciences Market, By Country, 2023 - 2030, USD Million
- TABLE 159 Europe IT & Telecom Market, By Country, 2019 - 2022, USD Million
- TABLE 160 Europe IT & Telecom Market, By Country, 2023 - 2030, USD Million
- TABLE 161 Europe Retail Market, By Country, 2019 - 2022, USD Million
- TABLE 162 Europe Retail Market, By Country, 2023 - 2030, USD Million
- TABLE 163 Europe Others Market, By Country, 2019 - 2022, USD Million
- TABLE 164 Europe Others Market, By Country, 2023 - 2030, USD Million
- TABLE 165 Europe Tracking As A Service Market, By Country, 2019 - 2022, USD Million
- TABLE 166 Europe Tracking As A Service Market, By Country, 2023 - 2030, USD Million
- TABLE 167 Germany Tracking As A Service Market, 2019 - 2022, USD Million
- TABLE 168 Germany Tracking As A Service Market, 2023 - 2030, USD Million
- TABLE 169 Germany Tracking As A Service Market, By Component, 2019 - 2022, USD Million
- TABLE 170 Germany Tracking As A Service Market, By Component, 2023 - 2030, USD Million
- TABLE 171 Germany Tracking As A Service Market, By Asset Type, 2019 - 2022, USD Million
- TABLE 172 Germany Tracking As A Service Market, By Asset Type, 2023 - 2030, USD Million
- TABLE 173 Germany Tracking As A Service Market, By Enterprise Size, 2019 - 2022, USD Million
- TABLE 174 Germany Tracking As A Service Market, By Enterprise Size, 2023 - 2030, USD Million
- TABLE 175 Germany Tracking As A Service Market, By Industry, 2019 - 2022, USD Million
- TABLE 176 Germany Tracking As A Service Market, By Industry, 2023 - 2030, USD Million
- TABLE 177 UK Tracking As A Service Market, 2019 - 2022, USD Million
- TABLE 178 UK Tracking As A Service Market, 2023 - 2030, USD Million
- TABLE 179 UK Tracking As A Service Market, By Component, 2019 - 2022, USD Million
- TABLE 180 UK Tracking As A Service Market, By Component, 2023 - 2030, USD Million
- TABLE 181 UK Tracking As A Service Market, By Asset Type, 2019 - 2022, USD Million
- TABLE 182 UK Tracking As A Service Market, By Asset Type, 2023 - 2030, USD Million
- TABLE 183 UK Tracking As A Service Market, By Enterprise Size, 2019 - 2022, USD Million
- TABLE 184 UK Tracking As A Service Market, By Enterprise Size, 2023 - 2030, USD Million
- TABLE 185 UK Tracking As A Service Market, By Industry, 2019 - 2022, USD Million
- TABLE 186 UK Tracking As A Service Market, By Industry, 2023 - 2030, USD Million
- TABLE 187 France Tracking As A Service Market, 2019 - 2022, USD Million
- TABLE 188 France Tracking As A Service Market, 2023 - 2030, USD Million
- TABLE 189 France Tracking As A Service Market, By Component, 2019 - 2022, USD Million
- TABLE 190 France Tracking As A Service Market, By Component, 2023 - 2030, USD Million
- TABLE 191 France Tracking As A Service Market, By Asset Type, 2019 - 2022, USD Million
- TABLE 192 France Tracking As A Service Market, By Asset Type, 2023 - 2030, USD Million
- TABLE 193 France Tracking As A Service Market, By Enterprise Size, 2019 - 2022, USD Million
- TABLE 194 France Tracking As A Service Market, By Enterprise Size, 2023 - 2030, USD Million
- TABLE 195 France Tracking As A Service Market, By Industry, 2019 - 2022, USD Million
- TABLE 196 France Tracking As A Service Market, By Industry, 2023 - 2030, USD Million
- TABLE 197 Russia Tracking As A Service Market, 2019 - 2022, USD Million
- TABLE 198 Russia Tracking As A Service Market, 2023 - 2030, USD Million
- TABLE 199 Russia Tracking As A Service Market, By Component, 2019 - 2022, USD Million
- TABLE 200 Russia Tracking As A Service Market, By Component, 2023 - 2030, USD Million
- TABLE 201 Russia Tracking As A Service Market, By Asset Type, 2019 - 2022, USD Million
- TABLE 202 Russia Tracking As A Service Market, By Asset Type, 2023 - 2030, USD Million
- TABLE 203 Russia Tracking As A Service Market, By Enterprise Size, 2019 - 2022, USD Million
- TABLE 204 Russia Tracking As A Service Market, By Enterprise Size, 2023 - 2030, USD Million
- TABLE 205 Russia Tracking As A Service Market, By Industry, 2019 - 2022, USD Million
- TABLE 206 Russia Tracking As A Service Market, By Industry, 2023 - 2030, USD Million
- TABLE 207 Spain Tracking As A Service Market, 2019 - 2022, USD Million
- TABLE 208 Spain Tracking As A Service Market, 2023 - 2030, USD Million
- TABLE 209 Spain Tracking As A Service
The Global Tracking As A Service Market size is expected to reach $22.1billion by 2030, rising at a market growth of 17.5% CAGR during the forecast period.
TaaS enables end-to-end traceability of food products from farm to table. This is crucial for food safety, quality control, and compliance with regulatory requirements. TaaS solutions can track and monitor temperature-sensitive products during transportation and storage. Consequently, the food and beverage segment would generate approximately 14.8% share of the market by 2030. TaaS solutions can track and monitor temperature-sensitive products during transportation and storage. This ensures that perishable goods, such as fresh produce, dairy, and meat, remain within safe temperatures to prevent spoilage and maintain quality. Some of the factors affecting the market are rising digitalization across the logistics industry, increase in penetration of internet of thing, and increasing privacy and security concerns.
The logistics sector has undergone significant transformation, driven by technological advancements and a growing need for efficiency, visibility, and cost-effectiveness. Digitalization has enabled logistics companies to gain real-time visibility into their supply chains. With the integration of sensors, GPS technology, and IoT devices, they can track the location and condition of goods, vehicles, and assets at all stages of the logistics process. Customers now expect transparency and real-time updates on the status of their shipments. Moreover, the rise in the penetration of the Internet of Things has significantly impacted the growth of the market. IoT has provided the necessary technological foundation for tracking and monitoring solutions, enabling businesses to leverage data-driven insights and real-time tracking capabilities. IoT connects many devices, sensors, and assets to the Internet. This connectivity allows for seamless communication and data exchange, making it possible to track and monitor various objects, from vehicles and equipment to goods and even people. IoT devices generate a constant stream of real-time data. As customer expectations for real-time tracking continue to rise, the market will likely expand further in the coming years.
However, consumers are increasingly concerned about the collection of their location and personal data. They may be hesitant to adopt tracking solutions or share their information if they perceive a risk to their privacy. This can slow down the adoption of TaaS in consumer-facing applications. Security breaches and data leaks can have severe consequences for TaaS providers. A data breach can compromise sensitive information, damage a company's reputation, and result in legal and financial liabilities. In applications that involve mapping and geolocation, having geospatial experts who understand GIS (Geographic Information Systems) can be essential. The abovementioned factors may lead to the restriction in the growth of the market.
Component Outlook
On the basis of component, the market is segmented into software and services. The services segment acquired a substantial revenue share in the market in 2022. Professional and managed services are expanding due to their ability to provide customized solutions and implementation assistance. These services accommodate the complex requirements of businesses by providing customization, seamless integration, and ongoing administration of tracking solutions. These services include risk mitigation, compliance adherence, and flexibility, ensuring monitoring systems adhere to industry standards and adapt to fluctuating business requirements.
Asset Type outlook
By asset type, the market is categorized into electronics & IT assets, in-transit equipment, manufacturing assets, and others. In 2022, the manufacturing assets segment registered the highest revenue share in the market. The segment's supremacy can be attributed to its pivotal position in meeting critical manufacturing requirements. These solutions enable manufacturers to optimize resource allocation, reduce downtime through predictive maintenance, and expedite supply chain operations by providing real-time visibility into machinery, equipment, and inventory. The integration of monitoring technologies aids manufacturers in complying with regulatory standards, improving data-driven decision-making, and preserving product quality, all of which are expected to increase over the forecast period.
Enterprise size outlook
Based on enterprise size, the market is fragmented into large enterprises and small & medium enterprises. The small and medium enterprises segment garnered a significant revenue share in the in 2022. Small and medium-sized enterprises are attracted to tracking as a service software and services due to their cost-effectiveness, which enables access to advanced tracking technologies without substantial outlays. Following the adaptable nature of SMEs, these solutions also promote operational efficiencies and resource optimization. SMEs can increase their competitiveness by utilizing tracking technologies to meet consumer demand for real-time updates, increase supply chain visibility, and reduce risks.
Industry outlook
On the basis of industry, the market is classified into transportation & logistics, manufacturing, healthcare & lifesciences, food & beverage, retail, IT & telecom, and others. In 2022, the manufacturing segment witnessed the largest revenue share in the market. The segment's development can be attributed to tracking as a service solution that provides real-time visibility into manufacturing assets, from machinery to raw materials. These solutions enable manufacturers to maximize asset utilization, minimize disruption, and enhance operational efficacy. Monitoring technologies facilitate supply chain optimization, allowing for end-to-end visibility and informed decision-making. Monitoring stock quantities, locations, and turnover rates, the tracking services aid manufacturers in keeping optimal inventory levels.
Regional outlook
Region-wise, the market is analyzed across North America, Europe, Asia Pacific, and LAMEA. The Asia Pacific region garnered a significant revenue share in the market in 2022. The regional market expansion can be attributed to increased e-commerce activities. Consequently, the rise in e-commerce patterns across the country has increased the acceptance of tracking solutions to trace products to increase customer transparency. In an environment characterized by complex supply chains, manufacturing expertise, and accelerated urbanization, tracking as a service solution simplifies logistics, optimize supply chains, and promote the sustainability of urban environments.
The market research report covers the analysis of key stakeholders of the market. Key companies profiled in the report include Rockwell Automation, Inc., Infor, Inc. (Koch Industries), Midmark Corporation, Sortly Inc. , EZO, PCCW Limited , MicroMain Corporation (JDM Technology Group Inc.), Trimble, Inc., Mojix, Inc. (Peak Rock Capital),Finale Inventory, Inc.
Scope of the Study
Market Segments covered in the Report:
By Component
- Software
- Services
By Asset Type
- Manufacturing Assets
- In-transit Equipment
- Electronics & IT Assets
- Others
By Enterprise Size
- Large Enterprises
- Small & Medium Enterprises
By Industry
- Manufacturing
- Transportation & Logistics
- Food & Beverage
- Healthcare & Lifesciences
- IT & Telecom
- Retail
- Others
By Geography
- North America
- US
- Canada
- Mexico
- Rest of North America
- Europe
- Germany
- UK
- France
- Russia
- Spain
- Italy
- Rest of Europe
- Asia Pacific
- China
- Japan
- India
- South Korea
- Singapore
- Malaysia
- Rest of Asia Pacific
- LAMEA
- Brazil
- Argentina
- UAE
- Saudi Arabia
- South Africa
- Nigeria
- Rest of LAMEA
Companies Profiled
- Rockwell Automation, Inc.
- Infor, Inc. (Koch Industries)
- Midmark Corporation
- Sortly Inc.
- EZO
- PCCW Limited
- MicroMain Corporation (JDM Technology Group Inc.)
- Trimble, Inc.
- Mojix, Inc. (Peak Rock Capital)
- Finale Inventory, Inc.
Unique Offerings from KBV Research
- Exhaustive coverage
- Highest number of market tables and figures
- Subscription based model available
- Guaranteed best price
- Assured post sales research support with 10% customization free
Table of Contents
Chapter 1. Market Scope & Methodology
- 1.1 Market Definition
- 1.2 Objectives
- 1.3 Market Scope
- 1.4 Segmentation
- 1.4.1 Global Tracking As A Service Market, by Component
- 1.4.2 Global Tracking As A Service Market, by Asset Type
- 1.4.3 Global Tracking As A Service Market, by Enterprise Size
- 1.4.4 Global Tracking As A Service Market, by Industry
- 1.4.5 Global Tracking As A Service Market, by Geography
- 1.5 Methodology for the research
Chapter 2. Market At a Glance
- 2.1 Key Highlights
Chapter 3. Market Overview
- 3.1 Introduction
- 3.1.1 Overview
- 3.1.1.1 Market Composition and Scenario
- 3.1.1 Overview
- 3.2 Key Factors Impacting the Market
- 3.2.1 Market Drivers
- 3.2.2 Market Restraints
- 3.3 Porter's Five Force Analysis
Chapter 4. Global Tracking As A Service Market, By Component
- 4.1 Global Software Market, By Region
- 4.2 Global Services Market, By Region
Chapter 5. Global Tracking As A Service Market, By Asset Type
- 5.1 Global Manufacturing Assets Market, By Region
- 5.2 Global In-transit Equipment Market, By Region
- 5.3 Global Electronics & IT Assets Market, By Region
- 5.4 Global Other Asset Type Market, By Region
Chapter 6. Global Tracking As A Service Market, By Enterprise Size
- 6.1 Global Large Enterprises Market, By Region
- 6.2 Global Small & Medium Enterprises Market, By Region
Chapter 7. Global Tracking As A Service Market, By Industry
- 7.1 Global Manufacturing Market, By Region
- 7.2 Global Transportation & Logistics Market, By Region
- 7.3 Global Food & Beverage Market, By Region
- 7.4 Global Healthcare & Lifesciences Market, By Region
- 7.5 Global IT & Telecom Market, By Region
- 7.6 Global Retail Market, By Region
- 7.7 Global Others Market, By Region
Chapter 8. Global Tracking As A Service Market, By Region
- 8.1 North America Tracking As A Service Market
- 8.1.1 North America Tracking As A Service Market, By Component
- 8.1.1.1 North America Software Market, By Country
- 8.1.1.2 North America Services Market, By Country
- 8.1.2 North America Tracking As A Service Market, By Asset Type
- 8.1.2.1 North America Manufacturing Assets Market, By Country
- 8.1.2.2 North America In-transit Equipment Market, By Country
- 8.1.2.3 North America Electronics & IT Assets Market, By Country
- 8.1.2.4 North America Other Asset Type Market, By Country
- 8.1.3 North America Tracking As A Service Market, By Enterprise Size
- 8.1.3.1 North America Large Enterprises Market, By Country
- 8.1.3.2 North America Small & Medium Enterprises Market, By Country
- 8.1.4 North America Tracking As A Service Market, By Industry
- 8.1.4.1 North America Manufacturing Market, By Country
- 8.1.4.2 North America Transportation & Logistics Market, By Country
- 8.1.4.3 North America Food & Beverage Market, By Country
- 8.1.4.4 North America Healthcare & Lifesciences Market, By Country
- 8.1.4.5 North America IT & Telecom Market, By Country
- 8.1.4.6 North America Retail Market, By Country
- 8.1.4.7 North America Others Market, By Country
- 8.1.5 North America Tracking As A Service Market, By Country
- 8.1.5.1 US Tracking As A Service Market
- 8.1.5.1.1 US Tracking As A Service Market, By Component
- 8.1.5.1.2 US Tracking As A Service Market, By Asset Type
- 8.1.5.1.3 US Tracking As A Service Market, By Enterprise Size
- 8.1.5.1.4 US Tracking As A Service Market, By Industry
- 8.1.5.2 Canada Tracking As A Service Market
- 8.1.5.2.1 Canada Tracking As A Service Market, By Component
- 8.1.5.2.2 Canada Tracking As A Service Market, By Asset Type
- 8.1.5.2.3 Canada Tracking As A Service Market, By Enterprise Size
- 8.1.5.2.4 Canada Tracking As A Service Market, By Industry
- 8.1.5.3 Mexico Tracking As A Service Market
- 8.1.5.3.1 Mexico Tracking As A Service Market, By Component
- 8.1.5.3.2 Mexico Tracking As A Service Market, By Asset Type
- 8.1.5.3.3 Mexico Tracking As A Service Market, By Enterprise Size
- 8.1.5.3.4 Mexico Tracking As A Service Market, By Industry
- 8.1.5.4 Rest of North America Tracking As A Service Market
- 8.1.5.4.1 Rest of North America Tracking As A Service Market, By Component
- 8.1.5.4.2 Rest of North America Tracking As A Service Market, By Asset Type
- 8.1.5.4.3 Rest of North America Tracking As A Service Market, By Enterprise Size
- 8.1.5.4.4 Rest of North America Tracking As A Service Market, By Industry
- 8.1.5.1 US Tracking As A Service Market
- 8.1.1 North America Tracking As A Service Market, By Component
- 8.2 Europe Tracking As A Service Market
- 8.2.1 Europe Tracking As A Service Market, By Component
- 8.2.1.1 Europe Software Market, By Country
- 8.2.1.2 Europe Services Market, By Country
- 8.2.2 Europe Tracking As A Service Market, By Asset Type
- 8.2.2.1 Europe Manufacturing Assets Market, By Country
- 8.2.2.2 Europe In-transit Equipment Market, By Country
- 8.2.2.3 Europe Electronics & IT Assets Market, By Country
- 8.2.2.4 Europe Other Asset Type Market, By Country
- 8.2.3 Europe Tracking As A Service Market, By Enterprise Size
- 8.2.3.1 Europe Large Enterprises Market, By Country
- 8.2.3.2 Europe Small & Medium Enterprises Market, By Country
- 8.2.4 Europe Tracking As A Service Market, By Industry
- 8.2.4.1 Europe Manufacturing Market, By Country
- 8.2.4.2 Europe Transportation & Logistics Market, By Country
- 8.2.4.3 Europe Food & Beverage Market, By Country
- 8.2.4.4 Europe Healthcare & Lifesciences Market, By Country
- 8.2.4.5 Europe IT & Telecom Market, By Country
- 8.2.4.6 Europe Retail Market, By Country
- 8.2.4.7 Europe Others Market, By Country
- 8.2.5 Europe Tracking As A Service Market, By Country
- 8.2.5.1 Germany Tracking As A Service Market
- 8.2.5.1.1 Germany Tracking As A Service Market, By Component
- 8.2.5.1.2 Germany Tracking As A Service Market, By Asset Type
- 8.2.5.1.3 Germany Tracking As A Service Market, By Enterprise Size
- 8.2.5.1.4 Germany Tracking As A Service Market, By Industry
- 8.2.5.2 UK Tracking As A Service Market
- 8.2.5.2.1 UK Tracking As A Service Market, By Component
- 8.2.5.2.2 UK Tracking As A Service Market, By Asset Type
- 8.2.5.2.3 UK Tracking As A Service Market, By Enterprise Size
- 8.2.5.2.4 UK Tracking As A Service Market, By Industry
- 8.2.5.3 France Tracking As A Service Market
- 8.2.5.3.1 France Tracking As A Service Market, By Component
- 8.2.5.3.2 France Tracking As A Service Market, By Asset Type
- 8.2.5.3.3 France Tracking As A Service Market, By Enterprise Size
- 8.2.5.3.4 France Tracking As A Service Market, By Industry
- 8.2.5.4 Russia Tracking As A Service Market
- 8.2.5.4.1 Russia Tracking As A Service Market, By Component
- 8.2.5.4.2 Russia Tracking As A Service Market, By Asset Type
- 8.2.5.4.3 Russia Tracking As A Service Market, By Enterprise Size
- 8.2.5.4.4 Russia Tracking As A Service Market, By Industry
- 8.2.5.5 Spain Tracking As A Service Market
- 8.2.5.5.1 Spain Tracking As A Service Market, By Component
- 8.2.5.5.2 Spain Tracking As A Service Market, By Asset Type
- 8.2.5.5.3 Spain Tracking As A Service Market, By Enterprise Size
- 8.2.5.5.4 Spain Tracking As A Service Market, By Industry
- 8.2.5.6 Italy Tracking As A Service Market
- 8.2.5.6.1 Italy Tracking As A Service Market, By Component
- 8.2.5.6.2 Italy Tracking As A Service Market, By Asset Type
- 8.2.5.6.3 Italy Tracking As A Service Market, By Enterprise Size
- 8.2.5.6.4 Italy Tracking As A Service Market, By Industry
- 8.2.5.7 Rest of Europe Tracking As A Service Market
- 8.2.5.7.1 Rest of Europe Tracking As A Service Market, By Component
- 8.2.5.7.2 Rest of Europe Tracking As A Service Market, By Asset Type
- 8.2.5.7.3 Rest of Europe Tracking As A Service Market, By Enterprise Size
- 8.2.5.7.4 Rest of Europe Tracking As A Service Market, By Industry
- 8.2.5.1 Germany Tracking As A Service Market
- 8.2.1 Europe Tracking As A Service Market, By Component
- 8.3 Asia Pacific Tracking As A Service Market
- 8.3.1 Asia Pacific Tracking As A Service Market, By Component
- 8.3.1.1 Asia Pacific Software Market, By Country
- 8.3.1.2 Asia Pacific Services Market, By Country
- 8.3.2 Asia Pacific Tracking As A Service Market, By Asset Type
- 8.3.2.1 Asia Pacific Manufacturing Assets Market, By Country
- 8.3.2.2 Asia Pacific In-transit Equipment Market, By Country
- 8.3.2.3 Asia Pacific Electronics & IT Assets Market, By Country
- 8.3.2.4 Asia Pacific Other Asset Type Market, By Country
- 8.3.3 Asia Pacific Tracking As A Service Market, By Enterprise Size
- 8.3.3.1 Asia Pacific Large Enterprises Market, By Country
- 8.3.3.2 Asia Pacific Small & Medium Enterprises Market, By Country
- 8.3.4 Asia Pacific Tracking As A Service Market, By Industry
- 8.3.4.1 Asia Pacific Manufacturing Market, By Country
- 8.3.4.2 Asia Pacific Transportation & Logistics Market, By Country
- 8.3.4.3 Asia Pacific Food & Beverage Market, By Country
- 8.3.4.4 Asia Pacific Healthcare & Lifesciences Market, By Country
- 8.3.4.5 Asia Pacific IT & Telecom Market, By Country
- 8.3.4.6 Asia Pacific Retail Market, By Country
- 8.3.4.7 Asia Pacific Others Market, By Country
- 8.3.5 Asia Pacific Tracking As A Service Market, By Country
- 8.3.5.1 China Tracking As A Service Market
- 8.3.5.1.1 China Tracking As A Service Market, By Component
- 8.3.5.1.2 China Tracking As A Service Market, By Asset Type
- 8.3.5.1.3 China Tracking As A Service Market, By Enterprise Size
- 8.3.5.1.4 China Tracking As A Service Market, By Industry
- 8.3.5.2 Japan Tracking As A Service Market
- 8.3.5.2.1 Japan Tracking As A Service Market, By Component
- 8.3.5.2.2 Japan Tracking As A Service Market, By Asset Type
- 8.3.5.2.3 Japan Tracking As A Service Market, By Enterprise Size
- 8.3.5.2.4 Japan Tracking As A Service Market, By Industry
- 8.3.5.3 India Tracking As A Service Market
- 8.3.5.3.1 India Tracking As A Service Market, By Component
- 8.3.5.3.2 India Tracking As A Service Market, By Asset Type
- 8.3.5.3.3 India Tracking As A Service Market, By Enterprise Size
- 8.3.5.3.4 India Tracking As A Service Market, By Industry
- 8.3.5.4 South Korea Tracking As A Service Market
- 8.3.5.4.1 South Korea Tracking As A Service Market, By Component
- 8.3.5.4.2 South Korea Tracking As A Service Market, By Asset Type
- 8.3.5.4.3 South Korea Tracking As A Service Market, By Enterprise Size
- 8.3.5.4.4 South Korea Tracking As A Service Market, By Industry
- 8.3.5.5 Singapore Tracking As A Service Market
- 8.3.5.5.1 Singapore Tracking As A Service Market, By Component
- 8.3.5.5.2 Singapore Tracking As A Service Market, By Asset Type
- 8.3.5.5.3 Singapore Tracking As A Service Market, By Enterprise Size
- 8.3.5.5.4 Singapore Tracking As A Service Market, By Industry
- 8.3.5.6 Malaysia Tracking As A Service Market
- 8.3.5.6.1 Malaysia Tracking As A Service Market, By Component
- 8.3.5.6.2 Malaysia Tracking As A Service Market, By Asset Type
- 8.3.5.6.3 Malaysia Tracking As A Service Market, By Enterprise Size
- 8.3.5.6.4 Malaysia Tracking As A Service Market, By Industry
- 8.3.5.7 Rest of Asia Pacific Tracking As A Service Market
- 8.3.5.7.1 Rest of Asia Pacific Tracking As A Service Market, By Component
- 8.3.5.7.2 Rest of Asia Pacific Tracking As A Service Market, By Asset Type
- 8.3.5.7.3 Rest of Asia Pacific Tracking As A Service Market, By Enterprise Size
- 8.3.5.7.4 Rest of Asia Pacific Tracking As A Service Market, By Industry
- 8.3.5.1 China Tracking As A Service Market
- 8.3.1 Asia Pacific Tracking As A Service Market, By Component
- 8.4 LAMEA Tracking As A Service Market
- 8.4.1 LAMEA Tracking As A Service Market, By Component
- 8.4.1.1 LAMEA Software Market, By Country
- 8.4.1.2 LAMEA Services Market, By Country
- 8.4.2 LAMEA Tracking As A Service Market, By Asset Type
- 8.4.2.1 LAMEA Manufacturing Assets Market, By Country
- 8.4.2.2 LAMEA In-transit Equipment Market, By Country
- 8.4.2.3 LAMEA Electronics & IT Assets Market, By Country
- 8.4.2.4 LAMEA Other Asset Type Market, By Country
- 8.4.3 LAMEA Tracking As A Service Market, By Enterprise Size
- 8.4.3.1 LAMEA Large Enterprises Market, By Country
- 8.4.3.2 LAMEA Small & Medium Enterprises Market, By Country
- 8.4.4 LAMEA Tracking As A Service Market, By Industry
- 8.4.4.1 LAMEA Manufacturing Market, By Country
- 8.4.4.2 LAMEA Transportation & Logistics Market, By Country
- 8.4.4.3 LAMEA Food & Beverage Market, By Country
- 8.4.4.4 LAMEA Healthcare & Lifesciences Market, By Country
- 8.4.4.5 LAMEA IT & Telecom Market, By Country
- 8.4.4.6 LAMEA Retail Market, By Country
- 8.4.4.7 LAMEA Others Market, By Country
- 8.4.5 LAMEA Tracking As A Service Market, By Country
- 8.4.5.1 Brazil Tracking As A Service Market
- 8.4.5.1.1 Brazil Tracking As A Service Market, By Component
- 8.4.5.1.2 Brazil Tracking As A Service Market, By Asset Type
- 8.4.5.1.3 Brazil Tracking As A Service Market, By Enterprise Size
- 8.4.5.1.4 Brazil Tracking As A Service Market, By Industry
- 8.4.5.2 Argentina Tracking As A Service Market
- 8.4.5.2.1 Argentina Tracking As A Service Market, By Component
- 8.4.5.2.2 Argentina Tracking As A Service Market, By Asset Type
- 8.4.5.2.3 Argentina Tracking As A Service Market, By Enterprise Size
- 8.4.5.2.4 Argentina Tracking As A Service Market, By Industry
- 8.4.5.3 UAE Tracking As A Service Market
- 8.4.5.3.1 UAE Tracking As A Service Market, By Component
- 8.4.5.3.2 UAE Tracking As A Service Market, By Asset Type
- 8.4.5.3.3 UAE Tracking As A Service Market, By Enterprise Size
- 8.4.5.3.4 UAE Tracking As A Service Market, By Industry
- 8.4.5.4 Saudi Arabia Tracking As A Service Market
- 8.4.5.4.1 Saudi Arabia Tracking As A Service Market, By Component
- 8.4.5.4.2 Saudi Arabia Tracking As A Service Market, By Asset Type
- 8.4.5.4.3 Saudi Arabia Tracking As A Service Market, By Enterprise Size
- 8.4.5.4.4 Saudi Arabia Tracking As A Service Market, By Industry
- 8.4.5.5 South Africa Tracking As A Service Market
- 8.4.5.5.1 South Africa Tracking As A Service Market, By Component
- 8.4.5.5.2 South Africa Tracking As A Service Market, By Asset Type
- 8.4.5.5.3 South Africa Tracking As A Service Market, By Enterprise Size
- 8.4.5.5.4 South Africa Tracking As A Service Market, By Industry
- 8.4.5.6 Nigeria Tracking As A Service Market
- 8.4.5.6.1 Nigeria Tracking As A Service Market, By Component
- 8.4.5.6.2 Nigeria Tracking As A Service Market, By Asset Type
- 8.4.5.6.3 Nigeria Tracking As A Service Market, By Enterprise Size
- 8.4.5.6.4 Nigeria Tracking As A Service Market, By Industry
- 8.4.5.7 Rest of LAMEA Tracking As A Service Market
- 8.4.5.7.1 Rest of LAMEA Tracking As A Service Market, By Component
- 8.4.5.7.2 Rest of LAMEA Tracking As A Service Market, By Asset Type
- 8.4.5.7.3 Rest of LAMEA Tracking As A Service Market, By Enterprise Size
- 8.4.5.7.4 Rest of LAMEA Tracking As A Service Market, By Industry
- 8.4.5.1 Brazil Tracking As A Service Market
- 8.4.1 LAMEA Tracking As A Service Market, By Component
Chapter 9. Company Profiles
- 9.1 Rockwell Automation, Inc.
- 9.1.1 Company Overview
- 9.1.2 Financial Analysis
- 9.1.3 Segmental and Regional Analysis
- 9.1.4 Research & Development Expenses
- 9.1.5 SWOT Analysis
- 9.2 Infor, Inc. (Koch Industries)
- 9.2.1 Company Overview
- 9.2.2 SWOT Analysis
- 9.3 Midmark Corporation
- 9.3.1 Company Overview
- 9.3.2 SWOT Analysis
- 9.4 Sortly Inc.
- 9.4.1 Company Overview
- 9.4.2 SWOT Analysis
- 9.5 EZO
- 9.5.1 Company Overview
- 9.5.2 SWOT Analysis
- 9.6 PCCW Limited
- 9.6.1 Company Overview
- 9.6.2 Financial Analysis
- 9.6.3 Segmental and Regional Analysis
- 9.6.4 SWOT Analysis
- 9.7 MicroMain Corporation (JDM Technology Group Inc.)
- 9.7.1 Company Overview
- 9.7.2 SWOT Analysis
- 9.8 Trimble, Inc.
- 9.8.1 Company Overview
- 9.8.2 Financial Analysis
- 9.8.3 Segmental and Regional Analysis
- 9.8.4 Research & Development Expenses
- 9.8.5 SWOT Analysis
- 9.9 Mojix, Inc. (Peak Rock Capital)
- 9.9.1 Company Overview
- 9.9.2 Recent strategies and developments:
- 9.9.2.1 Product Launches and Product Expansions:
- 9.9.3 SWOT Analysis
- 9.10. Finale Inventory, Inc.
- 9.10.1 Company Overview
- 9.10.2 SWOT Analysis
Chapter 10. Winning imperative of Tracking As A Service Market
