|
|
市場調査レポート
商品コード
1374332
セルフサービスBIの世界市場規模、シェア、産業動向分析レポート:コンポーネント別、展開別、企業タイプ別、用途別、業種別、地域別展望および予測、2023年~2030年Global Self-Service BI Market Size, Share & Industry Trends Analysis Report By Component (Software, and Services), By Deployment, By Enterprise Type By Application, By Vertical, By Regional Outlook and Forecast, 2023 - 2030 |
||||||
|
|
|||||||
|
|||||||


| セルフサービスBIの世界市場規模、シェア、産業動向分析レポート:コンポーネント別、展開別、企業タイプ別、用途別、業種別、地域別展望および予測、2023年~2030年 |
|
出版日: 2023年09月30日
発行: KBV Research
ページ情報: 英文 380 Pages
納期: 即納可能
|

- 全表示
- 概要
- 図表
- 目次
セルフサービスBI市場規模は2030年までに215億米ドルに達すると予測され、予測期間中のCAGRは15.8%の市場成長率で上昇します。
しかし、セルフサービスBIは、機密データや個人データへのアクセスや分析を伴うことが多いです。組織は、米国のカリフォルニア州消費者プライバシー法(CCPA)や欧州の一般データ保護規則(GDPR)のような厳格なプライバシー法によって、こうした情報のセキュリティと機密性を確保するよう求められています。このため、セルフサービスBIの実装では、データのセキュリティとプライバシーの確保が最重要となり、コンプライアンス上の課題が生じる可能性があります。データ保護法では多くの場合、データを収集・処理するために個人から明示的な同意を得ることが組織に義務付けられています。セルフサービスBIプラットフォーム内のユーザー権限と同意の管理は複雑な場合があります。データの不正確さは、分析結果にバイアスをもたらし、不公正な結果や差別的な結果につながる可能性があります。セルフサービスBIにおけるバイアスの検出と対処は、重要な関心事です。このような要因により、市場の成長は低下すると思われます。
コンポーネントの展望
コンポーネントに基づき、市場はソフトウェアとサービスに区分されます。2022年には、ソフトウェアセグメントが最大の収益シェアで市場を独占しました。セルフサービスBIソフトウェアは、データアクセスと分析を民主化し、ユーザーがデータ主導の意思決定を効率的に行えるようにすると同時に、データの可能性を最大限に活用することを目指す組織にとって貴重な資産となります。セルフサービスBIソフトウェアは、データベース、スプレッドシート、クラウドアプリケーションなど、さまざまなソースからのデータへの容易なアクセスを提供します。ユーザーは複数のソースからのデータを組み合わせて、包括的な分析を行うことができます。ソフトウェアには多くの場合、データのクレンジングと変換機能が含まれており、ユーザーはレポートや分析にわたってデータの品質と一貫性を維持できます。
展開の展望
導入形態によって、市場はオンプレミスとクラウドに細分化されます。クラウドセグメントは2022年の市場で大きな収益シェアを獲得しました。セルフサービスBI市場におけるクラウド展開とは、クラウドコンピューティングインフラストラクチャを通じてインターネット上でBIソフトウェアやツールをホスティングし、提供することを指します。クラウドベースのセルフサービスBIソリューションは、その拡張性、柔軟性、費用対効果、アクセシビリティにより、ますます人気が高まっています。クラウドの導入では、インフラやハードウェアに投資する必要がないため、オンプレミスのソリューションよりも初期投資額が少なくて済むことが多いです。その代わり、クラウド・サービスに対する支払いは、サブスクリプション・モデルまたは利用ベース・モデルで行われます。
企業の展望
企業タイプ別に見ると、市場は大企業と中小企業に分類されます。2022年には、大企業セグメントが市場で最も高い売上シェアを獲得しました。大企業では、さまざまな部門や役割の多様な従業員が働いていることが多いです。セルフサービスBIツールは、マーケティングマネージャー、財務アナリスト、営業担当者などの非技術系スタッフが独自にデータにアクセスして分析することを可能にし、ITやデータ専門家への依存を軽減します。大企業では、ビジネスユーザーを強化し、意思決定を改善し、データ分析プロセスを合理化できるセルフサービスBIの導入が進んでいます。大企業は膨大な量のデータを扱っており、タイムリーな意思決定が極めて重要です。
アプリケーションの展望
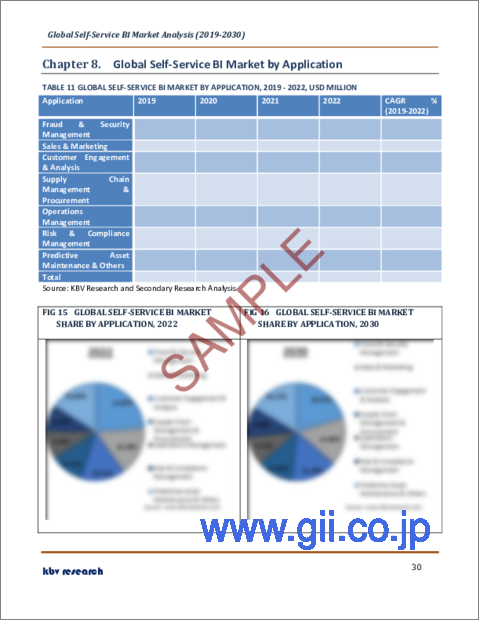
アプリケーション別に見ると、市場はセールス&マーケティング、顧客エンゲージメント&分析、不正&セキュリティ管理、リスク&コンプライアンス管理、予測的資産メンテナンス、オペレーション管理、サプライチェーン管理&調達、その他に分類されます。サプライチェーン管理・調達セグメントは、2022年の市場でかなりの収益シェアを予測しています。セルフサービスBIツールは、価値あるサプライチェーン管理と調達アプリケーションを提供し、組織がサプライチェーン業務を最適化し、コストを削減し、データ主導の意思決定を行うのを支援します。サプライチェーン管理と調達におけるセルフサービスBIアプリケーションは、組織がより良い意思決定のためにデータを活用し、サプライチェーン業務を最適化し、サプライヤーとの関係を強化する力を与えます。
業界別展望
業界別では、BFSI、小売・eコマース、通信・IT、ヘルスケア・ライフサイエンス、製造、運輸、エネルギー・公益、その他に区分されます。テレコム&ITセグメントは、2022年の市場で大きな収益シェアを獲得しました。テレコム企業は、セルフサービスBIを使用して、遅延、帯域幅の使用状況、ネットワークの混雑状況など、ネットワークのパフォーマンスを監視しています。通信およびIT業界は、継続的に新製品やサービスを導入しています。セルフサービスBIは、これらの提供製品のパフォーマンスを分析し、製品ポートフォリオを最適化するのに役立ちます。テレコムおよびIT企業は、ネットワークトラフィックとリソース利用データを分析して、ネットワークの拡張を計画し、リソース割り当てを最適化し、需要の増大に対応します。
地域別展望
地域別に見ると、市場は北米、欧州、アジア太平洋、LAMEAで分析されます。2022年には、アジア太平洋地域が市場でかなりの収益シェアを獲得しました。アジア太平洋地域は、モノのインターネット(IoT)や革新的な技術の採用が拡大しているほか、中国やインドにおけるスマートシティの開発など、政府の取り組みも進んでいることから、サポート市場において最も急成長している地域の1つになると予想されます。APAC地域は、あらゆる分野でデジタルトランスフォーメーションを経験しています。企業はデジタルインフラ、eコマースプラットフォーム、オンラインサービスに投資しており、その結果、セルフサービスBIを使用して分析できるデジタルデータが豊富に蓄積されています。APACでは、クラウドベースのセルフサービスBIソリューションの採用が増加しています。クラウドベースのセルフサービスBIソリューションは、大規模なインフラ投資を行うことなく、拡張性、柔軟性、アクセシビリティを提供するためです。
目次
第1章 市場範囲と調査手法
- 市場の定義
- 目的
- 市場範囲
- セグメンテーション
- 調査手法
第2章 市場の概要
- 主なハイライト
第3章 市場概要
- イントロダクション
- 概要
- 市場構成とシナリオ
- 概要
- 市場に影響を与える主な要因
- 市場促進要因
- 市場抑制要因
第4章 競合分析- 世界
- 市場シェア分析2022
- セルフサービスBI市場で展開される戦略
- ポーターのファイブフォース分析
第5章 世界のセルフサービスBI市場:コンポーネント別
- 世界のソフトウェア市場:地域別
- 世界サービス市場:地域別
第6章 世界のセルフサービスBI市場:展開別
- 世界のオンプレミス市場:地域別
- 世界のクラウド市場:地域別
第7章 世界のセルフサービスBI市場:企業タイプ別
- 世界の大企業市場:地域別
- 世界の中小企業市場:地域別
第8章 世界のセルフサービスBI市場:用途別
- 世界の不正およびセキュリティ管理市場:地域別
- 世界の販売およびマーケティング市場:地域別
- 世界の顧客エンゲージメントおよび分析市場:地域別
- 世界のサプライチェーン管理および調達市場:地域別
- 世界の運用管理市場:地域別
- 世界のリスク&コンプライアンス管理市場:地域別
- 世界の予測資産メンテナンスおよびその他の市場:地域別
第9章 世界のセルフサービスBI市場:業界別
- 世界のBFSI市場:地域別
- 世界の製造業市場:地域別
- 世界の輸送市場:地域別
- 世界のエネルギーおよび公益事業市場:地域別
- 世界のITおよびテレコム市場:地域別
- 世界の小売および電子商取引市場:地域別
- 世界のヘルスケアおよびライフサイエンス市場:地域別
- 世界のその他の市場:地域別
第10章 世界のセルフサービスBI市場:地域別
- 北米
- 北米の市場:国別
- 米国
- カナダ
- メキシコ
- その他北米地域
- 北米の市場:国別
- 欧州
- 欧州の市場:国別
- ドイツ
- 英国
- フランス
- ロシア
- スペイン
- イタリア
- その他欧州地域
- 欧州の市場:国別
- アジア太平洋
- アジア太平洋の市場:国別
- 中国
- 日本
- インド
- 韓国
- シンガポール
- マレーシア
- その他アジア太平洋地域
- アジア太平洋の市場:国別
- ラテンアメリカ・中東・アフリカ
- ラテンアメリカ・中東・アフリカの市場:国別
- ブラジル
- アルゼンチン
- アラブ首長国連邦
- サウジアラビア
- 南アフリカ
- ナイジェリア
- その他ラテンアメリカ・中東・アフリカ地域
- ラテンアメリカ・中東・アフリカの市場:国別
第11章 企業プロファイル
- Microsoft Corporation
- Oracle Corporation
- IBM Corporation
- SAP SE
- ThoughtSpot, Inc
- Zoho Corporation Pvt Ltd.
- Domo, Inc
- QlikTech International AB
- MicroStrategy, Inc
- Salesforce, Inc(Tableau Software, LLC)
第12章 セルフサービス BI市場の勝利の必須事項
LIST OF TABLES
- TABLE 1 Global Self-Service BI Market, 2019 - 2022, USD Million
- TABLE 2 Global Self-Service BI Market, 2023 - 2030, USD Million
- TABLE 3 Global Self-Service BI Market by Component, 2019 - 2022, USD Million
- TABLE 4 Global Self-Service BI Market by Component, 2023 - 2030, USD Million
- TABLE 5 Global Software Market by Region, 2019 - 2022, USD Million
- TABLE 6 Global Software Market by Region, 2023 - 2030, USD Million
- TABLE 7 Global Services Market by Region, 2019 - 2022, USD Million
- TABLE 8 Global Services Market by Region, 2023 - 2030, USD Million
- TABLE 9 Global Self-Service BI Market by Deployment, 2019 - 2022, USD Million
- TABLE 10 Global Self-Service BI Market by Deployment, 2023 - 2030, USD Million
- TABLE 11 Global On-Premise Market by Region, 2019 - 2022, USD Million
- TABLE 12 Global On-Premise Market by Region, 2023 - 2030, USD Million
- TABLE 13 Global Cloud Market by Region, 2019 - 2022, USD Million
- TABLE 14 Global Cloud Market by Region, 2023 - 2030, USD Million
- TABLE 15 Global Self-Service BI Market by Enterprise Type, 2019 - 2022, USD Million
- TABLE 16 Global Self-Service BI Market by Enterprise Type, 2023 - 2030, USD Million
- TABLE 17 Global Large Enterprises Market by Region, 2019 - 2022, USD Million
- TABLE 18 Global Large Enterprises Market by Region, 2023 - 2030, USD Million
- TABLE 19 Global Small & Medium Enterprises Market by Region, 2019 - 2022, USD Million
- TABLE 20 Global Small & Medium Enterprises Market by Region, 2023 - 2030, USD Million
- TABLE 21 Global Self-Service BI Market by Application, 2019 - 2022, USD Million
- TABLE 22 Global Self-Service BI Market by Application, 2023 - 2030, USD Million
- TABLE 23 Global Fraud & Security Management Market by Region, 2019 - 2022, USD Million
- TABLE 24 Global Fraud & Security Management Market by Region, 2023 - 2030, USD Million
- TABLE 25 Global Sales & Marketing Market by Region, 2019 - 2022, USD Million
- TABLE 26 Global Sales & Marketing Market by Region, 2023 - 2030, USD Million
- TABLE 27 Global Customer Engagement & Analysis Market by Region, 2019 - 2022, USD Million
- TABLE 28 Global Customer Engagement & Analysis Market by Region, 2023 - 2030, USD Million
- TABLE 29 Global Supply Chain Management & Procurement Market by Region, 2019 - 2022, USD Million
- TABLE 30 Global Supply Chain Management & Procurement Market by Region, 2023 - 2030, USD Million
- TABLE 31 Global Operations Management Market by Region, 2019 - 2022, USD Million
- TABLE 32 Global Operations Management Market by Region, 2023 - 2030, USD Million
- TABLE 33 Global Risk & Compliance Management Market by Region, 2019 - 2022, USD Million
- TABLE 34 Global Risk & Compliance Management Market by Region, 2023 - 2030, USD Million
- TABLE 35 Global Predictive Asset Maintenance & Others Market by Region, 2019 - 2022, USD Million
- TABLE 36 Global Predictive Asset Maintenance & Others Market by Region, 2023 - 2030, USD Million
- TABLE 37 Global Self-Service BI Market by Vertical, 2019 - 2022, USD Million
- TABLE 38 Global Self-Service BI Market by Vertical, 2023 - 2030, USD Million
- TABLE 39 Global BFSI Market by Region, 2019 - 2022, USD Million
- TABLE 40 Global BFSI Market by Region, 2023 - 2030, USD Million
- TABLE 41 Global Manufacturing Market by Region, 2019 - 2022, USD Million
- TABLE 42 Global Manufacturing Market by Region, 2023 - 2030, USD Million
- TABLE 43 Global Transportation Market by Region, 2019 - 2022, USD Million
- TABLE 44 Global Transportation Market by Region, 2023 - 2030, USD Million
- TABLE 45 Global Energy & Utilities Market by Region, 2019 - 2022, USD Million
- TABLE 46 Global Energy & Utilities Market by Region, 2023 - 2030, USD Million
- TABLE 47 Global IT & Telecom Market by Region, 2019 - 2022, USD Million
- TABLE 48 Global IT & Telecom Market by Region, 2023 - 2030, USD Million
- TABLE 49 Global Retail & Ecommerce Market by Region, 2019 - 2022, USD Million
- TABLE 50 Global Retail & Ecommerce Market by Region, 2023 - 2030, USD Million
- TABLE 51 Global Healthcare & Lifesciences Market by Region, 2019 - 2022, USD Million
- TABLE 52 Global Healthcare & Lifesciences Market by Region, 2023 - 2030, USD Million
- TABLE 53 Global Others Market by Region, 2019 - 2022, USD Million
- TABLE 54 Global Others Market by Region, 2023 - 2030, USD Million
- TABLE 55 Global Self-Service BI Market by Region, 2019 - 2022, USD Million
- TABLE 56 Global Self-Service BI Market by Region, 2023 - 2030, USD Million
- TABLE 57 North America Self-Service BI Market, 2019 - 2022, USD Million
- TABLE 58 North America Self-Service BI Market, 2023 - 2030, USD Million
- TABLE 59 North America Self-Service BI Market by Component, 2019 - 2022, USD Million
- TABLE 60 North America Self-Service BI Market by Component, 2023 - 2030, USD Million
- TABLE 61 North America Software Market by Region, 2019 - 2022, USD Million
- TABLE 62 North America Software Market by Region, 2023 - 2030, USD Million
- TABLE 63 North America Services Market by Region, 2019 - 2022, USD Million
- TABLE 64 North America Services Market by Region, 2023 - 2030, USD Million
- TABLE 65 North America Self-Service BI Market by Deployment, 2019 - 2022, USD Million
- TABLE 66 North America Self-Service BI Market by Deployment, 2023 - 2030, USD Million
- TABLE 67 North America On-Premise Market by Country, 2019 - 2022, USD Million
- TABLE 68 North America On-Premise Market by Country, 2023 - 2030, USD Million
- TABLE 69 North America Cloud Market by Country, 2019 - 2022, USD Million
- TABLE 70 North America Cloud Market by Country, 2023 - 2030, USD Million
- TABLE 71 North America Self-Service BI Market by Enterprise Type, 2019 - 2022, USD Million
- TABLE 72 North America Self-Service BI Market by Enterprise Type, 2023 - 2030, USD Million
- TABLE 73 North America Large Enterprises Market by Country, 2019 - 2022, USD Million
- TABLE 74 North America Large Enterprises Market by Country, 2023 - 2030, USD Million
- TABLE 75 North America Small & Medium Enterprises Market by Country, 2019 - 2022, USD Million
- TABLE 76 North America Small & Medium Enterprises Market by Country, 2023 - 2030, USD Million
- TABLE 77 North America Self-Service BI Market by Application, 2019 - 2022, USD Million
- TABLE 78 North America Self-Service BI Market by Application, 2023 - 2030, USD Million
- TABLE 79 North America Fraud & Security Management Market by Country, 2019 - 2022, USD Million
- TABLE 80 North America Fraud & Security Management Market by Country, 2023 - 2030, USD Million
- TABLE 81 North America Sales & Marketing Market by Country, 2019 - 2022, USD Million
- TABLE 82 North America Sales & Marketing Market by Country, 2023 - 2030, USD Million
- TABLE 83 North America Customer Engagement & Analysis Market by Country, 2019 - 2022, USD Million
- TABLE 84 North America Customer Engagement & Analysis Market by Country, 2023 - 2030, USD Million
- TABLE 85 North America Supply Chain Management & Procurement Market by Country, 2019 - 2022, USD Million
- TABLE 86 North America Supply Chain Management & Procurement Market by Country, 2023 - 2030, USD Million
- TABLE 87 North America Operations Management Market by Country, 2019 - 2022, USD Million
- TABLE 88 North America Operations Management Market by Country, 2023 - 2030, USD Million
- TABLE 89 North America Risk & Compliance Management Market by Country, 2019 - 2022, USD Million
- TABLE 90 North America Risk & Compliance Management Market by Country, 2023 - 2030, USD Million
- TABLE 91 North America Predictive Asset Maintenance & Others Market by Country, 2019 - 2022, USD Million
- TABLE 92 North America Predictive Asset Maintenance & Others Market by Country, 2023 - 2030, USD Million
- TABLE 93 North America Self-Service BI Market by Vertical, 2019 - 2022, USD Million
- TABLE 94 North America Self-Service BI Market by Vertical, 2023 - 2030, USD Million
- TABLE 95 North America BFSI Market by Country, 2019 - 2022, USD Million
- TABLE 96 North America BFSI Market by Country, 2023 - 2030, USD Million
- TABLE 97 North America Manufacturing Market by Country, 2019 - 2022, USD Million
- TABLE 98 North America Manufacturing Market by Country, 2023 - 2030, USD Million
- TABLE 99 North America Transportation Market by Country, 2019 - 2022, USD Million
- TABLE 100 North America Transportation Market by Country, 2023 - 2030, USD Million
- TABLE 101 North America Energy & Utilities Market by Country, 2019 - 2022, USD Million
- TABLE 102 North America Energy & Utilities Market by Country, 2023 - 2030, USD Million
- TABLE 103 North America IT & Telecom Market by Country, 2019 - 2022, USD Million
- TABLE 104 North America IT & Telecom Market by Country, 2023 - 2030, USD Million
- TABLE 105 North America Retail & Ecommerce Market by Country, 2019 - 2022, USD Million
- TABLE 106 North America Retail & Ecommerce Market by Country, 2023 - 2030, USD Million
- TABLE 107 North America Healthcare & Lifesciences Market by Country, 2019 - 2022, USD Million
- TABLE 108 North America Healthcare & Lifesciences Market by Country, 2023 - 2030, USD Million
- TABLE 109 North America Others Market by Country, 2019 - 2022, USD Million
- TABLE 110 North America Others Market by Country, 2023 - 2030, USD Million
- TABLE 111 North America Self-Service BI Market by Country, 2019 - 2022, USD Million
- TABLE 112 North America Self-Service BI Market by Country, 2023 - 2030, USD Million
- TABLE 113 US Self-Service BI Market, 2019 - 2022, USD Million
- TABLE 114 US Self-Service BI Market, 2023 - 2030, USD Million
- TABLE 115 US Self-Service BI Market by Component, 2019 - 2022, USD Million
- TABLE 116 US Self-Service BI Market by Component, 2023 - 2030, USD Million
- TABLE 117 US Self-Service BI Market by Deployment, 2019 - 2022, USD Million
- TABLE 118 US Self-Service BI Market by Deployment, 2023 - 2030, USD Million
- TABLE 119 US Self-Service BI Market by Enterprise Type, 2019 - 2022, USD Million
- TABLE 120 US Self-Service BI Market by Enterprise Type, 2023 - 2030, USD Million
- TABLE 121 US Self-Service BI Market by Application, 2019 - 2022, USD Million
- TABLE 122 US Self-Service BI Market by Application, 2023 - 2030, USD Million
- TABLE 123 US Self-Service BI Market by Vertical, 2019 - 2022, USD Million
- TABLE 124 US Self-Service BI Market by Vertical, 2023 - 2030, USD Million
- TABLE 125 Canada Self-Service BI Market, 2019 - 2022, USD Million
- TABLE 126 Canada Self-Service BI Market, 2023 - 2030, USD Million
- TABLE 127 Canada Self-Service BI Market by Component, 2019 - 2022, USD Million
- TABLE 128 Canada Self-Service BI Market by Component, 2023 - 2030, USD Million
- TABLE 129 Canada Self-Service BI Market by Deployment, 2019 - 2022, USD Million
- TABLE 130 Canada Self-Service BI Market by Deployment, 2023 - 2030, USD Million
- TABLE 131 Canada Self-Service BI Market by Enterprise Type, 2019 - 2022, USD Million
- TABLE 132 Canada Self-Service BI Market by Enterprise Type, 2023 - 2030, USD Million
- TABLE 133 Canada Self-Service BI Market by Application, 2019 - 2022, USD Million
- TABLE 134 Canada Self-Service BI Market by Application, 2023 - 2030, USD Million
- TABLE 135 Canada Self-Service BI Market by Vertical, 2019 - 2022, USD Million
- TABLE 136 Canada Self-Service BI Market by Vertical, 2023 - 2030, USD Million
- TABLE 137 Mexico Self-Service BI Market, 2019 - 2022, USD Million
- TABLE 138 Mexico Self-Service BI Market, 2023 - 2030, USD Million
- TABLE 139 Mexico Self-Service BI Market by Component, 2019 - 2022, USD Million
- TABLE 140 Mexico Self-Service BI Market by Component, 2023 - 2030, USD Million
- TABLE 141 Mexico Self-Service BI Market by Deployment, 2019 - 2022, USD Million
- TABLE 142 Mexico Self-Service BI Market by Deployment, 2023 - 2030, USD Million
- TABLE 143 Mexico Self-Service BI Market by Enterprise Type, 2019 - 2022, USD Million
- TABLE 144 Mexico Self-Service BI Market by Enterprise Type, 2023 - 2030, USD Million
- TABLE 145 Mexico Self-Service BI Market by Application, 2019 - 2022, USD Million
- TABLE 146 Mexico Self-Service BI Market by Application, 2023 - 2030, USD Million
- TABLE 147 Mexico Self-Service BI Market by Vertical, 2019 - 2022, USD Million
- TABLE 148 Mexico Self-Service BI Market by Vertical, 2023 - 2030, USD Million
- TABLE 149 Rest of North America Self-Service BI Market, 2019 - 2022, USD Million
- TABLE 150 Rest of North America Self-Service BI Market, 2023 - 2030, USD Million
- TABLE 151 Rest of North America Self-Service BI Market by Component, 2019 - 2022, USD Million
- TABLE 152 Rest of North America Self-Service BI Market by Component, 2023 - 2030, USD Million
- TABLE 153 Rest of North America Self-Service BI Market by Deployment, 2019 - 2022, USD Million
- TABLE 154 Rest of North America Self-Service BI Market by Deployment, 2023 - 2030, USD Million
- TABLE 155 Rest of North America Self-Service BI Market by Enterprise Type, 2019 - 2022, USD Million
- TABLE 156 Rest of North America Self-Service BI Market by Enterprise Type, 2023 - 2030, USD Million
- TABLE 157 Rest of North America Self-Service BI Market by Application, 2019 - 2022, USD Million
- TABLE 158 Rest of North America Self-Service BI Market by Application, 2023 - 2030, USD Million
- TABLE 159 Rest of North America Self-Service BI Market by Vertical, 2019 - 2022, USD Million
- TABLE 160 Rest of North America Self-Service BI Market by Vertical, 2023 - 2030, USD Million
- TABLE 161 Europe Self-Service BI Market, 2019 - 2022, USD Million
- TABLE 162 Europe Self-Service BI Market, 2023 - 2030, USD Million
- TABLE 163 Europe Self-Service BI Market by Component, 2019 - 2022, USD Million
- TABLE 164 Europe Self-Service BI Market by Component, 2023 - 2030, USD Million
- TABLE 165 Europe Software Market by Country, 2019 - 2022, USD Million
- TABLE 166 Europe Software Market by Country, 2023 - 2030, USD Million
- TABLE 167 Europe Services Market by Country, 2019 - 2022, USD Million
- TABLE 168 Europe Services Market by Country, 2023 - 2030, USD Million
- TABLE 169 Europe Self-Service BI Market by Deployment, 2019 - 2022, USD Million
- TABLE 170 Europe Self-Service BI Market by Deployment, 2023 - 2030, USD Million
- TABLE 171 Europe On-Premise Market by Country, 2019 - 2022, USD Million
- TABLE 172 Europe On-Premise Market by Country, 2023 - 2030, USD Million
- TABLE 173 Europe Cloud Market by Country, 2019 - 2022, USD Million
- TABLE 174 Europe Cloud Market by Country, 2023 - 2030, USD Million
- TABLE 175 Europe Self-Service BI Market by Enterprise Type, 2019 - 2022, USD Million
- TABLE 176 Europe Self-Service BI Market by Enterprise Type, 2023 - 2030, USD Million
- TABLE 177 Europe Large Enterprises Market by Country, 2019 - 2022, USD Million
- TABLE 178 Europe Large Enterprises Market by Country, 2023 - 2030, USD Million
- TABLE 179 Europe Small & Medium Enterprises Market by Country, 2019 - 2022, USD Million
- TABLE 180 Europe Small & Medium Enterprises Market by Country, 2023 - 2030, USD Million
- TABLE 181 Europe Self-Service BI Market by Application, 2019 - 2022, USD Million
- TABLE 182 Europe Self-Service BI Market by Application, 2023 - 2030, USD Million
- TABLE 183 Europe Fraud & Security Management Market by Country, 2019 - 2022, USD Million
- TABLE 184 Europe Fraud & Security Management Market by Country, 2023 - 2030, USD Million
- TABLE 185 Europe Sales & Marketing Market by Country, 2019 - 2022, USD Million
- TABLE 186 Europe Sales & Marketing Market by Country, 2023 - 2030, USD Million
- TABLE 187 Europe Customer Engagement & Analysis Market by Country, 2019 - 2022, USD Million
- TABLE 188 Europe Customer Engagement & Analysis Market by Country, 2023 - 2030, USD Million
- TABLE 189 Europe Supply Chain Management & Procurement Market by Country, 2019 - 2022, USD Million
- TABLE 190 Europe Supply Chain Management & Procurement Market by Country, 2023 - 2030, USD Million
- TABLE 191 Europe Operations Management Market by Country, 2019 - 2022, USD Million
- TABLE 192 Europe Operations Management Market by Country, 2023 - 2030, USD Million
- TABLE 193 Europe Risk & Compliance Management Market by Country, 2019 - 2022, USD Million
- TABLE 194 Europe Risk & Compliance Management Market by Country, 2023 - 2030, USD Million
- TABLE 195 Europe Predictive Asset Maintenance & Others Market by Country, 2019 - 2022, USD Million
- TABLE 196 Europe Predictive Asset Maintenance & Others Market by Country, 2023 - 2030, USD Million
- TABLE 197 Europe Self-Service BI Market by Vertical, 2019 - 2022, USD Million
- TABLE 198 Europe Self-Service BI Market by Vertical, 2023 - 2030, USD Million
- TABLE 199 Europe BFSI Market by Country, 2019 - 2022, USD Million
- TABLE 200 Europe BFSI Market by Country, 2023 - 2030, USD Million
- TABLE 201 Europe Manufacturing Market by Country, 2019 - 2022, USD Million
- TABLE 202 Europe Manufacturing Market by Country, 2023 - 2030, USD Million
- TABLE 203 Europe Transportation Market by Country, 2019 - 2022, USD Million
- TABLE 204 Europe Transportation Market by Country, 2023 - 2030, USD Million
- TABLE 205 Europe Energy & Utilities Market by Country, 2019 - 2022, USD Million
- TABLE 206 Europe Energy & Utilities Market by Country, 2023 - 2030, USD Million
- TABLE 207 Europe IT & Telecom Market by Country, 2019 - 2022, USD Million
- TABLE 208 Europe IT & Telecom Market by Country, 2023 - 2030, USD Million
- TABLE 209 Europe Retail & Ecommerce Market by Country, 2019 - 2022, USD Million
- TABLE 210 Europe Retail & Ecommerce Market by Country, 2023 - 2030, USD Million
- TABLE 211 Europe Healthcare & Lifesciences Market by Country, 2019 - 2022, USD Million
- TABLE 212 Europe Healthcare & Lifesciences Market by Country, 2023 - 2030, USD Million
- TABLE 213 Europe Others Market by Country, 2019 - 2022, USD Million
- TABLE 214 Europe Others Market by Country, 2023 - 2030, USD Million
- TABLE 215 Europe Self-Service BI Market by Country, 2019 - 2022, USD Million
- TABLE 216 Europe Self-Service BI Market by Country, 2023 - 2030, USD Million
- TABLE 217 Germany Self-Service BI Market, 2019 - 2022, USD Million
- TABLE 218 Germany Self-Service BI Market, 2023 - 2030, USD Million
- TABLE 219 Germany Self-Service BI Market by Component, 2019 - 2022, USD Million
- TABLE 220 Germany Self-Service BI Market by Component, 2023 - 2030, USD Million
- TABLE 221 Germany Self-Service BI Market by Deployment, 2019 - 2022, USD Million
- TABLE 222 Germany Self-Service BI Market by Deployment, 2023 - 2030, USD Million
- TABLE 223 Germany Self-Service BI Market by Enterprise Type, 2019 - 2022, USD Million
- TABLE 224 Germany Self-Service BI Market by Enterprise Type, 2023 - 2030, USD Million
- TABLE 225 Germany Self-Service BI Market by Application, 2019 - 2022, USD Million
- TABLE 226 Germany Self-Service BI Market by Application, 2023 - 2030, USD Million
- TABLE 227 Germany Self-Service BI Market by Vertical, 2019 - 2022, USD Million
- TABLE 228 Germany Self-Service BI Market by Vertical, 2023 - 2030, USD Million
- TABLE 229 UK Self-Service BI Market, 2019 - 2022, USD Million
- TABLE 230 UK Self-Service BI Market, 2023 - 2030, USD Million
- TABLE 231 UK Self-Service BI Market by Component, 2019 - 2022, USD Million
- TABLE 232 UK Self-Service BI Market by Component, 2023 - 2030, USD Million
- TABLE 233 UK Self-Service BI Market by Deployment, 2019 - 2022, USD Million
- TABLE 234 UK Self-Service BI Market by Deployment, 2023 - 2030, USD Million
- TABLE 235 UK Self-Service BI Market by Enterprise Type, 2019 - 2022, USD Million
- TABLE 236 UK Self-Service BI Market by Enterprise Type, 2023 - 2030, USD Million
- TABLE 237 UK Self-Service BI Market by Application, 2019 - 2022, USD Million
- TABLE 238 UK Self-Service BI Market by Application, 2023 - 2030, USD Million
- TABLE 239 UK Self-Service BI Market by Vertical, 2019 - 2022, USD Million
- TABLE 240 UK Self-Service BI Market by Vertical, 2023 - 2030, USD Million
- TABLE 241 France Self-Service BI Market, 2019 - 2022, USD Million
- TABLE 242 France Self-Service BI Market, 2023 - 2030, USD Million
- TABLE 243 France Self-Service BI Market by Component, 2019 - 2022, USD Million
- TABLE 244 France Self-Service BI Market by Component, 2023 - 2030, USD Million
- TABLE 245 France Self-Service BI Market by Deployment, 2019 - 2022, USD Million
- TABLE 246 France Self-Service BI Market by Deployment, 2023 - 2030, USD Million
- TABLE 247 France Self-Service BI Market by Enterprise Type, 2019 - 2022, USD Million
- TABLE 248 France Self-Service BI Market by Enterprise Type, 2023 - 2030, USD Million
- TABLE 249 France Self-Service BI Market by Application, 2019 - 2022, USD Million
- TABLE 250 France Self-Service BI Market by Application, 2023 - 2030, USD Million
- TABLE 251 France Self-Service BI Market by Vertical, 2019 - 2022, USD Million
- TABLE 252 France Self-Service BI Market by Vertical, 2023 - 2030, USD Million
- TABLE 253 Russia Self-Service BI Market, 2019 - 2022, USD Million
- TABLE 254 Russia Self-Service BI Market, 2023 - 2030, USD Million
- TABLE 255 Russia Self-Service BI Market by Component, 2019 - 2022, USD Million
- TABLE 256 Russia Self-Service BI Market by Component, 2023 - 2030, USD Million
- TABLE 257 Russia Self-Service BI Market by Deployment, 2019 - 2022, USD Million
- TABLE 258 Russia Self-Service BI Market by Deployment, 2023 - 2030, USD Million
- TABLE 259 Russia Self-Service BI Market by Enterprise Type, 2019 - 2022, USD Million
- TABLE 260 Russia Self-Service BI Market by Enterprise Type, 2023 - 2030, USD Million
- TABLE 261 Russia Self-Service BI Market by Application, 2019 - 2022, USD Million
- TABLE 262 Russia Self-Service BI Market by Application, 2023 - 2030, USD Million
- TABLE 263 Russia Self-Service BI Market by Vertical, 2019 - 2022, USD Million
- TABLE 264 Russia Self-Service BI Market by Vertical, 2023 - 2030, USD Million
- TABLE 265 Spain Self-Service BI Market, 2019 - 2022, USD Million
- TABLE 266 Spain Self-Service BI Market, 2023 - 2030, USD Million
- TABLE 267 Spain Self-Service BI Market by Component, 2019 - 2022, USD Million
- TABLE 268 Spain Self-Service BI Market by Component, 2023 - 2030, USD Million
- TABLE 269 Spain Self-Service BI Market by Deployment, 2019 - 2022, USD Million
- TABLE 270 Spain Self-Service BI Market by Deployment, 2023 - 2030, USD Million
- TABLE 271 Spain Self-Service BI Market by Enterprise Type, 2019 - 2022, USD Million
- TABLE 272 Spain Self-Service BI Market by Enterprise Type, 2023 - 2030, USD Million
- TABLE 273 Spain Self-Service BI Market by Application, 2019 - 2022, USD Million
- TABLE 274 Spain Self-Service BI Market by Application, 2023 - 2030, USD Million
- TABLE 275 Spain Self-Service BI Market by Vertical, 2019 - 2022, USD Million
- TABLE 276 Spain Self-Service BI Market by Vertical, 2023 - 2030, USD Million
The Global Self-Service BI Market size is expected to reach $21.5 billion by 2030, rising at a market growth of 15.8% CAGR during the forecast period.
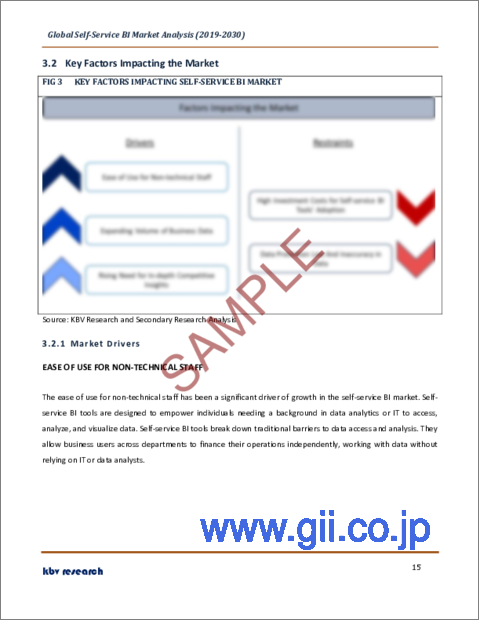
The healthcare and life sciences segment garnered a promising growth rate in the self-service BI market in 2022. Healthcare associations deal with vast amounts of data, from patient records to clinical and financial information. Consequently, the healthcare and life sciences segment generated $791.2 million revenue of the market in 2022. Self-service BI tools empower healthcare professionals to extract actionable insights from this data. Healthcare providers use self-service BI to analyze clinical data, such as electronic health records (EHRs), lab results, and patient histories. This aids in diagnosing and treating patients more effectively. Some of the factors affecting the market are ease of use for non-technical staff, expanding volume of business data, and data protection law and inaccuracy in data.
The ease of use for non-technical staff has been a significant driver of growth in the self-service BI market. Self-service BI tools are designed to empower individuals needing a background in data analytics or IT to access, analyze, and visualize data. These tools break down traditional barriers to data access and analysis. They allow business users across departments to finance their operations independently, working with data without relying on IT or data analysts. Non-technical staff can create reports, dashboards, and visualizations without IT intervention. This eases the burden on IT departments and allows them to concentrate on more strategic tasks. Moreover, In the digital era, businesses generate and collect vast amounts of data from various sources, including sales transactions, customer interactions, website activity, social media, sensors, and more. This abundance of data presents both opportunities and challenges. Businesses now deal with diverse data sources, such as structured data (e.g., databases), semi-structured data (e.g., log files), and unstructured data (e.g., text and multimedia). Self-service BI tools are equipped to handle this variety of data, making them indispensable for data analysis. Therefore, the increasing importance of business data is a driving force behind the growth of the market.
However, Self-service BI often involves accessing and analyzing sensitive and personal data. Organizations are required by stringent privacy laws, like the California Consumer Privacy Act (CCPA) in the US or the General Data Protection Regulation (GDPR) in Europe, to ensure the security and confidentiality of such information. This can create compliance challenges for self-service BI implementations, as ensuring data security and privacy becomes paramount. Data protection laws often require organizations to obtain explicit consent from individuals to collect and process their data. Managing user permissions and consent within self-service BI platforms can be complex. Inaccuracies in data can introduce bias into analytical results, leading to unfair or discriminatory outcomes. Detecting and addressing bias in self-service BI is a critical concern. Due to such factors, the market growth will decline.
Component Outlook
Based on component, the market is segmented into software and services. In 2022, the software segment dominated the market with the maximum revenue share. Self-service BI software democratizes data access and analysis, making it a valuable asset for organizations aiming to harness the full potential of their data while empowering users to make data-driven decisions efficiently. Self-service BI software provides easy access to data from various sources, including databases, spreadsheets, and cloud applications. Users can combine data from multiple sources for comprehensive analysis. The software often includes data cleansing and transformation capabilities, helping users maintain data quality and consistency across reports and analyses.
Deployment Outlook
On the basis of deployment, the market is fragmented into on-premises and cloud. The cloud segment garnered a significant revenue share in the market in 2022. Cloud deployment in the self-service BI market refers to the hosting and delivering BI software and tools over the internet through cloud computing infrastructure. Cloud-based self-service BI solutions have become increasingly popular due to their scalability, flexibility, cost-effectiveness, and accessibility. Cloud deployments often require lower upfront capital expenditures than on-premises solutions because organizations do not need to invest in their infrastructure and hardware. Instead, they pay for cloud services on a subscription or usage-based model.
Enterprise Outlook
By enterprise type, the market is classified into large enterprises and small & medium enterprises. In 2022, the large enterprise segment generated the highest revenue share in the market. Large enterprises often have diverse employees across various departments and roles. Self-service BI tools allow non-technical staff, such as marketing managers, financial analysts, and sales representatives, to independently access and analyze data, reducing their reliance on IT or data experts. Large enterprises are increasingly adopting self-service BI due to its ability to empower business users, improve decision-making, and streamline data analysis processes. Large enterprises deal with vast volumes of data, and timely decision-making is crucial.
Application outlook
Based on application, the market is categorized into sales & marketing, customer engagement & analysis, fraud & security management, risk & compliance management, predictive asset maintenance, operations management, supply chain management & procurement, and others. The supply chain management & procurement segment projected a considerable revenue share in the market in 2022. Self-service BI tools offer valuable supply chain management and procurement applications, helping organizations optimize their supply chain operations, reduce costs, and make data-driven decisions. Self-service BI applications in supply chain management and procurement empower organizations to leverage data for better decision-making, optimize supply chain operations, and enhance supplier relationships.
Vertical Outlook
On the basis of vertical, the market is segmented into BFSI, retail & ecommerce, telecom & IT, healthcare & life sciences, manufacturing, transportation, energy & utilities, and others. The telecom & IT segment procured a significant revenue share in the market in 2022. Telecom companies use self-service BI to monitor the performance of their networks, including latency, bandwidth usage, and network congestion. The telecom and IT industry continually introduces new products and services. Self-service BI assists in analyzing the performance of these offerings and optimizing product portfolios. Telecom and IT companies analyze network traffic and resource utilization data to plan for network expansion, optimize resource allocation, and meet growing demand.
Regional Outlook
Region-wise, the market is analyzed across North America, Europe, Asia Pacific, and LAMEA. In 2022, the Asia Pacific region generated a considerable revenue share in the market. The Asia-Pacific region is expected to be one of the fastest-growing regions in the support market because of the expanding adoption of the Internet of Things (IoT) and innovative technologies and other government initiatives, such as developing smart cities in China and India. The APAC region is experiencing digital transformation across sectors. Companies are investing in digital infrastructure, e-commerce platforms, and online services, resulting in a wealth of digital data that can be analyzed using self-service BI. The adoption of cloud-based self-service BI solutions is rising in APAC, as they offer scalability, flexibility, and accessibility without significant infrastructure investments.
The market research report covers the analysis of key stakeholders of the market. Key companies profiled in the report include Microsoft Corporation Oracle Corporation, IBM Corporation, SAP SE, ThoughtSpot, Inc., Zoho Corporation Pvt. Ltd., Domo, Inc., QlikTech International AB, MicroStrategy, Inc., Salesforce, Inc. (Tableau Software, LLC).
Recent Strategies Deployed in Self-Service BI Market
Jul-2023: ThoughtSpot, Inc. completed the acquisition of Mode Analytics, a developer of a collaborative analytics platform used to make data-informed decisions. Through this acquisition, ThoughtSpot aims to empower its position as an industry leader that delivers next-generation AI Collaborative Business Intelligence (BI) to life.
June-2023: Microstrategy Inc. entered into a partnership with Microsoft Corporation, a leading developer of personal-computer software systems and applications. Through this partnership, Qlick aimed to integrate its advanced analytics capabilities with Azure OpenAI Service to support businesses in harnessing the full potential of their data.
Nov-2022: IBM Corporation announced the launch of IBM Business Analytics Enterprise. The Business Analytics Enterprise is a collection of business intelligence services used for planning, forecasting, and reporting for a business. The Business Analytics Enterprise features IBM Analytics Content Hub that provides analytics and planning dashboards, it features algorithms used for advising role-based content for assistance in decision making.
Nov-2022: QlikTech International AB launched Qlik Cloud Data Integration, a set of SaaS services designed for analytics and data engineers deploying enterprise integration and transformation initiatives. Through this product launch, Qlick aimed to provide support in creating real-time fabric between any data source, target, and destination, leveraging the power of the cloud to allow everyone in the enterprise to act precisely through data.
Jul-2021: Zoho Corporation introduced a new business intelligence platform called Zoho Analytics 5.0, an AI-driven data analytics and self-service data preparation and augmented analytics platform. Through this launch, the company aimed to allow organizations to cleanse, unify, and analyze cross-departmental data, and obtain an encyclopedic view of the company.
Aug-2019: Salesforce, Inc. took over Tableau Software, LLC, an American interactive data visualization software company focused on business intelligence. Through this acquisition, Salesforce would boost its opportunity in the digital transformation space.
May-2019: QlikTech International AB took over Attunity Ltd., a leading provider of information availability software solutions that enable access, sharing, and distribution of data across the organization. With this acquisition, Qlik aimed to improve the access, real-time movement, and latest transformation of data between sources and systems across the enterprise which would be crucial to organizations realizing the full power of their data.
Scope of the Study
Market Segments covered in the Report:
By Component
- Software
- Services
By Deployment
- On-Premises
- Cloud
By Enterprise Type
- Large Enterprises
- Small & Medium Enterprises
By Application
- Fraud & Security Management
- Sales & Marketing
- Customer Engagement & Analysis
- Supply Chain Management & Procurement
- Operations Management
- Risk & Compliance Management
- Predictive Asset Maintenance & Others
By Vertical
- BFSI
- Manufacturing
- Transportation
- Energy & Utilities
- IT & Telecom
- Retail & Ecommerce
- Healthcare & Lifesciences
- Others
By Geography
- North America
- US
- Canada
- Mexico
- Rest of North America
- Europe
- Germany
- UK
- France
- Russia
- Spain
- Italy
- Rest of Europe
- Asia Pacific
- China
- Japan
- India
- South Korea
- Singapore
- Malaysia
- Rest of Asia Pacific
- LAMEA
- Brazil
- Argentina
- UAE
- Saudi Arabia
- South Africa
- Nigeria
- Rest of LAMEA
Companies Profiled
- Microsoft Corporation
- Oracle Corporation
- IBM Corporation
- SAP SE
- ThoughtSpot, Inc.
- Zoho Corporation Pvt. Ltd.
- Domo, Inc
- QlikTech International AB
- MicroStrategy, Inc.
- Salesforce, Inc. (Tableau Software, LLC)
Unique Offerings from KBV Research
- Exhaustive coverage
- Highest number of market tables and figures
- Subscription based model available.
- Guaranteed best price.
- Assured post sales research support with 10% customization free
Table of Contents
Chapter 1. Market Scope & Methodology
- 1.1 Market Definition
- 1.2 Objectives
- 1.3 Market Scope
- 1.4 Segmentation
- 1.4.1 Global Self-Service BI Market, by Component
- 1.4.2 Global Self-Service BI Market, by Deployment
- 1.4.3 Global Self-Service BI Market, by Enterprise Type
- 1.4.4 Global Self-Service BI Market, by Application
- 1.4.5 Global Self-Service BI Market, by Vertical
- 1.4.6 Global Self-Service BI Market, by Geography
- 1.5 Methodology for the research
Chapter 2. Market at a Glance
- 2.1 Key Highlights
Chapter 3. Market Overview
- 3.1 Introduction
- 3.1.1 Overview
- 3.1.1.1 Market Composition and Scenario
- 3.1.1 Overview
- 3.2 Key Factors Impacting the Market
- 3.2.1 Market Drivers
- 3.2.2 Market Restraints
Chapter 4. Competition Analysis - Global
- 4.1 Market Share Analysis, 2022
- 4.2 Strategies Deployed in Self-Service BI Market
- 4.3 Porter's Five Forces Analysis
Chapter 5. Global Self-Service BI Market by Component
- 5.1 Global Software Market by Region
- 5.2 Global Services Market by Region
Chapter 6. Global Self-Service BI Market by Deployment
- 6.1 Global On-Premise Market by Region
- 6.2 Global Cloud Market by Region
Chapter 7. Global Self-Service BI Market by Enterprise Type
- 7.1 Global Large Enterprises Market by Region
- 7.2 Global Small & Medium Enterprises Market by Region
Chapter 8. Global Self-Service BI Market by Application
- 8.1 Global Fraud & Security Management Market by Region
- 8.2 Global Sales & Marketing Market by Region
- 8.3 Global Customer Engagement & Analysis Market by Region
- 8.4 Global Supply Chain Management & Procurement Market by Region
- 8.5 Global Operations Management Market by Region
- 8.6 Global Risk & Compliance Management Market by Region
- 8.7 Global Predictive Asset Maintenance & Others Market by Region
Chapter 9. Global Self-Service BI Market by Vertical
- 9.1 Global BFSI Market by Region
- 9.2 Global Manufacturing Market by Region
- 9.3 Global Transportation Market by Region
- 9.4 Global Energy & Utilities Market by Region
- 9.5 Global IT & Telecom Market by Region
- 9.6 Global Retail & Ecommerce Market by Region
- 9.7 Global Healthcare & Lifesciences Market by Region
- 9.8 Global Others Market by Region
Chapter 10. Global Self-Service BI Market by Region
- 10.1 North America Self-Service BI Market
- 10.1.1 North America Self-Service BI Market by Component
- 10.1.1.1 North America Software Market by Region
- 10.1.1.2 North America Services Market by Region
- 10.1.2 North America Self-Service BI Market by Deployment
- 10.1.2.1 North America On-Premise Market by Country
- 10.1.2.2 North America Cloud Market by Country
- 10.1.3 North America Self-Service BI Market by Enterprise Type
- 10.1.3.1 North America Large Enterprises Market by Country
- 10.1.3.2 North America Small & Medium Enterprises Market by Country
- 10.1.4 North America Self-Service BI Market by Application
- 10.1.4.1 North America Fraud & Security Management Market by Country
- 10.1.4.2 North America Sales & Marketing Market by Country
- 10.1.4.3 North America Customer Engagement & Analysis Market by Country
- 10.1.4.4 North America Supply Chain Management & Procurement Market by Country
- 10.1.4.5 North America Operations Management Market by Country
- 10.1.4.6 North America Risk & Compliance Management Market by Country
- 10.1.4.7 North America Predictive Asset Maintenance & Others Market by Country
- 10.1.5 North America Self-Service BI Market by Vertical
- 10.1.5.1 North America BFSI Market by Country
- 10.1.5.2 North America Manufacturing Market by Country
- 10.1.5.3 North America Transportation Market by Country
- 10.1.5.4 North America Energy & Utilities Market by Country
- 10.1.5.5 North America IT & Telecom Market by Country
- 10.1.5.6 North America Retail & Ecommerce Market by Country
- 10.1.5.7 North America Healthcare & Lifesciences Market by Country
- 10.1.5.8 North America Others Market by Country
- 10.1.6 North America Self-Service BI Market by Country
- 10.1.6.1 US Self-Service BI Market
- 10.1.6.1.1 US Self-Service BI Market by Component
- 10.1.6.1.2 US Self-Service BI Market by Deployment
- 10.1.6.1.3 US Self-Service BI Market by Enterprise Type
- 10.1.6.1.4 US Self-Service BI Market by Application
- 10.1.6.1.5 US Self-Service BI Market by Vertical
- 10.1.6.2 Canada Self-Service BI Market
- 10.1.6.2.1 Canada Self-Service BI Market by Component
- 10.1.6.2.2 Canada Self-Service BI Market by Deployment
- 10.1.6.2.3 Canada Self-Service BI Market by Enterprise Type
- 10.1.6.2.4 Canada Self-Service BI Market by Application
- 10.1.6.2.5 Canada Self-Service BI Market by Vertical
- 10.1.6.3 Mexico Self-Service BI Market
- 10.1.6.3.1 Mexico Self-Service BI Market by Component
- 10.1.6.3.2 Mexico Self-Service BI Market by Deployment
- 10.1.6.3.3 Mexico Self-Service BI Market by Enterprise Type
- 10.1.6.3.4 Mexico Self-Service BI Market by Application
- 10.1.6.3.5 Mexico Self-Service BI Market by Vertical
- 10.1.6.4 Rest of North America Self-Service BI Market
- 10.1.6.4.1 Rest of North America Self-Service BI Market by Component
- 10.1.6.4.2 Rest of North America Self-Service BI Market by Deployment
- 10.1.6.4.3 Rest of North America Self-Service BI Market by Enterprise Type
- 10.1.6.4.4 Rest of North America Self-Service BI Market by Application
- 10.1.6.4.5 Rest of North America Self-Service BI Market by Vertical
- 10.1.6.1 US Self-Service BI Market
- 10.1.1 North America Self-Service BI Market by Component
- 10.2 Europe Self-Service BI Market
- 10.2.1 Europe Self-Service BI Market by Component
- 10.2.1.1 Europe Software Market by Country
- 10.2.1.2 Europe Services Market by Country
- 10.2.2 Europe Self-Service BI Market by Deployment
- 10.2.2.1 Europe On-Premise Market by Country
- 10.2.2.2 Europe Cloud Market by Country
- 10.2.3 Europe Self-Service BI Market by Enterprise Type
- 10.2.3.1 Europe Large Enterprises Market by Country
- 10.2.3.2 Europe Small & Medium Enterprises Market by Country
- 10.2.4 Europe Self-Service BI Market by Application
- 10.2.4.1 Europe Fraud & Security Management Market by Country
- 10.2.4.2 Europe Sales & Marketing Market by Country
- 10.2.4.3 Europe Customer Engagement & Analysis Market by Country
- 10.2.4.4 Europe Supply Chain Management & Procurement Market by Country
- 10.2.4.5 Europe Operations Management Market by Country
- 10.2.4.6 Europe Risk & Compliance Management Market by Country
- 10.2.4.7 Europe Predictive Asset Maintenance & Others Market by Country
- 10.2.5 Europe Self-Service BI Market by Vertical
- 10.2.5.1 Europe BFSI Market by Country
- 10.2.5.2 Europe Manufacturing Market by Country
- 10.2.5.3 Europe Transportation Market by Country
- 10.2.5.4 Europe Energy & Utilities Market by Country
- 10.2.5.5 Europe IT & Telecom Market by Country
- 10.2.5.6 Europe Retail & Ecommerce Market by Country
- 10.2.5.7 Europe Healthcare & Lifesciences Market by Country
- 10.2.5.8 Europe Others Market by Country
- 10.2.6 Europe Self-Service BI Market by Country
- 10.2.6.1 Germany Self-Service BI Market
- 10.2.6.1.1 Germany Self-Service BI Market by Component
- 10.2.6.1.2 Germany Self-Service BI Market by Deployment
- 10.2.6.1.3 Germany Self-Service BI Market by Enterprise Type
- 10.2.6.1.4 Germany Self-Service BI Market by Application
- 10.2.6.1.5 Germany Self-Service BI Market by Vertical
- 10.2.6.2 UK Self-Service BI Market
- 10.2.6.2.1 UK Self-Service BI Market by Component
- 10.2.6.2.2 UK Self-Service BI Market by Deployment
- 10.2.6.2.3 UK Self-Service BI Market by Enterprise Type
- 10.2.6.2.4 UK Self-Service BI Market by Application
- 10.2.6.2.5 UK Self-Service BI Market by Vertical
- 10.2.6.3 France Self-Service BI Market
- 10.2.6.3.1 France Self-Service BI Market by Component
- 10.2.6.3.2 France Self-Service BI Market by Deployment
- 10.2.6.3.3 France Self-Service BI Market by Enterprise Type
- 10.2.6.3.4 France Self-Service BI Market by Application
- 10.2.6.3.5 France Self-Service BI Market by Vertical
- 10.2.6.4 Russia Self-Service BI Market
- 10.2.6.4.1 Russia Self-Service BI Market by Component
- 10.2.6.4.2 Russia Self-Service BI Market by Deployment
- 10.2.6.4.3 Russia Self-Service BI Market by Enterprise Type
- 10.2.6.4.4 Russia Self-Service BI Market by Application
- 10.2.6.4.5 Russia Self-Service BI Market by Vertical
- 10.2.6.5 Spain Self-Service BI Market
- 10.2.6.5.1 Spain Self-Service BI Market by Component
- 10.2.6.5.2 Spain Self-Service BI Market by Deployment
- 10.2.6.5.3 Spain Self-Service BI Market by Enterprise Type
- 10.2.6.5.4 Spain Self-Service BI Market by Application
- 10.2.6.5.5 Spain Self-Service BI Market by Vertical
- 10.2.6.6 Italy Self-Service BI Market
- 10.2.6.6.1 Italy Self-Service BI Market by Component
- 10.2.6.6.2 Italy Self-Service BI Market by Deployment
- 10.2.6.6.3 Italy Self-Service BI Market by Enterprise Type
- 10.2.6.6.4 Italy Self-Service BI Market by Application
- 10.2.6.6.5 Italy Self-Service BI Market by Vertical
- 10.2.6.7 Rest of Europe Self-Service BI Market
- 10.2.6.7.1 Rest of Europe Self-Service BI Market by Component
- 10.2.6.7.2 Rest of Europe Self-Service BI Market by Deployment
- 10.2.6.7.3 Rest of Europe Self-Service BI Market by Enterprise Type
- 10.2.6.7.4 Rest of Europe Self-Service BI Market by Application
- 10.2.6.7.5 Rest of Europe Self-Service BI Market by Vertical
- 10.2.6.1 Germany Self-Service BI Market
- 10.2.1 Europe Self-Service BI Market by Component
- 10.3 Asia Pacific Self-Service BI Market
- 10.3.1 Asia Pacific Self-Service BI Market by Component
- 10.3.1.1 Asia Pacific Software Market by Country
- 10.3.1.2 Asia Pacific Services Market by Country
- 10.3.2 Asia Pacific Self-Service BI Market by Deployment
- 10.3.2.1 Asia Pacific On-Premise Market by Country
- 10.3.2.2 Asia Pacific Cloud Market by Country
- 10.3.3 Asia Pacific Self-Service BI Market by Enterprise Type
- 10.3.3.1 Asia Pacific Large Enterprises Market by Country
- 10.3.3.2 Asia Pacific Small & Medium Enterprises Market by Country
- 10.3.4 Asia Pacific Self-Service BI Market by Application
- 10.3.4.1 Asia Pacific Fraud & Security Management Market by Country
- 10.3.4.2 Asia Pacific Sales & Marketing Market by Country
- 10.3.4.3 Asia Pacific Customer Engagement & Analysis Market by Country
- 10.3.4.4 Asia Pacific Supply Chain Management & Procurement Market by Country
- 10.3.4.5 Asia Pacific Operations Management Market by Country
- 10.3.4.6 Asia Pacific Risk & Compliance Management Market by Country
- 10.3.4.7 Asia Pacific Predictive Asset Maintenance & Others Market by Country
- 10.3.5 Asia Pacific Self-Service BI Market by Vertical
- 10.3.5.1 Asia Pacific BFSI Market by Country
- 10.3.5.2 Asia Pacific Manufacturing Market by Country
- 10.3.5.3 Asia Pacific Transportation Market by Country
- 10.3.5.4 Asia Pacific Energy & Utilities Market by Country
- 10.3.5.5 Asia Pacific IT & Telecom Market by Country
- 10.3.5.6 Asia Pacific Retail & Ecommerce Market by Country
- 10.3.5.7 Asia Pacific Healthcare & Lifesciences Market by Country
- 10.3.5.8 Asia Pacific Others Market by Country
- 10.3.6 Asia Pacific Self-Service BI Market by Country
- 10.3.6.1 China Self-Service BI Market
- 10.3.6.1.1 China Self-Service BI Market by Component
- 10.3.6.1.2 China Self-Service BI Market by Deployment
- 10.3.6.1.3 China Self-Service BI Market by Enterprise Type
- 10.3.6.1.4 China Self-Service BI Market by Application
- 10.3.6.1.5 China Self-Service BI Market by Vertical
- 10.3.6.2 Japan Self-Service BI Market
- 10.3.6.2.1 Japan Self-Service BI Market by Component
- 10.3.6.2.2 Japan Self-Service BI Market by Deployment
- 10.3.6.2.3 Japan Self-Service BI Market by Enterprise Type
- 10.3.6.2.4 Japan Self-Service BI Market by Application
- 10.3.6.2.5 Japan Self-Service BI Market by Vertical
- 10.3.6.3 India Self-Service BI Market
- 10.3.6.3.1 India Self-Service BI Market by Component
- 10.3.6.3.2 India Self-Service BI Market by Deployment
- 10.3.6.3.3 India Self-Service BI Market by Enterprise Type
- 10.3.6.3.4 India Self-Service BI Market by Application
- 10.3.6.3.5 India Self-Service BI Market by Vertical
- 10.3.6.4 South Korea Self-Service BI Market
- 10.3.6.4.1 South Korea Self-Service BI Market by Component
- 10.3.6.4.2 South Korea Self-Service BI Market by Deployment
- 10.3.6.4.3 South Korea Self-Service BI Market by Enterprise Type
- 10.3.6.4.4 South Korea Self-Service BI Market by Application
- 10.3.6.4.5 South Korea Self-Service BI Market by Vertical
- 10.3.6.5 Singapore Self-Service BI Market
- 10.3.6.5.1 Singapore Self-Service BI Market by Component
- 10.3.6.5.2 Singapore Self-Service BI Market by Deployment
- 10.3.6.5.3 Singapore Self-Service BI Market by Enterprise Type
- 10.3.6.5.4 Singapore Self-Service BI Market by Application
- 10.3.6.5.5 Singapore Self-Service BI Market by Vertical
- 10.3.6.6 Malaysia Self-Service BI Market
- 10.3.6.6.1 Malaysia Self-Service BI Market by Component
- 10.3.6.6.2 Malaysia Self-Service BI Market by Deployment
- 10.3.6.6.3 Malaysia Self-Service BI Market by Enterprise Type
- 10.3.6.6.4 Malaysia Self-Service BI Market by Application
- 10.3.6.6.5 Malaysia Self-Service BI Market by Vertical
- 10.3.6.7 Rest of Asia Pacific Self-Service BI Market
- 10.3.6.7.1 Rest of Asia Pacific Self-Service BI Market by Component
- 10.3.6.7.2 Rest of Asia Pacific Self-Service BI Market by Deployment
- 10.3.6.7.3 Rest of Asia Pacific Self-Service BI Market by Enterprise Type
- 10.3.6.7.4 Rest of Asia Pacific Self-Service BI Market by Application
- 10.3.6.7.5 Rest of Asia Pacific Self-Service BI Market by Vertical
- 10.3.6.1 China Self-Service BI Market
- 10.3.1 Asia Pacific Self-Service BI Market by Component
- 10.4 LAMEA Self-Service BI Market
- 10.4.1 LAMEA Self-Service BI Market by Component
- 10.4.1.1 LAMEA Software Market by Country
- 10.4.1.2 LAMEA Services Market by Country
- 10.4.2 LAMEA Self-Service BI Market by Deployment
- 10.4.2.1 LAMEA On-Premise Market by Country
- 10.4.2.2 LAMEA Cloud Market by Country
- 10.4.3 LAMEA Self-Service BI Market by Enterprise Type
- 10.4.3.1 LAMEA Large Enterprises Market by Country
- 10.4.3.2 LAMEA Small & Medium Enterprises Market by Country
- 10.4.4 LAMEA Self-Service BI Market by Application
- 10.4.4.1 LAMEA Fraud & Security Management Market by Country
- 10.4.4.2 LAMEA Sales & Marketing Market by Country
- 10.4.4.3 LAMEA Customer Engagement & Analysis Market by Country
- 10.4.4.4 LAMEA Supply Chain Management & Procurement Market by Country
- 10.4.4.5 LAMEA Operations Management Market by Country
- 10.4.4.6 LAMEA Risk & Compliance Management Market by Country
- 10.4.4.7 LAMEA Predictive Asset Maintenance & Others Market by Country
- 10.4.5 LAMEA Self-Service BI Market by Vertical
- 10.4.5.1 LAMEA BFSI Market by Country
- 10.4.5.2 LAMEA Manufacturing Market by Country
- 10.4.5.3 LAMEA Transportation Market by Country
- 10.4.5.4 LAMEA Energy & Utilities Market by Country
- 10.4.5.5 LAMEA IT & Telecom Market by Country
- 10.4.5.6 LAMEA Retail & Ecommerce Market by Country
- 10.4.5.7 LAMEA Healthcare & Lifesciences Market by Country
- 10.4.5.8 LAMEA Others Market by Country
- 10.4.6 LAMEA Self-Service BI Market by Country
- 10.4.6.1 Brazil Self-Service BI Market
- 10.4.6.1.1 Brazil Self-Service BI Market by Component
- 10.4.6.1.2 Brazil Self-Service BI Market by Deployment
- 10.4.6.1.3 Brazil Self-Service BI Market by Enterprise Type
- 10.4.6.1.4 Brazil Self-Service BI Market by Application
- 10.4.6.1.5 Brazil Self-Service BI Market by Vertical
- 10.4.6.2 Argentina Self-Service BI Market
- 10.4.6.2.1 Argentina Self-Service BI Market by Component
- 10.4.6.2.2 Argentina Self-Service BI Market by Deployment
- 10.4.6.2.3 Argentina Self-Service BI Market by Enterprise Type
- 10.4.6.2.4 Argentina Self-Service BI Market by Application
- 10.4.6.2.5 Argentina Self-Service BI Market by Vertical
- 10.4.6.3 UAE Self-Service BI Market
- 10.4.6.3.1 UAE Self-Service BI Market by Component
- 10.4.6.3.2 UAE Self-Service BI Market by Deployment
- 10.4.6.3.3 UAE Self-Service BI Market by Enterprise Type
- 10.4.6.3.4 UAE Self-Service BI Market by Application
- 10.4.6.3.5 UAE Self-Service BI Market by Vertical
- 10.4.6.4 Saudi Arabia Self-Service BI Market
- 10.4.6.4.1 Saudi Arabia Self-Service BI Market by Component
- 10.4.6.4.2 Saudi Arabia Self-Service BI Market by Deployment
- 10.4.6.4.3 Saudi Arabia Self-Service BI Market by Enterprise Type
- 10.4.6.4.4 Saudi Arabia Self-Service BI Market by Application
- 10.4.6.4.5 Saudi Arabia Self-Service BI Market by Vertical
- 10.4.6.5 South Africa Self-Service BI Market
- 10.4.6.5.1 South Africa Self-Service BI Market by Component
- 10.4.6.5.2 South Africa Self-Service BI Market by Deployment
- 10.4.6.5.3 South Africa Self-Service BI Market by Enterprise Type
- 10.4.6.5.4 South Africa Self-Service BI Market by Application
- 10.4.6.5.5 South Africa Self-Service BI Market by Vertical
- 10.4.6.6 Nigeria Self-Service BI Market
- 10.4.6.6.1 Nigeria Self-Service BI Market by Component
- 10.4.6.6.2 Nigeria Self-Service BI Market by Deployment
- 10.4.6.6.3 Nigeria Self-Service BI Market by Enterprise Type
- 10.4.6.6.4 Nigeria Self-Service BI Market by Application
- 10.4.6.6.5 Nigeria Self-Service BI Market by Vertical
- 10.4.6.7 Rest of LAMEA Self-Service BI Market
- 10.4.6.7.1 Rest of LAMEA Self-Service BI Market by Component
- 10.4.6.7.2 Rest of LAMEA Self-Service BI Market by Deployment
- 10.4.6.7.3 Rest of LAMEA Self-Service BI Market by Enterprise Type
- 10.4.6.7.4 Rest of LAMEA Self-Service BI Market by Application
- 10.4.6.7.5 Rest of LAMEA Self-Service BI Market by Vertical
- 10.4.6.1 Brazil Self-Service BI Market
- 10.4.1 LAMEA Self-Service BI Market by Component
Chapter 11. Company Profiles
- 11.1 Microsoft Corporation
- 11.1.1 Company Overview
- 11.1.2 Financial Analysis
- 11.1.3 Segmental and Regional Analysis
- 11.1.4 Research & Development Expenses
- 11.1.5 SWOT Analysis
- 11.2 Oracle Corporation
- 11.2.1 Company Overview
- 11.2.2 Financial Analysis
- 11.2.3 Segmental and Regional Analysis
- 11.2.4 Research & Development Expense
- 11.2.5 SWOT Analysis
- 11.3 IBM Corporation
- 11.3.1 Company Overview
- 11.3.2 Financial Analysis
- 11.3.3 Segmental and Regional Analysis
- 11.3.4 Research & Development Expenses
- 11.3.5 Recent strategies and developments:
- 11.3.5.1 Product Launches and Product Expansions:
- 11.3.6 SWOT Analysis
- 11.4 SAP SE
- 11.4.1 Company Overview
- 11.4.2 Financial Analysis
- 11.4.3 Segmental and Regional Analysis
- 11.4.4 Research & Development Expense
- 11.4.5 SWOT Analysis
- 11.5 ThoughtSpot, Inc.
- 11.5.1 Company Overview
- 11.5.2 Recent strategies and developments:
- 11.5.2.1 Acquisition and Mergers:
- 11.5.3 SWOT Analysis
- 11.6 Zoho Corporation Pvt. Ltd.
- 11.6.1 Company Overview
- 11.6.2 Recent strategies and developments:
- 11.6.2.1 Product Launches and Product Expansions:
- 11.6.3 SWOT Analysis
- 11.7 Domo, Inc
- 11.7.1 Company Overview
- 11.7.2 Financial Analysis
- 11.7.3 Regional Analysis
- 11.7.4 Research & Development Expenses
- 11.7.5 SWOT Analysis
- 11.8 QlikTech International AB
- 11.8.1 Company Overview
- 11.8.2 Recent strategies and developments:
- 11.8.2.1 Product Launches and Product Expansions:
- 11.8.2.2 Acquisition and Mergers:
- 11.8.3 SWOT Analysis
- 11.9 MicroStrategy, Inc.
- 11.9.1 Company Overview
- 11.9.2 Financial Analysis
- 11.9.3 Regional Analysis
- 11.9.4 Research & Development Expenses
- 11.9.5 Recent strategies and developments:
- 11.9.5.1 Partnerships, Collaborations, and Agreements:
- 11.9.6 SWOT Analysis
- 11.10. Salesforce, Inc. (Tableau Software, LLC)
- 11.10.1 Company Overview
- 11.10.2 Financial Analysis
- 11.10.3 Regional Analysis
- 11.10.4 Research & Development Expense
- 11.10.4.1 Acquisition and Mergers:
- 11.10.5 SWOT Analysis
