|
|
市場調査レポート
商品コード
1353064
バターパウダーの世界市場規模、シェア、産業動向分析レポート:供給源別、流通チャネル別、地域別展望と予測、2023年~2030年Global Butter Powder Market Size, Share & Industry Trends Analysis Report By Source (Milk, Peanut, Almond, Cocoa and Others), By Distribution Channel, By Regional Outlook and Forecast, 2023 - 2030 |
||||||
|
|
|||||||


| バターパウダーの世界市場規模、シェア、産業動向分析レポート:供給源別、流通チャネル別、地域別展望と予測、2023年~2030年 |
|
出版日: 2023年08月31日
発行: KBV Research
ページ情報: 英文 294 Pages
納期: 即納可能
|
- 全表示
- 概要
- 図表
- 目次
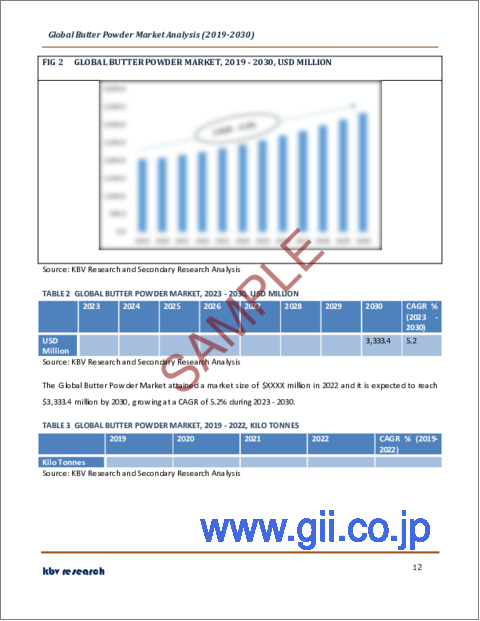
バターパウダー市場規模は、予測期間中にCAGR 5.2%で成長し、2030年には33億米ドルに達すると予測されます。2022年の市場規模は222.2キロ・トンに達し、4.6%の成長率を記録する(2019-2022年)。
バターパウダーは、基本的には脱水バターであるが、その加工や添加成分によって、消費者の間で健康上の懸念が生じる可能性があります。通常のバターと同様、バターパウダーは飽和脂肪酸の供給源であり、これを多く摂取すると血中のLDL(悪玉コレステロール)値が上昇し、心臓病や脳卒中の可能性が高まる可能性があります。通常のバターより賞味期限は長いが、開封後は適切に保存しないと腐敗する恐れがあります。従って、これらの要因はすべて、今後数年間の市場の成長を妨げる可能性があります。
ソース別の展望
ソースに基づき、市場はミルク、ピーナッツ、アーモンド、ココア、その他に区分されます。2022年には、ピーナッツ・セグメントが市場で大きな収益シェアを獲得しました。ピーナツバターは通常のピーナツバターより脂肪分が85~90%少なく、優れた代用品であることが証明されています。さらに、食物繊維、タンパク質、ビタミン、ミネラルを豊富に含むため、栄養価の高い選択肢となります。より健康的な選択肢を探すとき、消費者はピーナッツバターパウダーをよく選ぶ。さらに、コレステロールの摂取を制限しながらピーナッツバターの魅力的な風味を望む消費者にとっては、優れた選択肢です。さらに、ビーガン(完全菜食主義者)や植物ベースの食生活の普及が、このセグメントの売上を伸ばしています。
流通チャネルの展望
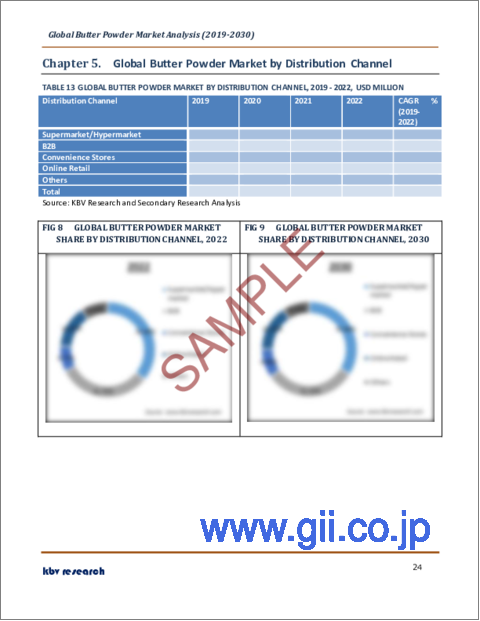
流通チャネル別に見ると、市場はスーパーマーケット/ハイパーマーケット、コンビニエンスストア、B2B、専門店、オンライン小売に分類されます。2022年には、スーパーマーケット/ハイパーマーケット部門が最大の売上シェアで市場を独占しました。ほとんどの調理・料理用製品はスーパーマーケットのような大型小売店から購入されます。バターパウダー製品の品揃えが豊富なため、スーパーマーケットはバターパウダーを購入する最も一般的な場所です。販売されているバターパウダーは様々なブランドから提供されており、風味も様々です。お菓子や料理に加えて、健康コーナーでもバターパウダーを扱っています。その結果、消費者にとっては、一箇所で購入が完了し、時間を節約できるため、この市場は魅力的です。
地域別展望
地域別に見ると、市場は北米、欧州、アジア太平洋、LAMEAで分析されます。北米地域は、2022年の同市場における最大収益シェアを示しました。北米市場の継続的な拡大により、売上は大幅に増加しています。同地域では、ペストリーや料理製品に関する消費者行動に大きな変化が生じています。さらに、料理用製品を使用する北米の消費者の増加がかなりの需要を生み出しています。バターパウダーの健康効果が広く知られるようになり、製パン・料理用品の需要が増加しています。
目次
第1章 市場範囲と調査手法
- 市場の定義
- 目的
- 市場範囲
- セグメンテーション
- 調査手法
第2章 市場の概要
- 主なハイライト
第3章 市場概要
- イントロダクション
- 概要
- 市場構成とシナリオ
- 概要
- 市場に影響を与える主な要因
- 市場促進要因
- 市場抑制要因
- ポーターファイブフォース分析
第4章 世界のバターパウダー市場:ソース別
- 世界の牛乳市場:地域別
- 世界のピーナッツ市場:地域別
- 世界のアーモンド市場:地域別
- 世界のカカオ市場:地域別
- 世界のその他の市場:地域別
第5章 世界のバターパウダー市場:流通チャネル別
- 世界のスーパーマーケット/ハイパーマーケット市場:地域別
- 世界のB2B市場:地域別
- 世界のコンビニエンスストア市場:地域別
- 世界のオンライン小売市場:地域別
- 世界のその他の市場:地域別
第6章 世界のバターパウダー市場:地域別
- 北米
- 北米の市場:国別
- 米国
- カナダ
- メキシコ
- その他北米地域
- 北米の市場:国別
- 欧州
- 欧州の市場:国別
- ドイツ
- 英国
- フランス
- ロシア
- スペイン
- イタリア
- その他欧州地域
- 欧州の市場:国別
- アジア太平洋
- アジア太平洋の市場:国別
- 中国
- 日本
- インド
- 韓国
- シンガポール
- マレーシア
- その他アジア太平洋地域
- アジア太平洋の市場:国別
- ラテンアメリカ・中東・アフリカ
- ラテンアメリカ・中東・アフリカの市場:国別
- ブラジル
- アルゼンチン
- アラブ首長国連邦
- サウジアラビア
- 南アフリカ
- ナイジェリア
- その他ラテンアメリカ・中東・アフリカ地域
- ラテンアメリカ・中東・アフリカの市場:国別
第7章 企業プロファイル
- Nutrient Survival
- Betty Lou's Inc
- Garden of Life, LLC(Nestle SA)
- PB2 Foods, Inc(Bell Plantation Inc.)
- Z Natural Foods LLC
- Powbab, Inc
- BetterBody Foods
- Kanegrade Ltd
- Nutricost(ESUPPLEMENTS, LLC)
- Hoosier Hill Farm LLC(Saco Foods)
第8章 バターパウダー市場の勝利の必須条件
LIST OF TABLES
- TABLE 1 Global Butter Powder Market, 2019 - 2022, USD Million
- TABLE 2 Global Butter Powder Market, 2023 - 2030, USD Million
- TABLE 3 Global Butter Powder Market, 2019 - 2022, Kilo Tonnes
- TABLE 4 Global Butter Powder Market, 2023 - 2030, Kilo Tonnes
- TABLE 5 Global Butter Powder Market by Source, 2019 - 2022, USD Million
- TABLE 6 Global Butter Powder Market by Source, 2023 - 2030, USD Million
- TABLE 7 Global Butter Powder Market by Source, 2019 - 2022, Kilo Tonnes
- TABLE 8 Global Butter Powder Market by Source, 2023 - 2030, Kilo Tonnes
- TABLE 9 Global Milk Market by Region, 2019 - 2022, USD Million
- TABLE 10 Global Milk Market by Region, 2023 - 2030, USD Million
- TABLE 11 Global Milk Market by Region, 2019 - 2022, Kilo Tonnes
- TABLE 12 Global Milk Market by Region, 2023 - 2030, Kilo Tonnes
- TABLE 13 Global Peanut Market by Region, 2019 - 2022, USD Million
- TABLE 14 Global Peanut Market by Region, 2023 - 2030, USD Million
- TABLE 15 Global Peanut Market by Region, 2019 - 2022, Kilo Tonnes
- TABLE 16 Global Peanut Market by Region, 2023 - 2030, Kilo Tonnes
- TABLE 17 Global Almond Market by Region, 2019 - 2022, USD Million
- TABLE 18 Global Almond Market by Region, 2023 - 2030, USD Million
- TABLE 19 Global Almond Market by Region, 2019 - 2022, Kilo Tonnes
- TABLE 20 Global Almond Market by Region, 2023 - 2030, Kilo Tonnes
- TABLE 21 Global Cocoa Market by Region, 2019 - 2022, USD Million
- TABLE 22 Global Cocoa Market by Region, 2023 - 2030, USD Million
- TABLE 23 Global Cocoa Market by Region, 2019 - 2022, Kilo Tonnes
- TABLE 24 Global Cocoa Market by Region, 2023 - 2030, Kilo Tonnes
- TABLE 25 Global Others Market by Region, 2019 - 2022, USD Million
- TABLE 26 Global Others Market by Region, 2023 - 2030, USD Million
- TABLE 27 Global Others Market by Region, 2019 - 2022, Kilo Tonnes
- TABLE 28 Global Others Market by Region, 2023 - 2030, Kilo Tonnes
- TABLE 29 Global Butter Powder Market by Distribution Channel, 2019 - 2022, USD Million
- TABLE 30 Global Butter Powder Market by Distribution Channel, 2023 - 2030, USD Million
- TABLE 31 Global Butter Powder Market by Distribution Channel, 2019 - 2022, Kilo Tonnes
- TABLE 32 Global Butter Powder Market by Distribution Channel, 2023 - 2030, Kilo Tonnes
- TABLE 33 Global Supermarket/Hypermarket Market by Region, 2019 - 2022, USD Million
- TABLE 34 Global Supermarket/Hypermarket Market by Region, 2023 - 2030, USD Million
- TABLE 35 Global Supermarket/Hypermarket Market by Region, 2019 - 2022, Kilo Tonnes
- TABLE 36 Global Supermarket/Hypermarket Market by Region, 2023 - 2030, Kilo Tonnes
- TABLE 37 Global B2B Market by Region, 2019 - 2022, USD Million
- TABLE 38 Global B2B Market by Region, 2023 - 2030, USD Million
- TABLE 39 Global B2B Market by Region, 2019 - 2022, Kilo Tonnes
- TABLE 40 Global B2B Market by Region, 2023 - 2030, Kilo Tonnes
- TABLE 41 Global Convenience Stores Market by Region, 2019 - 2022, USD Million
- TABLE 42 Global Convenience Stores Market by Region, 2023 - 2030, USD Million
- TABLE 43 Global Convenience Stores Market by Region, 2019 - 2022, Kilo Tonnes
- TABLE 44 Global Convenience Stores Market by Region, 2023 - 2030, Kilo Tonnes
- TABLE 45 Global Online Retail Market by Region, 2019 - 2022, USD Million
- TABLE 46 Global Online Retail Market by Region, 2023 - 2030, USD Million
- TABLE 47 Global Online Retail Market by Region, 2019 - 2022, Kilo Tonnes
- TABLE 48 Global Online Retail Market by Region, 2023 - 2030, Kilo Tonnes
- TABLE 49 Global Others Market by Region, 2019 - 2022, USD Million
- TABLE 50 Global Others Market by Region, 2023 - 2030, USD Million
- TABLE 51 Global Others Market by Region, 2019 - 2022, Kilo Tonnes
- TABLE 52 Global Others Market by Region, 2023 - 2030, Kilo Tonnes
- TABLE 53 Global Butter Powder Market by Region, 2019 - 2022, USD Million
- TABLE 54 Global Butter Powder Market by Region, 2023 - 2030, USD Million
- TABLE 55 Global Butter Powder Market by Region, 2019 - 2022, Kilo Tonnes
- TABLE 56 Global Butter Powder Market by Region, 2023 - 2030, Kilo Tonnes
- TABLE 57 North America Butter Powder Market, 2019 - 2022, USD Million
- TABLE 58 North America Butter Powder Market, 2023 - 2030, USD Million
- TABLE 59 North America Butter Powder Market, 2019 - 2022, Kilo Tonnes
- TABLE 60 North America Butter Powder Market, 2023 - 2030, Kilo Tonnes
- TABLE 61 North America Butter Powder Market by Source, 2019 - 2022, USD Million
- TABLE 62 North America Butter Powder Market by Source, 2023 - 2030, USD Million
- TABLE 63 North America Butter Powder Market by Source, 2019 - 2022, Kilo Tonnes
- TABLE 64 North America Butter Powder Market by Source, 2023 - 2030, Kilo Tonnes
- TABLE 65 North America Milk Market by Country, 2019 - 2022, USD Million
- TABLE 66 North America Milk Market by Country, 2023 - 2030, USD Million
- TABLE 67 North America Milk Market by Country, 2019 - 2022, Kilo Tonnes
- TABLE 68 North America Milk Market by Country, 2023 - 2030, Kilo Tonnes
- TABLE 69 North America Peanut Market by Country, 2019 - 2022, USD Million
- TABLE 70 North America Peanut Market by Country, 2023 - 2030, USD Million
- TABLE 71 North America Peanut Market by Country, 2019 - 2022, Kilo Tonnes
- TABLE 72 North America Peanut Market by Country, 2023 - 2030, Kilo Tonnes
- TABLE 73 North America Almond Market by Country, 2019 - 2022, USD Million
- TABLE 74 North America Almond Market by Country, 2023 - 2030, USD Million
- TABLE 75 North America Almond Market by Country, 2019 - 2022, Kilo Tonnes
- TABLE 76 North America Almond Market by Country, 2023 - 2030, Kilo Tonnes
- TABLE 77 North America Cocoa Market by Country, 2019 - 2022, USD Million
- TABLE 78 North America Cocoa Market by Country, 2023 - 2030, USD Million
- TABLE 79 North America Cocoa Market by Country, 2019 - 2022, Kilo Tonnes
- TABLE 80 North America Cocoa Market by Country, 2023 - 2030, Kilo Tonnes
- TABLE 81 North America Others Market by Country, 2019 - 2022, USD Million
- TABLE 82 North America Others Market by Country, 2023 - 2030, USD Million
- TABLE 83 North America Others Market by Country, 2019 - 2022, Kilo Tonnes
- TABLE 84 North America Others Market by Country, 2023 - 2030, Kilo Tonnes
- TABLE 85 North America Butter Powder Market by Distribution Channel, 2019 - 2022, USD Million
- TABLE 86 North America Butter Powder Market by Distribution Channel, 2023 - 2030, USD Million
- TABLE 87 North America Butter Powder Market by Distribution Channel, 2019 - 2022, Kilo Tonnes
- TABLE 88 North America Butter Powder Market by Distribution Channel, 2023 - 2030, Kilo Tonnes
- TABLE 89 North America Supermarket/Hypermarket Market by Country, 2019 - 2022, USD Million
- TABLE 90 North America Supermarket/Hypermarket Market by Country, 2023 - 2030, USD Million
- TABLE 91 North America Supermarket/Hypermarket Market by Country, 2019 - 2022, Kilo Tonnes
- TABLE 92 North America Supermarket/Hypermarket Market by Country, 2023 - 2030, Kilo Tonnes
- TABLE 93 North America B2B Market by Country, 2019 - 2022, USD Million
- TABLE 94 North America B2B Market by Country, 2023 - 2030, USD Million
- TABLE 95 North America B2B Market by Country, 2019 - 2022, Kilo Tonnes
- TABLE 96 North America B2B Market by Country, 2023 - 2030, Kilo Tonnes
- TABLE 97 North America Convenience Stores Market by Country, 2019 - 2022, USD Million
- TABLE 98 North America Convenience Stores Market by Country, 2023 - 2030, USD Million
- TABLE 99 North America Convenience Stores Market by Country, 2019 - 2022, Kilo Tonnes
- TABLE 100 North America Convenience Stores Market by Country, 2023 - 2030, Kilo Tonnes
- TABLE 101 North America Online Retail Market by Country, 2019 - 2022, USD Million
- TABLE 102 North America Online Retail Market by Country, 2023 - 2030, USD Million
- TABLE 103 North America Online Retail Market by Country, 2019 - 2022, Kilo Tonnes
- TABLE 104 North America Online Retail Market by Country, 2023 - 2030, Kilo Tonnes
- TABLE 105 North America Others Market by Country, 2019 - 2022, USD Million
- TABLE 106 North America Others Market by Country, 2023 - 2030, USD Million
- TABLE 107 North America Others Market by Country, 2019 - 2022, Kilo Tonnes
- TABLE 108 North America Others Market by Country, 2023 - 2030, Kilo Tonnes
- TABLE 109 North America Butter Powder Market by Country, 2019 - 2022, USD Million
- TABLE 110 North America Butter Powder Market by Country, 2023 - 2030, USD Million
- TABLE 111 North America Butter Powder Market by Country, 2019 - 2022, Kilo Tonnes
- TABLE 112 North America Butter Powder Market by Country, 2023 - 2030, Kilo Tonnes
- TABLE 113 US Butter Powder Market, 2019 - 2022, USD Million
- TABLE 114 US Butter Powder Market, 2023 - 2030, USD Million
- TABLE 115 US Butter Powder Market, 2019 - 2022, Kilo Tonnes
- TABLE 116 US Butter Powder Market, 2023 - 2030, Kilo Tonnes
- TABLE 117 US Butter Powder Market by Source, 2019 - 2022, USD Million
- TABLE 118 US Butter Powder Market by Source, 2023 - 2030, USD Million
- TABLE 119 US Butter Powder Market by Source, 2019 - 2022, Kilo Tonnes
- TABLE 120 US Butter Powder Market by Source, 2023 - 2030, Kilo Tonnes
- TABLE 121 US Butter Powder Market by Distribution Channel, 2019 - 2022, USD Million
- TABLE 122 US Butter Powder Market by Distribution Channel, 2023 - 2030, USD Million
- TABLE 123 US Butter Powder Market by Distribution Channel, 2019 - 2022, Kilo Tonnes
- TABLE 124 US Butter Powder Market by Distribution Channel, 2023 - 2030, Kilo Tonnes
- TABLE 125 Canada Butter Powder Market, 2019 - 2022, USD Million
- TABLE 126 Canada Butter Powder Market, 2023 - 2030, USD Million
- TABLE 127 Canada Butter Powder Market, 2019 - 2022, Kilo Tonnes
- TABLE 128 Canada Butter Powder Market, 2023 - 2030, Kilo Tonnes
- TABLE 129 Canada Butter Powder Market by Source, 2019 - 2022, USD Million
- TABLE 130 Canada Butter Powder Market by Source, 2023 - 2030, USD Million
- TABLE 131 Canada Butter Powder Market by Source, 2019 - 2022, Kilo Tonnes
- TABLE 132 Canada Butter Powder Market by Source, 2023 - 2030, Kilo Tonnes
- TABLE 133 Canada Butter Powder Market by Distribution Channel, 2019 - 2022, USD Million
- TABLE 134 Canada Butter Powder Market by Distribution Channel, 2023 - 2030, USD Million
- TABLE 135 Canada Butter Powder Market by Distribution Channel, 2019 - 2022, Kilo Tonnes
- TABLE 136 Canada Butter Powder Market by Distribution Channel, 2023 - 2030, Kilo Tonnes
- TABLE 137 Mexico Butter Powder Market, 2019 - 2022, USD Million
- TABLE 138 Mexico Butter Powder Market, 2023 - 2030, USD Million
- TABLE 139 Mexico Butter Powder Market, 2019 - 2022, Kilo Tonnes
- TABLE 140 Mexico Butter Powder Market, 2023 - 2030, Kilo Tonnes
- TABLE 141 Mexico Butter Powder Market by Source, 2019 - 2022, USD Million
- TABLE 142 Mexico Butter Powder Market by Source, 2023 - 2030, USD Million
- TABLE 143 Mexico Butter Powder Market by Source, 2019 - 2022, Kilo Tonnes
- TABLE 144 Mexico Butter Powder Market by Source, 2023 - 2030, Kilo Tonnes
- TABLE 145 Mexico Butter Powder Market by Distribution Channel, 2019 - 2022, USD Million
- TABLE 146 Mexico Butter Powder Market by Distribution Channel, 2023 - 2030, USD Million
- TABLE 147 Mexico Butter Powder Market by Distribution Channel, 2019 - 2022, Kilo Tonnes
- TABLE 148 Mexico Butter Powder Market by Distribution Channel, 2023 - 2030, Kilo Tonnes
- TABLE 149 Rest of North America Butter Powder Market, 2019 - 2022, USD Million
- TABLE 150 Rest of North America Butter Powder Market, 2023 - 2030, USD Million
- TABLE 151 Rest of North America Butter Powder Market, 2019 - 2022, Kilo Tonnes
- TABLE 152 Rest of North America Butter Powder Market, 2023 - 2030, Kilo Tonnes
- TABLE 153 Rest of North America Butter Powder Market by Source, 2019 - 2022, USD Million
- TABLE 154 Rest of North America Butter Powder Market by Source, 2023 - 2030, USD Million
- TABLE 155 Rest of North America Butter Powder Market by Source, 2019 - 2022, Kilo Tonnes
- TABLE 156 Rest of North America Butter Powder Market by Source, 2023 - 2030, Kilo Tonnes
- TABLE 157 Rest of North America Butter Powder Market by Distribution Channel, 2019 - 2022, USD Million
- TABLE 158 Rest of North America Butter Powder Market by Distribution Channel, 2023 - 2030, USD Million
- TABLE 159 Rest of North America Butter Powder Market by Distribution Channel, 2019 - 2022, Kilo Tonnes
- TABLE 160 Rest of North America Butter Powder Market by Distribution Channel, 2023 - 2030, Kilo Tonnes
- TABLE 161 Europe Butter Powder Market, 2019 - 2022, USD Million
- TABLE 162 Europe Butter Powder Market, 2023 - 2030, USD Million
- TABLE 163 Europe Butter Powder Market, 2019 - 2022, Kilo Tonnes
- TABLE 164 Europe Butter Powder Market, 2023 - 2030, Kilo Tonnes
- TABLE 165 Europe Butter Powder Market by Source, 2019 - 2022, USD Million
- TABLE 166 Europe Butter Powder Market by Source, 2023 - 2030, USD Million
- TABLE 167 Europe Butter Powder Market by Source, 2019 - 2022, Kilo Tonnes
- TABLE 168 Europe Butter Powder Market by Source, 2023 - 2030, Kilo Tonnes
- TABLE 169 Europe Milk Market by Country, 2019 - 2022, USD Million
- TABLE 170 Europe Milk Market by Country, 2023 - 2030, USD Million
- TABLE 171 Europe Milk Market by Country, 2019 - 2022, Kilo Tonnes
- TABLE 172 Europe Milk Market by Country, 2023 - 2030, Kilo Tonnes
- TABLE 173 Europe Peanut Market by Country, 2019 - 2022, USD Million
- TABLE 174 Europe Peanut Market by Country, 2023 - 2030, USD Million
- TABLE 175 Europe Peanut Market by Country, 2019 - 2022, Kilo Tonnes
- TABLE 176 Europe Peanut Market by Country, 2023 - 2030, Kilo Tonnes
- TABLE 177 Europe Almond Market by Country, 2019 - 2022, USD Million
- TABLE 178 Europe Almond Market by Country, 2023 - 2030, USD Million
- TABLE 179 Europe Almond Market by Country, 2019 - 2022, Kilo Tonnes
- TABLE 180 Europe Almond Market by Country, 2023 - 2030, Kilo Tonnes
- TABLE 181 Europe Cocoa Market by Country, 2019 - 2022, USD Million
- TABLE 182 Europe Cocoa Market by Country, 2023 - 2030, USD Million
- TABLE 183 Europe Cocoa Market by Country, 2019 - 2022, Kilo Tonnes
- TABLE 184 Europe Cocoa Market by Country, 2023 - 2030, Kilo Tonnes
- TABLE 185 Europe Others Market by Country, 2019 - 2022, USD Million
- TABLE 186 Europe Others Market by Country, 2023 - 2030, USD Million
- TABLE 187 Europe Others Market by Country, 2019 - 2022, Kilo Tonnes
- TABLE 188 Europe Others Market by Country, 2023 - 2030, Kilo Tonnes
- TABLE 189 Europe Butter Powder Market by Distribution Channel, 2019 - 2022, USD Million
- TABLE 190 Europe Butter Powder Market by Distribution Channel, 2023 - 2030, USD Million
- TABLE 191 Europe Butter Powder Market by Distribution Channel, 2019 - 2022, Kilo Tonnes
- TABLE 192 Europe Butter Powder Market by Distribution Channel, 2023 - 2030, Kilo Tonnes
- TABLE 193 Europe Supermarket/Hypermarket Market by Country, 2019 - 2022, USD Million
- TABLE 194 Europe Supermarket/Hypermarket Market by Country, 2023 - 2030, USD Million
- TABLE 195 Europe Supermarket/Hypermarket Market by Country, 2019 - 2022, Kilo Tonnes
- TABLE 196 Europe Supermarket/Hypermarket Market by Country, 2023 - 2030, Kilo Tonnes
- TABLE 197 Europe B2B Market by Country, 2019 - 2022, USD Million
- TABLE 198 Europe B2B Market by Country, 2023 - 2030, USD Million
- TABLE 199 Europe B2B Market by Country, 2019 - 2022, Kilo Tonnes
- TABLE 200 Europe B2B Market by Country, 2023 - 2030, Kilo Tonnes
- TABLE 201 Europe Convenience Stores Market by Country, 2019 - 2022, USD Million
- TABLE 202 Europe Convenience Stores Market by Country, 2023 - 2030, USD Million
- TABLE 203 Europe Convenience Stores Market by Country, 2019 - 2022, Kilo Tonnes
- TABLE 204 Europe Convenience Stores Market by Country, 2023 - 2030, Kilo Tonnes
- TABLE 205 Europe Online Retail Market by Country, 2019 - 2022, USD Million
- TABLE 206 Europe Online Retail Market by Country, 2023 - 2030, USD Million
- TABLE 207 Europe Online Retail Market by Country, 2019 - 2022, Kilo Tonnes
- TABLE 208 Europe Online Retail Market by Country, 2023 - 2030, Kilo Tonnes
- TABLE 209 Europe Others Market by Country, 2019 - 2022, USD Million
- TABLE 210 Europe Others Market by Country, 2023 - 2030, USD Million
- TABLE 211 Europe Others Market by Country, 2019 - 2022, Kilo Tonnes
- TABLE 212 Europe Others Market by Country, 2023 - 2030, Kilo Tonnes
- TABLE 213 Europe Butter Powder Market by Country, 2019 - 2022, USD Million
- TABLE 214 Europe Butter Powder Market by Country, 2023 - 2030, USD Million
- TABLE 215 Europe Butter Powder Market by Country, 2019 - 2022, Kilo Tonnes
- TABLE 216 Europe Butter Powder Market by Country, 2023 - 2030, Kilo Tonnes
- TABLE 217 Germany Butter Powder Market, 2019 - 2022, USD Million
- TABLE 218 Germany Butter Powder Market, 2023 - 2030, USD Million
- TABLE 219 Germany Butter Powder Market, 2019 - 2022, Kilo Tonnes
- TABLE 220 Germany Butter Powder Market, 2023 - 2030, Kilo Tonnes
- TABLE 221 Germany Butter Powder Market by Source, 2019 - 2022, USD Million
- TABLE 222 Germany Butter Powder Market by Source, 2023 - 2030, USD Million
- TABLE 223 Germany Butter Powder Market by Source, 2019 - 2022, Kilo Tonnes
- TABLE 224 Germany Butter Powder Market by Source, 2023 - 2030, Kilo Tonnes
- TABLE 225 Germany Butter Powder Market by Distribution Channel, 2019 - 2022, USD Million
- TABLE 226 Germany Butter Powder Market by Distribution Channel, 2023 - 2030, USD Million
- TABLE 227 Germany Butter Powder Market by Distribution Channel, 2019 - 2022, Kilo Tonnes
- TABLE 228 Germany Butter Powder Market by Distribution Channel, 2023 - 2030, Kilo Tonnes
- TABLE 229 UK Butter Powder Market, 2019 - 2022, USD Million
- TABLE 230 UK Butter Powder Market, 2023 - 2030, USD Million
- TABLE 231 UK Butter Powder Market, 2019 - 2022, Kilo Tonnes
- TABLE 232 UK Butter Powder Market, 2023 - 2030, Kilo Tonnes
- TABLE 233 UK Butter Powder Market by Source, 2019 - 2022, USD Million
- TABLE 234 UK Butter Powder Market by Source, 2023 - 2030, USD Million
- TABLE 235 UK Butter Powder Market by Source, 2019 - 2022, Kilo Tonnes
- TABLE 236 UK Butter Powder Market by Source, 2023 - 2030, Kilo Tonnes
- TABLE 237 UK Butter Powder Market by Distribution Channel, 2019 - 2022, USD Million
- TABLE 238 UK Butter Powder Market by Distribution Channel, 2023 - 2030, USD Million
- TABLE 239 UK Butter Powder Market by Distribution Channel, 2019 - 2022, Kilo Tonnes
- TABLE 240 UK Butter Powder Market by Distribution Channel, 2023 - 2030, Kilo Tonnes
- TABLE 241 France Butter Powder Market, 2019 - 2022, USD Million
- TABLE 242 France Butter Powder Market, 2023 - 2030, USD Million
- TABLE 243 France Butter Powder Market, 2019 - 2022, Kilo Tonnes
- TABLE 244 France Butter Powder Market, 2023 - 2030, Kilo Tonnes
- TABLE 245 France Butter Powder Market by Source, 2019 - 2022, USD Million
- TABLE 246 France Butter Powder Market by Source, 2023 - 2030, USD Million
- TABLE 247 France Butter Powder Market by Source, 2019 - 2022, Kilo Tonnes
- TABLE 248 France Butter Powder Market by Source, 2023 - 2030, Kilo Tonnes
- TABLE 249 France Butter Powder Market by Distribution Channel, 2019 - 2022, USD Million
- TABLE 250 France Butter Powder Market by Distribution Channel, 2023 - 2030, USD Million
- TABLE 251 France Butter Powder Market by Distribution Channel, 2019 - 2022, Kilo Tonnes
- TABLE 252 France Butter Powder Market by Distribution Channel, 2023 - 2030, Kilo Tonnes
- TABLE 253 Russia Butter Powder Market, 2019 - 2022, USD Million
- TABLE 254 Russia Butter Powder Market, 2023 - 2030, USD Million
- TABLE 255 Russia Butter Powder Market, 2019 - 2022, Kilo Tonnes
- TABLE 256 Russia Butter Powder Market, 2023 - 2030, Kilo Tonnes
- TABLE 257 Russia Butter Powder Market by Source, 2019 - 2022, USD Million
- TABLE 258 Russia Butter Powder Market by Source, 2023 - 2030, USD Million
- TABLE 259 Spain Butter Powder Market by Source, 2019 - 2022, Kilo Tonnes
- TABLE 260 Spain Butter Powder Market by Source, 2023 - 2030, Kilo Tonnes
- TABLE 261 Russia Butter Powder Market by Distribution Channel, 2019 - 2022, USD Million
- TABLE 262 Russia Butter Powder Market by Distribution Channel, 2023 - 2030, USD Million
- TABLE 263 Spain Butter Powder Market by Distribution Channel, 2019 - 2022, Kilo Tonnes
- TABLE 264 Spain Butter Powder Market by Distribution Channel, 2023 - 2030, Kilo Tonnes
- TABLE 265 Spain Butter Powder Market, 2019 - 2022, USD Million
- TABLE 266 Spain Butter Powder Market, 2023 - 2030, USD Million
- TABLE 267 Spain Butter Powder Market, 2019 - 2022, Kilo Tonnes
- TABLE 268 Spain Butter Powder Market, 2023 - 2030, Kilo Tonnes
- TABLE 269 Spain Butter Powder Market by Source, 2019 - 2022, USD Million
- TABLE 270 Spain Butter Powder Market by Source, 2023 - 2030, USD Million
- TABLE 271 Spain Butter Powder Market by Source, 2019 - 2022, Kilo Tonnes
- TABLE 272 Spain Butter Powder Market by Source, 2023 - 2030, Kilo Tonnes
- TABLE 273 Spain Butter Powder Market by Distribution Channel, 2019 - 2022, USD Million
- TABLE 274 Spain Butter Powder Market by Distribution Channel, 2023 - 2030, USD Million
- TABLE 275 Spain Butter Powder Market by Distribution Channel, 2019 - 2022, Kilo Tonnes
- TABLE 276 Spain Butter Powder Market by Distribution Channel, 2023 - 2030, Kilo Tonnes
- TABLE 277 Italy Butter Powder Market, 2019 - 2022, USD Million
- TABLE 278 Italy Butter Powder Market, 2023 - 2030, USD Million
- TABLE 279 Italy Butter Powder Market, 2019 - 2022, Kilo Tonnes
- TABLE 280 Italy Butter Powder Market, 2023 - 2030, Kilo Tonnes
- TABLE 281 Italy Butter Powder Market by Source, 2019 - 2022, USD Million
- TABLE 282 Italy Butter Powder Market by Source, 2023 - 2030, USD Million
- TABLE 283 Italy Butter Powder Market by Source, 2019 - 2022, Kilo Tonnes
- TABLE 284 Italy Butter Powder Market by Source, 2023 - 2030, Kilo Tonnes
- TABLE 285 Italy Butter Powder Market by Distribution Channel, 2019 - 2022, USD Million
- TABLE 286 Italy Butter Powder Market by Distribution Channel, 2023 - 2030, USD Million
- TABLE 287 Italy Butter Powder Market by Distribution Channel, 2019 - 2022, Kilo Tonnes
- TABLE 288 Italy Butter Powder Market by Distribution Channel, 2023 - 2030, Kilo Tonnes
- TABLE 289 Rest of Europe Butter Powder Market, 2019 - 2022, USD Million
- TABLE 290 Rest of Europe Butter Powder Market, 2023 - 2030, USD Million
- TABLE 291 Rest of Europe Butter Powder Market, 2019 - 2022, Kilo Tonnes
- TABLE 292 Rest of Europe Butter Powder Market, 2023 - 2030, Kilo Tonnes
- TABLE 293 Rest of Europe Butter Powder Market by Source, 2019 - 2022, USD Million
- TABLE 294 Rest of Europe Butter Powder Market by Source, 2023 - 2030, USD Million
- TABLE 295 Rest of Europe Butter Powder Market by Source, 2019 - 2022, Kilo Tonnes
- TABLE 296 Rest of Europe Butter Powder Market by Source, 2023 - 2030, Kilo Tonnes
- TABLE 297 Rest of Europe Butter Powder Market by Distribution Channel, 2019 - 2022, USD Million
- TABLE 298 Rest of Europe Butter Powder Market by Distribution Channel, 2023 - 2030, USD Million
- TABLE 299 Rest of Europe Butter Powder Market by Distribution Channel, 2019 - 2022, Kilo Tonnes
- TABLE 300 Rest of Europe Butter Powder Market by Distribution Channel, 2023 - 2030, Kilo Tonnes
The Global Butter Powder Market size is expected to reach $3.3 billion by 2030, rising at a market growth of 5.2% CAGR during the forecast period. In the year 2022, the market attained a volume of 222.2 Kilo Tonnes, experiencing a growth of 4.6% (2019-2022).
Online retail channels provide consumers with the convenience of shopping for butter powder from the comfort of their homes or on-the-go using smartphones or computers. Therefore, the online retail segment generated $325.8 million revenue in the market in 2022. This eliminates the requirement for visiting physical stores, thus saving time and effort. Online retailers offer a vast selection of butter powder products, including various brands, flavors, sizes, and packaging options. Consumers have the freedom to choose products that meet their specific preferences and dietary needs. For producers and manufacturers, selling butter powder through online retail channels can expand their market reach, increase brand visibility, and provide a direct connection to consumers. It allows them to tap into a global customer base and gain valuable insights into consumer preferences and behavior through data analytics. Some of the factors impacting the market are growing demand for products with longer shelf lives, increasing demand in food processing industry, and significant health concerns associated with butter powder.
The long shelf life of butter powder is one of its standout features. It offers several advantages over regular butter, particularly in terms of storage, transportation, and versatility in diverse applications. The fundamental reason for its extended shelf life is moisture removal during production. Most spoilage bacteria, molds, and yeasts require moisture to grow. Due to the lack of need for refrigeration and its longer shelf life, it is a valuable addition to emergency food supplies and survival kits. Therefore, the provision of longer shelf life for this product is a prominent factor that will drive the growth of the market in the coming years. Moreover, the demand in food processing has increased due to several factors that make it a preferred ingredient for manufacturers. Butter powder has a longer shelf life than regular butter, making it an attractive choice for manufacturers who wish to maintain the freshness and quality of their products over time without adding preservatives. It can be part of seasonings for snacks like popcorn or chips, providing a buttery taste without moisture. Such varied advantages of butter powder have contributed to its growing demand in food processing. As the food industry continues to innovate and expand, the role of ingredients like butter powder is expected to grow correspondingly.
However, it is essentially dehydrated butter, but its processing and any added ingredients can lead to some health concerns among consumers. Like regular butter, butter powder is a source of saturated fats, which, when consumed in high proportions, may raise LDL (bad cholesterol) levels in the blood, increasing the chances of heart disease and stroke. While it has a longer shelf life than regular butter, once opened, it might be susceptible to rancidity if not stored properly. Hence, all of these factors may hamper the growth of the market in the coming years.
Source Outlook
Based on source, the market is segmented into milk, peanut, almond, cocoa, and others. In 2022, the peanut segment procured a significant revenue share in the market. It contains between 85 and 90 percent less fat than regular peanut butter, which has proven to be an excellent substitute. In addition, it is a nutritious option because it is a great source of fiber, protein, vitamins, and minerals. When looking for a healthier option, consumers frequently select peanut butter powder. In addition, it is an excellent option for customers who desire the enticing flavor of peanut butter while restricting their cholesterol intake. Additionally, the prevalence of vegan and plant-based diets has increased the segment's sales.
Distribution Channel Outlook
On the basis of distribution channel, the market is classified into supermarket/hypermarket, convenience stores, B2B, specialty stores, and online retail. In 2022, the supermarket/hypermarket segment dominated the market with the largest revenue share. Most cooking and culinary products are purchased from large retailers such as supermarkets. Due to their extensive selection of butter powder products, supermarkets are the most common places to buy butter powder. The consequences for sale come from a variety of brands and have distinct flavors. In addition to pastry and cookery, the health and wellness section carries butter powder. As a result, the market is alluring to consumers because it allows them to complete their purchase in a single location, sparing them time.
Regional Outlook
Region-wise, the market is analyzed across North America, Europe, Asia Pacific, and LAMEA. The North America region witnessed the maximum revenue share in the market in 2022. Due to the continued expansion of the North American market, sales have increased significantly. In the region, there has been a substantial shift in consumer behavior regarding pastry and culinary products. In addition, an increase in North American consumers who use culinary creations is generating a considerable demand. Butter powder's health benefits are becoming more widely known, increasing demand for baking and culinary supplies.
The market research report covers the analysis of key stakeholders of the market. Key companies profiled in the report include Nutrient Survival, Betty Lou's Inc., Garden of Life, LLC (Nestle S.A), Kanegrade Ltd., PB2 Foods, Inc. (Bell Plantation Inc.), Z Natural Foods LLC, Powbab, Inc., Nutricost (ESUPPLEMENTS, LLC), and BetterBody Foods, and Hoosier Hill Farm LLC (Saco Foods)
Scope of the Study
Market Segments covered in the Report:
By Source (Volume, Kilo Tonnes, USD Million, 2019-2030)
- Milk
- Peanut
- Almond
- Cocoa
- Others
By Distribution Channel (Volume, Kilo Tonnes, USD Million, 2019-2030)
- Supermarket/Hypermarket
- B2B
- Convenience Stores
- Online Retail
- Others
By Geography (Volume, Kilo Tonnes, USD Million, 2019-2030)
- North America
- US
- Canada
- Mexico
- Rest of North America
- Europe
- Germany
- UK
- France
- Russia
- Spain
- Italy
- Rest of Europe
- Asia Pacific
- China
- Japan
- India
- South Korea
- Singapore
- Malaysia
- Rest of Asia Pacific
- LAMEA
- Brazil
- Argentina
- UAE
- Saudi Arabia
- South Africa
- Nigeria
- Rest of LAMEA
Companies Profiled
- Nutrient Survival
- Betty Lou's Inc.
- Garden of Life, LLC (Nestle S.A)
- Kanegrade Ltd.
- PB2 Foods, Inc. (Bell Plantation Inc.)
- Z Natural Foods LLC
- Powbab, Inc.
- Nutricost (ESUPPLEMENTS, LLC)
- BetterBody Foods
- Hoosier Hill Farm LLC (Saco Foods)
Unique Offerings from KBV Research
- Exhaustive coverage
- Highest number of market tables and figures
- Subscription based model available
- Guaranteed best price
- Assured post sales research support with 10% customization free
Table of Contents
Chapter 1. Market Scope & Methodology
- 1.1 Market Definition
- 1.2 Objectives
- 1.3 Market Scope
- 1.4 Segmentation
- 1.4.1 Global Butter Powder Market, by Source
- 1.4.2 Global Butter Powder Market, by Distribution Channel
- 1.4.3 Global Butter Powder Market, by Geography
- 1.5 Methodology for the research
Chapter 2. Market at a Glance
- 2.1 Key Highlights
Chapter 3. Market Overview
- 3.1 Introduction
- 3.1.1 Overview
- 3.1.1.1 Market Composition and Scenario
- 3.1.1 Overview
- 3.2 Key Factors Impacting the Market
- 3.2.1 Market Drivers
- 3.2.2 Market Restraints
- 3.3 Porter Five Forces Analysis
Chapter 4. Global Butter Powder Market by Source
- 4.1 Global Milk Market by Region
- 4.2 Global Peanut Market by Region
- 4.3 Global Almond Market by Region
- 4.4 Global Cocoa Market by Region
- 4.5 Global Others Market by Region
Chapter 5. Global Butter Powder Market by Distribution Channel
- 5.1 Global Supermarket/Hypermarket Market by Region
- 5.2 Global B2B Market by Region
- 5.3 Global Convenience Stores Market by Region
- 5.4 Global Online Retail Market by Region
- 5.5 Global Others Market by Region
Chapter 6. Global Butter Powder Market by Region
- 6.1 North America Butter Powder Market
- 6.1.1 North America Butter Powder Market by Source
- 6.1.1.1 North America Milk Market by Country
- 6.1.1.2 North America Peanut Market by Country
- 6.1.1.3 North America Almond Market by Country
- 6.1.1.4 North America Cocoa Market by Country
- 6.1.1.5 North America Others Market by Country
- 6.1.2 North America Butter Powder Market by Distribution Channel
- 6.1.2.1 North America Supermarket/Hypermarket Market by Country
- 6.1.2.2 North America B2B Market by Country
- 6.1.2.3 North America Convenience Stores Market by Country
- 6.1.2.4 North America Online Retail Market by Country
- 6.1.2.5 North America Others Market by Country
- 6.1.3 North America Butter Powder Market by Country
- 6.1.3.1 US Butter Powder Market
- 6.1.3.1.1 US Butter Powder Market by Source
- 6.1.3.1.2 US Butter Powder Market by Distribution Channel
- 6.1.3.2 Canada Butter Powder Market
- 6.1.3.2.1 Canada Butter Powder Market by Source
- 6.1.3.2.2 Canada Butter Powder Market by Distribution Channel
- 6.1.3.3 Mexico Butter Powder Market
- 6.1.3.3.1 Mexico Butter Powder Market by Source
- 6.1.3.3.2 Mexico Butter Powder Market by Distribution Channel
- 6.1.3.4 Rest of North America Butter Powder Market
- 6.1.3.4.1 Rest of North America Butter Powder Market by Source
- 6.1.3.4.2 Rest of North America Butter Powder Market by Distribution Channel
- 6.1.3.1 US Butter Powder Market
- 6.1.1 North America Butter Powder Market by Source
- 6.2 Europe Butter Powder Market
- 6.2.1 Europe Butter Powder Market by Source
- 6.2.1.1 Europe Milk Market by Country
- 6.2.1.2 Europe Peanut Market by Country
- 6.2.1.3 Europe Almond Market by Country
- 6.2.1.4 Europe Cocoa Market by Country
- 6.2.1.5 Europe Others Market by Country
- 6.2.2 Europe Butter Powder Market by Distribution Channel
- 6.2.2.1 Europe Supermarket/Hypermarket Market by Country
- 6.2.2.2 Europe B2B Market by Country
- 6.2.2.3 Europe Convenience Stores Market by Country
- 6.2.2.4 Europe Online Retail Market by Country
- 6.2.2.5 Europe Others Market by Country
- 6.2.3 Europe Butter Powder Market by Country
- 6.2.3.1 Germany Butter Powder Market
- 6.2.3.1.1 Germany Butter Powder Market by Source
- 6.2.3.1.2 Germany Butter Powder Market by Distribution Channel
- 6.2.3.2 UK Butter Powder Market
- 6.2.3.2.1 UK Butter Powder Market by Source
- 6.2.3.2.2 UK Butter Powder Market by Distribution Channel
- 6.2.3.3 France Butter Powder Market
- 6.2.3.3.1 France Butter Powder Market by Source
- 6.2.3.3.2 France Butter Powder Market by Distribution Channel
- 6.2.3.4 Russia Butter Powder Market
- 6.2.3.4.1 Russia Butter Powder Market by Source
- 6.2.3.4.2 Russia Butter Powder Market by Distribution Channel
- 6.2.3.5 Spain Butter Powder Market
- 6.2.3.5.1 Spain Butter Powder Market by Source
- 6.2.3.5.2 Spain Butter Powder Market by Distribution Channel
- 6.2.3.6 Italy Butter Powder Market
- 6.2.3.6.1 Italy Butter Powder Market by Source
- 6.2.3.6.2 Italy Butter Powder Market by Distribution Channel
- 6.2.3.7 Rest of Europe Butter Powder Market
- 6.2.3.7.1 Rest of Europe Butter Powder Market by Source
- 6.2.3.7.2 Rest of Europe Butter Powder Market by Distribution Channel
- 6.2.3.1 Germany Butter Powder Market
- 6.2.1 Europe Butter Powder Market by Source
- 6.3 Asia Pacific Butter Powder Market
- 6.3.1 Asia Pacific Butter Powder Market by Source
- 6.3.1.1 Asia Pacific Milk Market by Country
- 6.3.1.2 Asia Pacific Peanut Market by Country
- 6.3.1.3 Asia Pacific Almond Market by Country
- 6.3.1.4 Asia Pacific Cocoa Market by Country
- 6.3.1.5 Asia Pacific Others Market by Country
- 6.3.2 Asia Pacific Butter Powder Market by Distribution Channel
- 6.3.2.1 Asia Pacific Supermarket/Hypermarket Market by Country
- 6.3.2.2 Asia Pacific B2B Market by Country
- 6.3.2.3 Asia Pacific Convenience Stores Market by Country
- 6.3.2.4 Asia Pacific Online Retail Market by Country
- 6.3.2.5 Asia Pacific Others Market by Country
- 6.3.3 Asia Pacific Butter Powder Market by Country
- 6.3.3.1 China Butter Powder Market
- 6.3.3.1.1 China Butter Powder Market by Source
- 6.3.3.1.2 China Butter Powder Market by Distribution Channel
- 6.3.3.2 Japan Butter Powder Market
- 6.3.3.2.1 Japan Butter Powder Market by Source
- 6.3.3.2.2 Japan Butter Powder Market by Distribution Channel
- 6.3.3.3 India Butter Powder Market
- 6.3.3.3.1 India Butter Powder Market by Source
- 6.3.3.3.2 India Butter Powder Market by Distribution Channel
- 6.3.3.4 South Korea Butter Powder Market
- 6.3.3.4.1 South Korea Butter Powder Market by Source
- 6.3.3.4.2 South Korea Butter Powder Market by Distribution Channel
- 6.3.3.5 Singapore Butter Powder Market
- 6.3.3.5.1 Singapore Butter Powder Market by Source
- 6.3.3.5.2 Singapore Butter Powder Market by Distribution Channel
- 6.3.3.6 Malaysia Butter Powder Market
- 6.3.3.6.1 Malaysia Butter Powder Market by Source
- 6.3.3.6.2 Malaysia Butter Powder Market by Distribution Channel
- 6.3.3.7 Rest of Asia Pacific Butter Powder Market
- 6.3.3.7.1 Rest of Asia Pacific Butter Powder Market by Source
- 6.3.3.7.2 Rest of Asia Pacific Butter Powder Market by Distribution Channel
- 6.3.3.1 China Butter Powder Market
- 6.3.1 Asia Pacific Butter Powder Market by Source
- 6.4 LAMEA Butter Powder Market
- 6.4.1 LAMEA Butter Powder Market by Source
- 6.4.1.1 LAMEA Milk Market by Country
- 6.4.1.2 LAMEA Peanut Market by Country
- 6.4.1.3 LAMEA Almond Market by Country
- 6.4.1.4 LAMEA Cocoa Market by Country
- 6.4.1.5 LAMEA Others Market by Country
- 6.4.2 LAMEA Butter Powder Market by Distribution Channel
- 6.4.2.1 LAMEA Supermarket/Hypermarket Market by Country
- 6.4.2.2 LAMEA B2B Market by Country
- 6.4.2.3 LAMEA Convenience Stores Market by Country
- 6.4.2.4 LAMEA Online Retail Market by Country
- 6.4.2.5 LAMEA Others Market by Country
- 6.4.3 LAMEA Butter Powder Market by Country
- 6.4.3.1 Brazil Butter Powder Market
- 6.4.3.1.1 Brazil Butter Powder Market by Source
- 6.4.3.1.2 Brazil Butter Powder Market by Distribution Channel
- 6.4.3.2 Argentina Butter Powder Market
- 6.4.3.2.1 Argentina Butter Powder Market by Source
- 6.4.3.2.2 Argentina Butter Powder Market by Distribution Channel
- 6.4.3.3 UAE Butter Powder Market
- 6.4.3.3.1 UAE Butter Powder Market by Source
- 6.4.3.3.2 UAE Butter Powder Market by Distribution Channel
- 6.4.3.4 Saudi Arabia Butter Powder Market
- 6.4.3.4.1 Saudi Arabia Butter Powder Market by Source
- 6.4.3.4.2 Saudi Arabia Butter Powder Market by Distribution Channel
- 6.4.3.5 South Africa Butter Powder Market
- 6.4.3.5.1 South Africa Butter Powder Market by Source
- 6.4.3.5.2 South Africa Butter Powder Market by Distribution Channel
- 6.4.3.6 Nigeria Butter Powder Market
- 6.4.3.6.1 Nigeria Butter Powder Market by Source
- 6.4.3.6.2 Nigeria Butter Powder Market by Distribution Channel
- 6.4.3.7 Rest of LAMEA Butter Powder Market
- 6.4.3.7.1 Rest of LAMEA Butter Powder Market by Source
- 6.4.3.7.2 Rest of LAMEA Butter Powder Market by Distribution Channel
- 6.4.3.1 Brazil Butter Powder Market
- 6.4.1 LAMEA Butter Powder Market by Source
Chapter 7. Company Profiles
- 7.1 Nutrient Survival
- 7.1.1 Company Overview
- 7.1.2 SWOT Analysis
- 7.2 Betty Lou's Inc.
- 7.2.1 Company Overview
- 7.2.2 SWOT Analysis
- 7.3 Garden of Life, LLC (Nestle S.A)
- 7.3.1 Company Overview
- 7.3.2 Financial Analysis
- 7.3.3 Segmental and Regional Analysis
- 7.3.4 Research & Development Expenses
- 7.3.5 SWOT Analysis
- 7.4 PB2 Foods, Inc. (Bell Plantation Inc.)
- 7.4.1 Company Overview
- 7.4.2 Recent strategies and developments:
- 7.4.2.1 Product Launches and Product Expansions:
- 7.5 Z Natural Foods LLC
- 7.5.1 Company Overview
- 7.5.2 SWOT Analysis
- 7.6 Powbab, Inc.
- 7.6.1 Company Overview
- 7.6.2 SWOT Analysis
- 7.7 BetterBody Foods
- 7.7.1 Company Overview
- 7.7.2 SWOT Analysis
- 7.8 Kanegrade Ltd.
- 7.8.1 Company Overview
- 7.8.2 SWOT Analysis
- 7.9 Nutricost (ESUPPLEMENTS, LLC)
- 7.9.1 Company Overview
- 7.10. Hoosier Hill Farm LLC (Saco Foods)
- 7.10.1 Company Overview
- 7.10.2 SWOT Analysis