|
|
市場調査レポート
商品コード
1292479
制酸剤の世界市場規模、シェア、産業動向分析レポート製剤タイプ別(錠剤、液体、その他)、作用機序別(非全身性、全身性)、流通チャネル別、地域別展望と予測、2023~2029年Global Antacids Market Size, Share & Industry Trends Analysis Report By Formulation Type (Tablets, Liquids and Others), By Mechanism of Action (Non-systemic and Systemic), By Distribution Channel, By Regional Outlook and Forecast, 2023 - 2029 |
||||||
|
|
|||||||
|
|||||||


| 制酸剤の世界市場規模、シェア、産業動向分析レポート製剤タイプ別(錠剤、液体、その他)、作用機序別(非全身性、全身性)、流通チャネル別、地域別展望と予測、2023~2029年 |
|
出版日: 2023年05月31日
発行: KBV Research
ページ情報: 英文 197 Pages
納期: 即納可能
|

- 全表示
- 概要
- 図表
- 目次
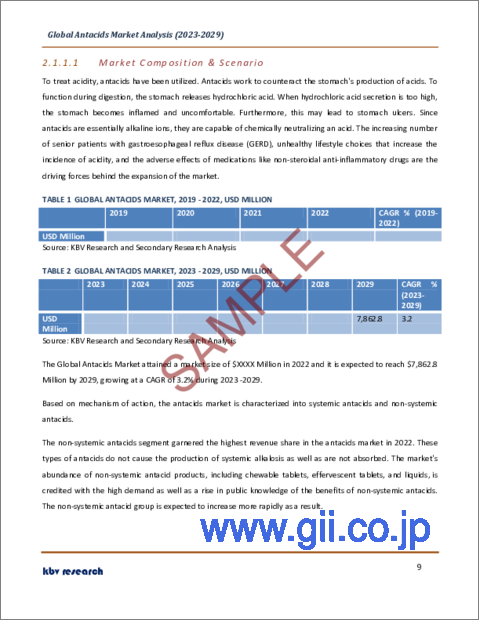
制酸剤市場規模は、2029年には79億米ドルに達し、予測期間中のCAGRは3.2%の市場成長率で上昇すると予測されています。
ファストフードの消費は世界的にかなり拡大しています。アレルギーも肥満も、ファストフードの頻繁な摂取と関連しています。したがって、ファストフードの消費はすべての年齢層で急速に増加しているため、胃や消化器系の問題の有病率を高めることになります。これは、市場の成長を大きく後押しすることになります。2030年には、6人に1人が60歳以上になると言われています。60歳以上の人は、2020年の10億人から、この頃には14億人を占めるようになります。2050年には、60歳以上の人口は2倍となり、21億人という驚異的な数に達します。したがって、高齢者に多く見られる症状であることから、予測される期間において市場の成長は急上昇すると予想されます。しかし、H2受容体拮抗薬とプロトンポンプ阻害薬(PPI)は、酸関連疾患に対するより新しい強力な治療法の例であり、業界に課題を突きつけています。
作用機序の展望
作用メカニズムに基づき、市場は全身性制酸剤と非全身性制酸剤に分類されます。全身性制酸剤セグメントは、2022年の市場においてかなりの成長率を調達しました。炭酸水素ナトリウムのような制酸剤は、全身をアルカリ性にし、溶解性と再吸収性に優れています。重炭酸塩の発泡は、鎮痛剤と制酸剤の組み合わせの豊富さを示しています。また、これらの薬品は胃の中の塩酸と反応して二酸化炭素を発生させ、すぐに吸収されますが、時には心地よいゲップが出ることがあります。このようなタイプの制酸剤が簡単に手に入ることが、市場の成長を後押ししています。
製剤タイプの展望
製剤タイプにより、市場は錠剤、液剤、その他に分類されます。錠剤セグメントは、2022年に市場で最大の収益シェアを獲得しました。市場の主要プレーヤーは、制酸錠剤の品揃えを提供しています。さらに、チュアブルタイプの制酸錠剤の誕生と導入も、錠剤の需要を高めています。これらの要因はすべて、このセグメントの拡大を後押ししています。
流通チャネルの展望
流通チャネル別では、病院薬局、ドラッグストア・小売薬局、オンラインプロバイダーに分類されます。ドラッグストア&小売薬局セグメントは、2022年の市場において最大の収益シェアを示しました。これらの施設が顧客に提供する利便性と制酸剤の広範な入手可能性により、ドラッグストア&小売薬局部門は市場をリードしています。また、消化不良や胸やけがある場合、処方箋薬や医療介入を必要とせず、市販の制酸剤を購入する人が多く、この分野の成長をさらに促進しています。
地域別展望
地域別では、北米、欧州、アジア太平洋、LAMEAの4地域で分析しています。北米セグメントは、2022年の市場において最も高い収益シェアを獲得しました。北米での拡大は、この地域がアクセスしやすく、高度に発達したヘルスケアシステム、最も重要なプレイヤーの存在、胸焼けの症例の増加、市販薬の入手が簡単であることに関連しています。さらに、米国やその他の北米主要国では、GERD、胃炎、消化性潰瘍疾患が非常に一般的であり、制酸剤の需要を高めています。
目次
第1章 市場範囲と調査手法
- 市場の定義
- 目的
- 市場範囲
- セグメンテーション
- 調査手法
第2章 市場概要
- イントロダクション
- 概要
- 市場構成とシナリオ
- 概要
- 市場に影響を与える主な要因
- 市場促進要因
- 市場抑制要因
第3章 世界の制酸剤市場:配合タイプ別
- 世界のタブレット市場:地域別
- 世界の液体市場:地域別
- 世界のその他の市場:地域別
第4章 世界の制酸剤市場:作用機序別
- 世界の非体系的市場:地域別
- 世界の全身市場:地域別
第5章 世界の制酸剤市場:流通チャネル別
- 世界のドラッグストアおよび小売薬局市場:地域別
- 世界の病院薬局市場:地域別
- 世界のオンライン薬局市場:地域別
第6章 世界の制酸剤市場:地域別
- 北米
- 北米の市場:国別
- 米国
- カナダ
- メキシコ
- その他北米地域
- 北米の市場:国別
- 欧州
- 欧州の市場:国別
- ドイツ
- 英国
- フランス
- ロシア
- スペイン
- イタリア
- その他欧州地域
- 欧州の市場:国別
- アジア太平洋
- アジア太平洋の市場:国別
- 中国
- 日本
- インド
- 韓国
- シンガポール
- マレーシア
- その他アジア太平洋地域
- アジア太平洋の市場:国別
- ラテンアメリカ・中東・アフリカ
- ラテンアメリカ・中東・アフリカの市場:国別
- ブラジル
- アルゼンチン
- アラブ首長国連邦
- サウジアラビア
- 南アフリカ
- ナイジェリア
- その他ラテンアメリカ・中東・アフリカ地域
- ラテンアメリカ・中東・アフリカの市場:国別
第7章 企業プロファイル
- Abbott Laboratories
- Alkem Laboratories Ltd
- Bayer AG
- Cipla Limited
- Pfizer, Inc
- Prestige Consumer Healthcare, Inc
- Reckitt Benckiser Group PLC
- WellSpring Pharmaceutical Corporation(Avista Capital Partners)
- Sanofi SA
- Sun Pharmaceutical Industries Ltd
LIST OF TABLES
- TABLE 1 Global Antacids Market, 2019 - 2022, USD Million
- TABLE 2 Global Antacids Market, 2023 - 2029, USD Million
- TABLE 3 Global Antacids Market by Formulation Type, 2019 - 2022, USD Million
- TABLE 4 Global Antacids Market by Formulation Type, 2023 - 2029, USD Million
- TABLE 5 Global Tablets Market by Region, 2019 - 2022, USD Million
- TABLE 6 Global Tablets Market by Region, 2023 - 2029, USD Million
- TABLE 7 Global Liquids Market by Region, 2019 - 2022, USD Million
- TABLE 8 Global Liquids Market by Region, 2023 - 2029, USD Million
- TABLE 9 Global Others Market by Region, 2019 - 2022, USD Million
- TABLE 10 Global Others Market by Region, 2023 - 2029, USD Million
- TABLE 11 Global Antacids Market by Mechanism of Action, 2019 - 2022, USD Million
- TABLE 12 Global Antacids Market by Mechanism of Action, 2023 - 2029, USD Million
- TABLE 13 Global Non-systemic Market by Region, 2019 - 2022, USD Million
- TABLE 14 Global Non-systemic Market by Region, 2023 - 2029, USD Million
- TABLE 15 Global Systemic Market by Region, 2019 - 2022, USD Million
- TABLE 16 Global Systemic Market by Region, 2023 - 2029, USD Million
- TABLE 17 Global Antacids Market by Distribution Channel, 2019 - 2022, USD Million
- TABLE 18 Global Antacids Market by Distribution Channel, 2023 - 2029, USD Million
- TABLE 19 Global Drug Store & Retail Pharmacies Market by Region, 2019 - 2022, USD Million
- TABLE 20 Global Drug Store & Retail Pharmacies Market by Region, 2023 - 2029, USD Million
- TABLE 21 Global Hospital Pharmacies Market by Region, 2019 - 2022, USD Million
- TABLE 22 Global Hospital Pharmacies Market by Region, 2023 - 2029, USD Million
- TABLE 23 Global Online Pharmacies Market by Region, 2019 - 2022, USD Million
- TABLE 24 Global Online Pharmacies Market by Region, 2023 - 2029, USD Million
- TABLE 25 Global Antacids Market by Region, 2019 - 2022, USD Million
- TABLE 26 Global Antacids Market by Region, 2023 - 2029, USD Million
- TABLE 27 North America Antacids Market, 2019 - 2022, USD Million
- TABLE 28 North America Antacids Market, 2023 - 2029, USD Million
- TABLE 29 North America Antacids Market by Formulation Type, 2019 - 2022, USD Million
- TABLE 30 North America Antacids Market by Formulation Type, 2023 - 2029, USD Million
- TABLE 31 North America Tablets Market by Country, 2019 - 2022, USD Million
- TABLE 32 North America Tablets Market by Country, 2023 - 2029, USD Million
- TABLE 33 North America Liquids Market by Country, 2019 - 2022, USD Million
- TABLE 34 North America Liquids Market by Country, 2023 - 2029, USD Million
- TABLE 35 North America Others Market by Country, 2019 - 2022, USD Million
- TABLE 36 North America Others Market by Country, 2023 - 2029, USD Million
- TABLE 37 North America Antacids Market by Mechanism of Action, 2019 - 2022, USD Million
- TABLE 38 North America Antacids Market by Mechanism of Action, 2023 - 2029, USD Million
- TABLE 39 North America Non-systemic Market by Country, 2019 - 2022, USD Million
- TABLE 40 North America Non-systemic Market by Country, 2023 - 2029, USD Million
- TABLE 41 North America Systemic Market by Country, 2019 - 2022, USD Million
- TABLE 42 North America Systemic Market by Country, 2023 - 2029, USD Million
- TABLE 43 North America Antacids Market by Distribution Channel, 2019 - 2022, USD Million
- TABLE 44 North America Antacids Market by Distribution Channel, 2023 - 2029, USD Million
- TABLE 45 North America Drug Store & Retail Pharmacies Market by Country, 2019 - 2022, USD Million
- TABLE 46 North America Drug Store & Retail Pharmacies Market by Country, 2023 - 2029, USD Million
- TABLE 47 North America Hospital Pharmacies Market by Country, 2019 - 2022, USD Million
- TABLE 48 North America Hospital Pharmacies Market by Country, 2023 - 2029, USD Million
- TABLE 49 North America Online Pharmacies Market by Country, 2019 - 2022, USD Million
- TABLE 50 North America Online Pharmacies Market by Country, 2023 - 2029, USD Million
- TABLE 51 North America Antacids Market by Country, 2019 - 2022, USD Million
- TABLE 52 North America Antacids Market by Country, 2023 - 2029, USD Million
- TABLE 53 US Antacids Market, 2019 - 2022, USD Million
- TABLE 54 US Antacids Market, 2023 - 2029, USD Million
- TABLE 55 US Antacids Market by Formulation Type, 2019 - 2022, USD Million
- TABLE 56 US Antacids Market by Formulation Type, 2023 - 2029, USD Million
- TABLE 57 US Antacids Market by Mechanism of Action, 2019 - 2022, USD Million
- TABLE 58 US Antacids Market by Mechanism of Action, 2023 - 2029, USD Million
- TABLE 59 US Antacids Market by Distribution Channel, 2019 - 2022, USD Million
- TABLE 60 US Antacids Market by Distribution Channel, 2023 - 2029, USD Million
- TABLE 61 Canada Antacids Market, 2019 - 2022, USD Million
- TABLE 62 Canada Antacids Market, 2023 - 2029, USD Million
- TABLE 63 Canada Antacids Market by Formulation Type, 2019 - 2022, USD Million
- TABLE 64 Canada Antacids Market by Formulation Type, 2023 - 2029, USD Million
- TABLE 65 Canada Antacids Market by Mechanism of Action, 2019 - 2022, USD Million
- TABLE 66 Canada Antacids Market by Mechanism of Action, 2023 - 2029, USD Million
- TABLE 67 Canada Antacids Market by Distribution Channel, 2019 - 2022, USD Million
- TABLE 68 Canada Antacids Market by Distribution Channel, 2023 - 2029, USD Million
- TABLE 69 Mexico Antacids Market, 2019 - 2022, USD Million
- TABLE 70 Mexico Antacids Market, 2023 - 2029, USD Million
- TABLE 71 Mexico Antacids Market by Formulation Type, 2019 - 2022, USD Million
- TABLE 72 Mexico Antacids Market by Formulation Type, 2023 - 2029, USD Million
- TABLE 73 Mexico Antacids Market by Mechanism of Action, 2019 - 2022, USD Million
- TABLE 74 Mexico Antacids Market by Mechanism of Action, 2023 - 2029, USD Million
- TABLE 75 Mexico Antacids Market by Distribution Channel, 2019 - 2022, USD Million
- TABLE 76 Mexico Antacids Market by Distribution Channel, 2023 - 2029, USD Million
- TABLE 77 Rest of North America Antacids Market, 2019 - 2022, USD Million
- TABLE 78 Rest of North America Antacids Market, 2023 - 2029, USD Million
- TABLE 79 Rest of North America Antacids Market by Formulation Type, 2019 - 2022, USD Million
- TABLE 80 Rest of North America Antacids Market by Formulation Type, 2023 - 2029, USD Million
- TABLE 81 Rest of North America Antacids Market by Mechanism of Action, 2019 - 2022, USD Million
- TABLE 82 Rest of North America Antacids Market by Mechanism of Action, 2023 - 2029, USD Million
- TABLE 83 Rest of North America Antacids Market by Distribution Channel, 2019 - 2022, USD Million
- TABLE 84 Rest of North America Antacids Market by Distribution Channel, 2023 - 2029, USD Million
- TABLE 85 Europe Antacids Market, 2019 - 2022, USD Million
- TABLE 86 Europe Antacids Market, 2023 - 2029, USD Million
- TABLE 87 Europe Antacids Market by Formulation Type, 2019 - 2022, USD Million
- TABLE 88 Europe Antacids Market by Formulation Type, 2023 - 2029, USD Million
- TABLE 89 Europe Tablets Market by Country, 2019 - 2022, USD Million
- TABLE 90 Europe Tablets Market by Country, 2023 - 2029, USD Million
- TABLE 91 Europe Liquids Market by Country, 2019 - 2022, USD Million
- TABLE 92 Europe Liquids Market by Country, 2023 - 2029, USD Million
- TABLE 93 Europe Others Market by Country, 2019 - 2022, USD Million
- TABLE 94 Europe Others Market by Country, 2023 - 2029, USD Million
- TABLE 95 Europe Antacids Market by Mechanism of Action, 2019 - 2022, USD Million
- TABLE 96 Europe Antacids Market by Mechanism of Action, 2023 - 2029, USD Million
- TABLE 97 Europe Non-systemic Market by Country, 2019 - 2022, USD Million
- TABLE 98 Europe Non-systemic Market by Country, 2023 - 2029, USD Million
- TABLE 99 Europe Systemic Market by Country, 2019 - 2022, USD Million
- TABLE 100 Europe Systemic Market by Country, 2023 - 2029, USD Million
- TABLE 101 Europe Antacids Market by Distribution Channel, 2019 - 2022, USD Million
- TABLE 102 Europe Antacids Market by Distribution Channel, 2023 - 2029, USD Million
- TABLE 103 Europe Drug Store & Retail Pharmacies Market by Country, 2019 - 2022, USD Million
- TABLE 104 Europe Drug Store & Retail Pharmacies Market by Country, 2023 - 2029, USD Million
- TABLE 105 Europe Hospital Pharmacies Market by Country, 2019 - 2022, USD Million
- TABLE 106 Europe Hospital Pharmacies Market by Country, 2023 - 2029, USD Million
- TABLE 107 Europe Online Pharmacies Market by Country, 2019 - 2022, USD Million
- TABLE 108 Europe Online Pharmacies Market by Country, 2023 - 2029, USD Million
- TABLE 109 Europe Antacids Market by Country, 2019 - 2022, USD Million
- TABLE 110 Europe Antacids Market by Country, 2023 - 2029, USD Million
- TABLE 111 Germany Antacids Market, 2019 - 2022, USD Million
- TABLE 112 Germany Antacids Market, 2023 - 2029, USD Million
- TABLE 113 Germany Antacids Market by Formulation Type, 2019 - 2022, USD Million
- TABLE 114 Germany Antacids Market by Formulation Type, 2023 - 2029, USD Million
- TABLE 115 Germany Antacids Market by Mechanism of Action, 2019 - 2022, USD Million
- TABLE 116 Germany Antacids Market by Mechanism of Action, 2023 - 2029, USD Million
- TABLE 117 Germany Antacids Market by Distribution Channel, 2019 - 2022, USD Million
- TABLE 118 Germany Antacids Market by Distribution Channel, 2023 - 2029, USD Million
- TABLE 119 UK Antacids Market, 2019 - 2022, USD Million
- TABLE 120 UK Antacids Market, 2023 - 2029, USD Million
- TABLE 121 UK Antacids Market by Formulation Type, 2019 - 2022, USD Million
- TABLE 122 UK Antacids Market by Formulation Type, 2023 - 2029, USD Million
- TABLE 123 UK Antacids Market by Mechanism of Action, 2019 - 2022, USD Million
- TABLE 124 UK Antacids Market by Mechanism of Action, 2023 - 2029, USD Million
- TABLE 125 UK Antacids Market by Distribution Channel, 2019 - 2022, USD Million
- TABLE 126 UK Antacids Market by Distribution Channel, 2023 - 2029, USD Million
- TABLE 127 France Antacids Market, 2019 - 2022, USD Million
- TABLE 128 France Antacids Market, 2023 - 2029, USD Million
- TABLE 129 France Antacids Market by Formulation Type, 2019 - 2022, USD Million
- TABLE 130 France Antacids Market by Formulation Type, 2023 - 2029, USD Million
- TABLE 131 France Antacids Market by Mechanism of Action, 2019 - 2022, USD Million
- TABLE 132 France Antacids Market by Mechanism of Action, 2023 - 2029, USD Million
- TABLE 133 France Antacids Market by Distribution Channel, 2019 - 2022, USD Million
- TABLE 134 France Antacids Market by Distribution Channel, 2023 - 2029, USD Million
- TABLE 135 Russia Antacids Market, 2019 - 2022, USD Million
- TABLE 136 Russia Antacids Market, 2023 - 2029, USD Million
- TABLE 137 Russia Antacids Market by Formulation Type, 2019 - 2022, USD Million
- TABLE 138 Russia Antacids Market by Formulation Type, 2023 - 2029, USD Million
- TABLE 139 Russia Antacids Market by Mechanism of Action, 2019 - 2022, USD Million
- TABLE 140 Russia Antacids Market by Mechanism of Action, 2023 - 2029, USD Million
- TABLE 141 Russia Antacids Market by Distribution Channel, 2019 - 2022, USD Million
- TABLE 142 Russia Antacids Market by Distribution Channel, 2023 - 2029, USD Million
- TABLE 143 Spain Antacids Market, 2019 - 2022, USD Million
- TABLE 144 Spain Antacids Market, 2023 - 2029, USD Million
- TABLE 145 Spain Antacids Market by Formulation Type, 2019 - 2022, USD Million
- TABLE 146 Spain Antacids Market by Formulation Type, 2023 - 2029, USD Million
- TABLE 147 Spain Antacids Market by Mechanism of Action, 2019 - 2022, USD Million
- TABLE 148 Spain Antacids Market by Mechanism of Action, 2023 - 2029, USD Million
- TABLE 149 Spain Antacids Market by Distribution Channel, 2019 - 2022, USD Million
- TABLE 150 Spain Antacids Market by Distribution Channel, 2023 - 2029, USD Million
- TABLE 151 Italy Antacids Market, 2019 - 2022, USD Million
- TABLE 152 Italy Antacids Market, 2023 - 2029, USD Million
- TABLE 153 Italy Antacids Market by Formulation Type, 2019 - 2022, USD Million
- TABLE 154 Italy Antacids Market by Formulation Type, 2023 - 2029, USD Million
- TABLE 155 Italy Antacids Market by Mechanism of Action, 2019 - 2022, USD Million
- TABLE 156 Italy Antacids Market by Mechanism of Action, 2023 - 2029, USD Million
- TABLE 157 Italy Antacids Market by Distribution Channel, 2019 - 2022, USD Million
- TABLE 158 Italy Antacids Market by Distribution Channel, 2023 - 2029, USD Million
- TABLE 159 Rest of Europe Antacids Market, 2019 - 2022, USD Million
- TABLE 160 Rest of Europe Antacids Market, 2023 - 2029, USD Million
- TABLE 161 Rest of Europe Antacids Market by Formulation Type, 2019 - 2022, USD Million
- TABLE 162 Rest of Europe Antacids Market by Formulation Type, 2023 - 2029, USD Million
- TABLE 163 Rest of Europe Antacids Market by Mechanism of Action, 2019 - 2022, USD Million
- TABLE 164 Rest of Europe Antacids Market by Mechanism of Action, 2023 - 2029, USD Million
- TABLE 165 Rest of Europe Antacids Market by Distribution Channel, 2019 - 2022, USD Million
- TABLE 166 Rest of Europe Antacids Market by Distribution Channel, 2023 - 2029, USD Million
- TABLE 167 Asia Pacific Antacids Market, 2019 - 2022, USD Million
- TABLE 168 Asia Pacific Antacids Market, 2023 - 2029, USD Million
- TABLE 169 Asia Pacific Antacids Market by Formulation Type, 2019 - 2022, USD Million
- TABLE 170 Asia Pacific Antacids Market by Formulation Type, 2023 - 2029, USD Million
- TABLE 171 Asia Pacific Tablets Market by Country, 2019 - 2022, USD Million
- TABLE 172 Asia Pacific Tablets Market by Country, 2023 - 2029, USD Million
- TABLE 173 Asia Pacific Liquids Market by Country, 2019 - 2022, USD Million
- TABLE 174 Asia Pacific Liquids Market by Country, 2023 - 2029, USD Million
- TABLE 175 Asia Pacific Others Market by Country, 2019 - 2022, USD Million
- TABLE 176 Asia Pacific Others Market by Country, 2023 - 2029, USD Million
- TABLE 177 Asia Pacific Antacids Market by Mechanism of Action, 2019 - 2022, USD Million
- TABLE 178 Asia Pacific Antacids Market by Mechanism of Action, 2023 - 2029, USD Million
- TABLE 179 Asia Pacific Non-systemic Market by Country, 2019 - 2022, USD Million
- TABLE 180 Asia Pacific Non-systemic Market by Country, 2023 - 2029, USD Million
- TABLE 181 Asia Pacific Systemic Market by Country, 2019 - 2022, USD Million
- TABLE 182 Asia Pacific Systemic Market by Country, 2023 - 2029, USD Million
- TABLE 183 Asia Pacific Antacids Market by Distribution Channel, 2019 - 2022, USD Million
- TABLE 184 Asia Pacific Antacids Market by Distribution Channel, 2023 - 2029, USD Million
- TABLE 185 Asia Pacific Drug Store & Retail Pharmacies Market by Country, 2019 - 2022, USD Million
- TABLE 186 Asia Pacific Drug Store & Retail Pharmacies Market by Country, 2023 - 2029, USD Million
- TABLE 187 Asia Pacific Hospital Pharmacies Market by Country, 2019 - 2022, USD Million
- TABLE 188 Asia Pacific Hospital Pharmacies Market by Country, 2023 - 2029, USD Million
- TABLE 189 Asia Pacific Online Pharmacies Market by Country, 2019 - 2022, USD Million
- TABLE 190 Asia Pacific Online Pharmacies Market by Country, 2023 - 2029, USD Million
- TABLE 191 Asia Pacific Antacids Market by Country, 2019 - 2022, USD Million
- TABLE 192 Asia Pacific Antacids Market by Country, 2023 - 2029, USD Million
- TABLE 193 China Antacids Market, 2019 - 2022, USD Million
- TABLE 194 China Antacids Market, 2023 - 2029, USD Million
- TABLE 195 China Antacids Market by Formulation Type, 2019 - 2022, USD Million
- TABLE 196 China Antacids Market by Formulation Type, 2023 - 2029, USD Million
- TABLE 197 China Antacids Market by Mechanism of Action, 2019 - 2022, USD Million
- TABLE 198 China Antacids Market by Mechanism of Action, 2023 - 2029, USD Million
- TABLE 199 China Antacids Market by Distribution Channel, 2019 - 2022, USD Million
- TABLE 200 China Antacids Market by Distribution Channel, 2023 - 2029, USD Million
- TABLE 201 Japan Antacids Market, 2019 - 2022, USD Million
- TABLE 202 Japan Antacids Market, 2023 - 2029, USD Million
- TABLE 203 Japan Antacids Market by Formulation Type, 2019 - 2022, USD Million
- TABLE 204 Japan Antacids Market by Formulation Type, 2023 - 2029, USD Million
- TABLE 205 Japan Antacids Market by Mechanism of Action, 2019 - 2022, USD Million
- TABLE 206 Japan Antacids Market by Mechanism of Action, 2023 - 2029, USD Million
- TABLE 207 Japan Antacids Market by Distribution Channel, 2019 - 2022, USD Million
- TABLE 208 Japan Antacids Market by Distribution Channel, 2023 - 2029, USD Million
- TABLE 209 India Antacids Market, 2019 - 2022, USD Million
- TABLE 210 India Antacids Market, 2023 - 2029, USD Million
- TABLE 211 India Antacids Market by Formulation Type, 2019 - 2022, USD Million
- TABLE 212 India Antacids Market by Formulation Type, 2023 - 2029, USD Million
- TABLE 213 India Antacids Market by Mechanism of Action, 2019 - 2022, USD Million
- TABLE 214 India Antacids Market by Mechanism of Action, 2023 - 2029, USD Million
- TABLE 215 India Antacids Market by Distribution Channel, 2019 - 2022, USD Million
- TABLE 216 India Antacids Market by Distribution Channel, 2023 - 2029, USD Million
- TABLE 217 South Korea Antacids Market, 2019 - 2022, USD Million
- TABLE 218 South Korea Antacids Market, 2023 - 2029, USD Million
- TABLE 219 South Korea Antacids Market by Formulation Type, 2019 - 2022, USD Million
- TABLE 220 South Korea Antacids Market by Formulation Type, 2023 - 2029, USD Million
- TABLE 221 South Korea Antacids Market by Mechanism of Action, 2019 - 2022, USD Million
- TABLE 222 South Korea Antacids Market by Mechanism of Action, 2023 - 2029, USD Million
- TABLE 223 South Korea Antacids Market by Distribution Channel, 2019 - 2022, USD Million
- TABLE 224 South Korea Antacids Market by Distribution Channel, 2023 - 2029, USD Million
- TABLE 225 Singapore Antacids Market, 2019 - 2022, USD Million
- TABLE 226 Singapore Antacids Market, 2023 - 2029, USD Million
- TABLE 227 Singapore Antacids Market by Formulation Type, 2019 - 2022, USD Million
- TABLE 228 Singapore Antacids Market by Formulation Type, 2023 - 2029, USD Million
- TABLE 229 Singapore Antacids Market by Mechanism of Action, 2019 - 2022, USD Million
- TABLE 230 Singapore Antacids Market by Mechanism of Action, 2023 - 2029, USD Million
- TABLE 231 Singapore Antacids Market by Distribution Channel, 2019 - 2022, USD Million
- TABLE 232 Singapore Antacids Market by Distribution Channel, 2023 - 2029, USD Million
- TABLE 233 Malaysia Antacids Market, 2019 - 2022, USD Million
- TABLE 234 Malaysia Antacids Market, 2023 - 2029, USD Million
- TABLE 235 Malaysia Antacids Market by Formulation Type, 2019 - 2022, USD Million
- TABLE 236 Malaysia Antacids Market by Formulation Type, 2023 - 2029, USD Million
- TABLE 237 Malaysia Antacids Market by Mechanism of Action, 2019 - 2022, USD Million
- TABLE 238 Malaysia Antacids Market by Mechanism of Action, 2023 - 2029, USD Million
- TABLE 239 Malaysia Antacids Market by Distribution Channel, 2019 - 2022, USD Million
- TABLE 240 Malaysia Antacids Market by Distribution Channel, 2023 - 2029, USD Million
- TABLE 241 Rest of Asia Pacific Antacids Market, 2019 - 2022, USD Million
- TABLE 242 Rest of Asia Pacific Antacids Market, 2023 - 2029, USD Million
- TABLE 243 Rest of Asia Pacific Antacids Market by Formulation Type, 2019 - 2022, USD Million
- TABLE 244 Rest of Asia Pacific Antacids Market by Formulation Type, 2023 - 2029, USD Million
- TABLE 245 Rest of Asia Pacific Antacids Market by Mechanism of Action, 2019 - 2022, USD Million
- TABLE 246 Rest of Asia Pacific Antacids Market by Mechanism of Action, 2023 - 2029, USD Million
- TABLE 247 Rest of Asia Pacific Antacids Market by Distribution Channel, 2019 - 2022, USD Million
- TABLE 248 Rest of Asia Pacific Antacids Market by Distribution Channel, 2023 - 2029, USD Million
- TABLE 249 LAMEA Antacids Market, 2019 - 2022, USD Million
- TABLE 250 LAMEA Antacids Market, 2023 - 2029, USD Million
- TABLE 251 LAMEA Antacids Market by Formulation Type, 2019 - 2022, USD Million
- TABLE 252 LAMEA Antacids Market by Formulation Type, 2023 - 2029, USD Million
- TABLE 253 LAMEA Tablets Market by Country, 2019 - 2022, USD Million
- TABLE 254 LAMEA Tablets Market by Country, 2023 - 2029, USD Million
- TABLE 255 LAMEA Liquids Market by Country, 2019 - 2022, USD Million
- TABLE 256 LAMEA Liquids Market by Country, 2023 - 2029, USD Million
- TABLE 257 LAMEA Others Market by Country, 2019 - 2022, USD Million
- TABLE 258 LAMEA Others Market by Country, 2023 - 2029, USD Million
- TABLE 259 LAMEA Antacids Market by Mechanism of Action, 2019 - 2022, USD Million
- TABLE 260 LAMEA Antacids Market by Mechanism of Action, 2023 - 2029, USD Million
- TABLE 261 LAMEA Non-systemic Market by Country, 2019 - 2022, USD Million
- TABLE 262 LAMEA Non-systemic Market by Country, 2023 - 2029, USD Million
- TABLE 263 LAMEA Systemic Market by Country, 2019 - 2022, USD Million
- TABLE 264 LAMEA Systemic Market by Country, 2023 - 2029, USD Million
- TABLE 265 LAMEA Antacids Market by Distribution Channel, 2019 - 2022, USD Million
- TABLE 266 LAMEA Antacids Market by Distribution Channel, 2023 - 2029, USD Million
- TABLE 267 LAMEA Drug Store & Retail Pharmacies Market by Country, 2019 - 2022, USD Million
- TABLE 268 LAMEA Drug Store & Retail Pharmacies Market by Country, 2023 - 2029, USD Million
- TABLE 269 LAMEA Hospital Pharmacies Market by Country, 2019 - 2022, USD Million
- TABLE 270 LAMEA Hospital Pharmacies Market by Country, 2023 - 2029, USD Million
- TABLE 271 LAMEA Online Pharmacies Market by Country, 2019 - 2022, USD Million
- TABLE 272 LAMEA Online Pharmacies Market by Country, 2023 - 2029, USD Million
- TABLE 273 LAMEA Antacids Market by Country, 2019 - 2022, USD Million
- TABLE 274 LAMEA Antacids Market by Country, 2023 - 2029, USD Million
- TABLE 275 Brazil Antacids Market, 2019 - 2022, USD Million
- TABLE 276 Brazil Antacids Market, 2023 - 2029, USD Million
- TABLE 277 Brazil Antacids Market by Formulation Type, 2019 - 2022, USD Million
- TABLE 278 Brazil Antacids Market by Formulation Type, 2023 - 2029, USD Million
- TABLE 279 Brazil Antacids Market by Mechanism of Action, 2019 - 2022, USD Million
- TABLE 280 Brazil Antacids Market by Mechanism of Action, 2023 - 2029, USD Million
- TABLE 281 Brazil Antacids Market by Distribution Channel, 2019 - 2022, USD Million
- TABLE 282 Brazil Antacids Market by Distribution Channel, 2023 - 2029, USD Million
- TABLE 283 Argentina Antacids Market, 2019 - 2022, USD Million
- TABLE 284 Argentina Antacids Market, 2023 - 2029, USD Million
- TABLE 285 Argentina Antacids Market by Formulation Type, 2019 - 2022, USD Million
- TABLE 286 Argentina Antacids Market by Formulation Type, 2023 - 2029, USD Million
- TABLE 287 Argentina Antacids Market by Mechanism of Action, 2019 - 2022, USD Million
- TABLE 288 Argentina Antacids Market by Mechanism of Action, 2023 - 2029, USD Million
- TABLE 289 Argentina Antacids Market by Distribution Channel, 2019 - 2022, USD Million
- TABLE 290 Argentina Antacids Market by Distribution Channel, 2023 - 2029, USD Million
- TABLE 291 UAE Antacids Market, 2019 - 2022, USD Million
- TABLE 292 UAE Antacids Market, 2023 - 2029, USD Million
- TABLE 293 UAE Antacids Market by Formulation Type, 2019 - 2022, USD Million
- TABLE 294 UAE Antacids Market by Formulation Type, 2023 - 2029, USD Million
- TABLE 295 UAE Antacids Market by Mechanism of Action, 2019 - 2022, USD Million
- TABLE 296 UAE Antacids Market by Mechanism of Action, 2023 - 2029, USD Million
- TABLE 297 UAE Antacids Market by Distribution Channel, 2019 - 2022, USD Million
- TABLE 298 UAE Antacids Market by Distribution Channel, 2023 - 2029, USD Million
- TABLE 299 Saudi Arabia Antacids Market, 2019 - 2022, USD Million
- TABLE 300 Saudi Arabia Antacids Market, 2023 - 2029, USD Million
- TABLE 301 Saudi Arabia Antacids Market by Formulation Type, 2019 - 2022, USD Million
- TABLE 302 Saudi Arabia Antacids Market by Formulation Type, 2023 - 2029, USD Million
- TABLE 303 Saudi Arabia Antacids Market by Mechanism of Action, 2019 - 2022, USD Million
- TABLE 304 Saudi Arabia Antacids Market by Mechanism of Action, 2023 - 2029, USD Million
- TABLE 305 Saudi Arabia Antacids Market by Distribution Channel, 2019 - 2022, USD Million
- TABLE 306 Saudi Arabia Antacids Market by Distribution Channel, 2023 - 2029, USD Million
- TABLE 307 South Africa Antacids Market, 2019 - 2022, USD Million
- TABLE 308 South Africa Antacids Market, 2023 - 2029, USD Million
- TABLE 309 South Africa Antacids Market by Formulation Type, 2019 - 2022, USD Million
- TABLE 310 South Africa Antacids Market by Formulation Type, 2023 - 2029, USD Million
- TABLE 311 South Africa Antacids Market by Mechanism of Action, 2019 - 2022, USD Million
- TABLE 312 South Africa Antacids Market by Mechanism of Action, 2023 - 2029, USD Million
- TABLE 313 South Africa Antacids Market by Distribution Channel, 2019 - 2022, USD Million
- TABLE 314 South Africa Antacids Market by Distribution Channel, 2023 - 2029, USD Million
- TABLE 315 Nigeria Antacids Market, 2019 - 2022, USD Million
- TABLE 316 Nigeria Antacids Market, 2023 - 2029, USD Million
- TABLE 317 Nigeria Antacids Market by Formulation Type, 2019 - 2022, USD Million
- TABLE 318 Nigeria Antacids Market by Formulation Type, 2023 - 2029, USD Million
- TABLE 319 Nigeria Antacids Market by Mechanism of Action, 2019 - 2022, USD Million
- TABLE 320 Nigeria Antacids Market by Mechanism of Action, 2023 - 2029, USD Million
- TABLE 321 Nigeria Antacids Market by Distribution Channel, 2019 - 2022, USD Million
- TABLE 322 Nigeria Antacids Market by Distribution Channel, 2023 - 2029, USD Million
- TABLE 323 Rest of LAMEA Antacids Market, 2019 - 2022, USD Million
- TABLE 324 Rest of LAMEA Antacids Market, 2023 - 2029, USD Million
- TABLE 325 Rest of LAMEA Antacids Market by Formulation Type, 2019 - 2022, USD Million
- TABLE 326 Rest of LAMEA Antacids Market by Formulation Type, 2023 - 2029, USD Million
- TABLE 327 Rest of LAMEA Antacids Market by Mechanism of Action, 2019 - 2022, USD Million
- TABLE 328 Rest of LAMEA Antacids Market by Mechanism of Action, 2023 - 2029, USD Million
- TABLE 329 Rest of LAMEA Antacids Market by Distribution Channel, 2019 - 2022, USD Million
- TABLE 330 Rest of LAMEA Antacids Market by Distribution Channel, 2023 - 2029, USD Million
- TABLE 331 Key Information - Abbott Laboratories
- TABLE 332 Key Information - Alkem Laboratories Ltd.
- TABLE 333 Key Information - Bayer AG
- TABLE 334 Key Information - Cipla Limited
- TABLE 335 Key Information - Pfizer, Inc.
- TABLE 336 Key Information - Prestige Consumer Healthcare, Inc.
- TABLE 337 Key information - Reckitt Benckiser Group PLC
- TABLE 338 Key Information - WellSpring Pharmaceutical Corporation
- TABLE 339 Key Information - Sanofi S.A.
- TABLE 340 Key Information - Sun Pharmaceutical Industries Ltd.
List of Figures
- FIG 1 Methodology for the research
- FIG 2 Global Antacids Market Share by Formulation Type, 2022
- FIG 3 Global Antacids Market Share by Formulation Type, 2029
- FIG 4 Global Antacids Market by Formulation Type, 2019 - 2029, USD Million
- FIG 5 Global Antacids Market Share by Mechanism of Action, 2022
- FIG 6 Global Antacids Market Share by Mechanism of Action, 2029
- FIG 7 Global Antacids Market by Mechanism of Action, 2019 - 2029, USD Million
- FIG 8 Global Antacids Market Share by Distribution Channel, 2022
- FIG 9 Global Antacids Market Share by Distribution Channel, 2029
- FIG 10 Global Antacids Market by Distribution Channel, 2019 - 2029, USD Million
- FIG 11 Global Antacids Market Share by Region, 2022
- FIG 12 Global Antacids Market Share by Region, 2029
- FIG 13 Global Antacids Market by Region, 2019 - 2029, USD Million
- FIG 14 Swot analysis: Abbott laboratories
- FIG 15 Swot analysis: bayer ag
The Global Antacids Market size is expected to reach $7.9 billion by 2029, rising at a market growth of 3.2% CAGR during the forecast period.
Antacids are widely used in the form of tablets as it is a preferred option for consumers due to their accessibility, convenience, and variety of flavors and formulations, hence tablets category generated $3,249 million in 2022. The prevalence of GERD in the US was estimated to be around 18.1-27.8% in 2022, as reported by the National Library of Medicine. In addition, the National GI Survey revealed that a sizable percentage of individuals experience GERD episodes twice a week, with many patients displaying the symptoms at least once a week. Some of the factors impacting the market are increased consumption of fast food causes digestive disorders like indigestion, Rapidly Increasing Geriatric Population Globally and Increasing availability of improved medications.
Due to the growing incidence of gastrointestinal symptoms, such as heartburn and acid reflux, among COVID-19 patients, the antacids sector saw a rise in demand. However, Because of the lockdowns and trade and movement restrictions, it was challenging for manufacturers to transport finished goods and procure raw materials, which resulted in a decline in supply and a rise in demand for antacids. This had a considerable supportive effect on the industry.
Fast food consumption has considerably expanded on a worldwide basis. Both allergies and obesity are associated with frequent fast-food intake. Therefore, as the consumption of fast foods is increasing rapidly among all age groups, it will increase the prevalence of stomach and digestive issues. This will significantly boost the growth of the market. By the year 2030, one out of every six people will be at least 60 years old. Over 60s will make up 1.4 billion individuals by this time, up from 1 billion in 2020. By 2050, there will be twice as many persons aged 60 or older, and it will reach a staggering 2.1 billion. Therefore, the market growth is anticipated to soar in the anticipated period due to the condition's higher prevalence among the elderly. However, H2 receptor antagonists and proton pump inhibitors (PPIs) are two examples of newer, more potent treatments for acid-related illnesses that are posing a challenge to the industry.
Mechanism of action Outlook
Based on mechanism of action, the market is characterized into systemic antacids and non-systemic antacids. The systemic antacids segment procured a considerable growth rate in the market in 2022. These antacids, like sodium bicarbonate, generate systemic alkalosis and are soluble and resorbable. The effervescence of bicarbonate shows an abundance of painkiller/antacid combos. In addition, these chemicals produce carbon dioxide when it reacts with the hydrochloric acid in the stomach; it is quickly absorbed but can occasionally result in a pleasant burp. The easy availability of these types of antacids is propelling the growth of the market.
Formulation Type Outlook
On the basis of formulation type, the market is classified into tablets, liquids, and others. The tablets segment acquired the largest revenue share in the market in 2022. The market's major players provide an assortment of antacid tablet products. Furthermore, the creation and introduction of chewable antacid pills have also increased the demand for tablets. All these factors are boosting the expansion of the segment.
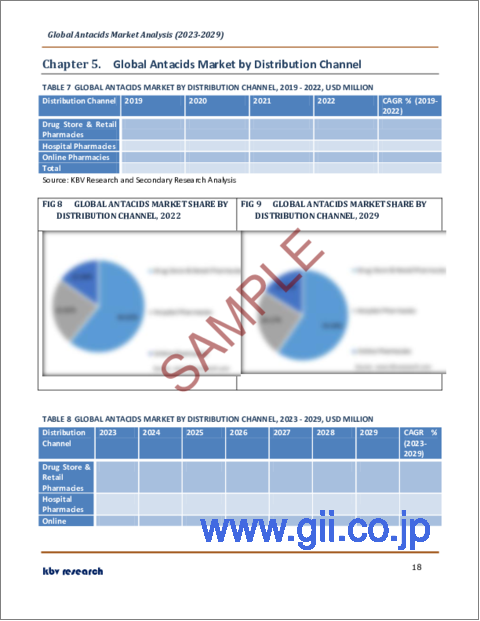
Distribution Channel Outlook
By distribution channel, the market is divided into hospital pharmacies, drug stores & retail pharmacies, and online providers. The drug stores & retail pharmacies segment witnessed the maximum revenue share in the market in 2022. Due to the convenience these establishments provide for customers and the widespread availability of antacids, the drug stores & retail pharmacies sector led the market. Additionally, many people choose to buy over-the-counter antacids for occasional indigestion or heartburn rather than wanting a prescription drug or medical intervention, which furthers the segment's growth.
Regional Outlook
Region wise, the market is analyzed across North America, Europe, Asia Pacific, and LAMEA. The North America segment procured the highest revenue share in the market in 2022. The expansion in North America is linked to the region's accessible, highly developed healthcare system, the presence of the most important players, the rise in cases of heartburn, and the simplicity of obtaining over-the-counter medications. Additionally, GERD, gastritis, and peptic ulcer disease are very common in the United States and other major North American nations, which increases the demand for antacid medications.
The market research report covers the analysis of key stake holders of the market. Key companies profiled in the report include Abbott Laboratories, Alkem Laboratories Ltd., Bayer AG, Cipla Limited, Pfizer, Inc., Prestige Consumer Healthcare, Inc., Reckitt Benckiser Group PLC, WellSpring Pharmaceutical Corporation (Avista Capital Partners), Sanofi S.A. and Sun Pharmaceutical Industries Ltd.
Scope of the Study
Market Segments covered in the Report:
By Formulation Type
- Tablets
- Liquids
- Others
By Mechanism of Action
- Non-systemic
- Systemic
By Distribution Channel
- Drug Store & Retail Pharmacies
- Hospital Pharmacies
- Online Pharmacies
By Geography
- North America
- US
- Canada
- Mexico
- Rest of North America
- Europe
- Germany
- UK
- France
- Russia
- Spain
- Italy
- Rest of Europe
- Asia Pacific
- China
- Japan
- India
- South Korea
- Singapore
- Malaysia
- Rest of Asia Pacific
- LAMEA
- Brazil
- Argentina
- UAE
- Saudi Arabia
- South Africa
- Nigeria
- Rest of LAMEA
Companies Profiled
- Abbott Laboratories
- Alkem Laboratories Ltd.
- Bayer AG
- Cipla Limited
- Pfizer, Inc.
- Prestige Consumer Healthcare, Inc.
- Reckitt Benckiser Group PLC
- WellSpring Pharmaceutical Corporation (Avista Capital Partners)
- Sanofi S.A.
- Sun Pharmaceutical Industries Ltd.
Unique Offerings from KBV Research
- Exhaustive coverage
- Highest number of market tables and figures
- Subscription based model available
- Guaranteed best price
- Assured post sales research support with 10% customization free
Table of Contents
Chapter 1. Market Scope & Methodology
- 1.1 Market Definition
- 1.2 Objectives
- 1.3 Market Scope
- 1.4 Segmentation
- 1.4.1 Global Antacids Market, by Formulation Type
- 1.4.2 Global Antacids Market, by Mechanism of Action
- 1.4.3 Global Antacids Market, by Distribution Channel
- 1.4.4 Global Antacids Market, by Geography
- 1.5 Methodology for the research
Chapter 2. Market Overview
- 2.1 Introduction
- 2.1.1 Overview
- 2.1.1.1 Market Composition & Scenario
- 2.1.1 Overview
- 2.2 Key Factors Impacting the Market
- 2.2.1 Market Drivers
- 2.2.2 Market Restraints
Chapter 3. Global Antacids Market by Formulation Type
- 3.1 Global Tablets Market by Region
- 3.2 Global Liquids Market by Region
- 3.3 Global Others Market by Region
Chapter 4. Global Antacids Market by Mechanism of Action
- 4.1 Global Non-systemic Market by Region
- 4.2 Global Systemic Market by Region
Chapter 5. Global Antacids Market by Distribution Channel
- 5.1 Global Drug Store & Retail Pharmacies Market by Region
- 5.2 Global Hospital Pharmacies Market by Region
- 5.3 Global Online Pharmacies Market by Region
Chapter 6. Global Antacids Market by Region
- 6.1 North America Antacids Market
- 6.1.1 North America Antacids Market by Formulation Type
- 6.1.1.1 North America Tablets Market by Country
- 6.1.1.2 North America Liquids Market by Country
- 6.1.1.3 North America Others Market by Country
- 6.1.2 North America Antacids Market by Mechanism of Action
- 6.1.2.1 North America Non-systemic Market by Country
- 6.1.2.2 North America Systemic Market by Country
- 6.1.3 North America Antacids Market by Distribution Channel
- 6.1.3.1 North America Drug Store & Retail Pharmacies Market by Country
- 6.1.3.2 North America Hospital Pharmacies Market by Country
- 6.1.3.3 North America Online Pharmacies Market by Country
- 6.1.4 North America Antacids Market by Country
- 6.1.4.1 US Antacids Market
- 6.1.4.1.1 US Antacids Market by Formulation Type
- 6.1.4.1.2 US Antacids Market by Mechanism of Action
- 6.1.4.1.3 US Antacids Market by Distribution Channel
- 6.1.4.2 Canada Antacids Market
- 6.1.4.2.1 Canada Antacids Market by Formulation Type
- 6.1.4.2.2 Canada Antacids Market by Mechanism of Action
- 6.1.4.2.3 Canada Antacids Market by Distribution Channel
- 6.1.4.3 Mexico Antacids Market
- 6.1.4.3.1 Mexico Antacids Market by Formulation Type
- 6.1.4.3.2 Mexico Antacids Market by Mechanism of Action
- 6.1.4.3.3 Mexico Antacids Market by Distribution Channel
- 6.1.4.4 Rest of North America Antacids Market
- 6.1.4.4.1 Rest of North America Antacids Market by Formulation Type
- 6.1.4.4.2 Rest of North America Antacids Market by Mechanism of Action
- 6.1.4.4.3 Rest of North America Antacids Market by Distribution Channel
- 6.1.4.1 US Antacids Market
- 6.1.1 North America Antacids Market by Formulation Type
- 6.2 Europe Antacids Market
- 6.2.1 Europe Antacids Market by Formulation Type
- 6.2.1.1 Europe Tablets Market by Country
- 6.2.1.2 Europe Liquids Market by Country
- 6.2.1.3 Europe Others Market by Country
- 6.2.2 Europe Antacids Market by Mechanism of Action
- 6.2.2.1 Europe Non-systemic Market by Country
- 6.2.2.2 Europe Systemic Market by Country
- 6.2.3 Europe Antacids Market by Distribution Channel
- 6.2.3.1 Europe Drug Store & Retail Pharmacies Market by Country
- 6.2.3.2 Europe Hospital Pharmacies Market by Country
- 6.2.3.3 Europe Online Pharmacies Market by Country
- 6.2.4 Europe Antacids Market by Country
- 6.2.4.1 Germany Antacids Market
- 6.2.4.1.1 Germany Antacids Market by Formulation Type
- 6.2.4.1.2 Germany Antacids Market by Mechanism of Action
- 6.2.4.1.3 Germany Antacids Market by Distribution Channel
- 6.2.4.2 UK Antacids Market
- 6.2.4.2.1 UK Antacids Market by Formulation Type
- 6.2.4.2.2 UK Antacids Market by Mechanism of Action
- 6.2.4.2.3 UK Antacids Market by Distribution Channel
- 6.2.4.3 France Antacids Market
- 6.2.4.3.1 France Antacids Market by Formulation Type
- 6.2.4.3.2 France Antacids Market by Mechanism of Action
- 6.2.4.3.3 France Antacids Market by Distribution Channel
- 6.2.4.4 Russia Antacids Market
- 6.2.4.4.1 Russia Antacids Market by Formulation Type
- 6.2.4.4.2 Russia Antacids Market by Mechanism of Action
- 6.2.4.4.3 Russia Antacids Market by Distribution Channel
- 6.2.4.5 Spain Antacids Market
- 6.2.4.5.1 Spain Antacids Market by Formulation Type
- 6.2.4.5.2 Spain Antacids Market by Mechanism of Action
- 6.2.4.5.3 Spain Antacids Market by Distribution Channel
- 6.2.4.6 Italy Antacids Market
- 6.2.4.6.1 Italy Antacids Market by Formulation Type
- 6.2.4.6.2 Italy Antacids Market by Mechanism of Action
- 6.2.4.6.3 Italy Antacids Market by Distribution Channel
- 6.2.4.7 Rest of Europe Antacids Market
- 6.2.4.7.1 Rest of Europe Antacids Market by Formulation Type
- 6.2.4.7.2 Rest of Europe Antacids Market by Mechanism of Action
- 6.2.4.7.3 Rest of Europe Antacids Market by Distribution Channel
- 6.2.4.1 Germany Antacids Market
- 6.2.1 Europe Antacids Market by Formulation Type
- 6.3 Asia Pacific Antacids Market
- 6.3.1 Asia Pacific Antacids Market by Formulation Type
- 6.3.1.1 Asia Pacific Tablets Market by Country
- 6.3.1.2 Asia Pacific Liquids Market by Country
- 6.3.1.3 Asia Pacific Others Market by Country
- 6.3.2 Asia Pacific Antacids Market by Mechanism of Action
- 6.3.2.1 Asia Pacific Non-systemic Market by Country
- 6.3.2.2 Asia Pacific Systemic Market by Country
- 6.3.3 Asia Pacific Antacids Market by Distribution Channel
- 6.3.3.1 Asia Pacific Drug Store & Retail Pharmacies Market by Country
- 6.3.3.2 Asia Pacific Hospital Pharmacies Market by Country
- 6.3.3.3 Asia Pacific Online Pharmacies Market by Country
- 6.3.4 Asia Pacific Antacids Market by Country
- 6.3.4.1 China Antacids Market
- 6.3.4.1.1 China Antacids Market by Formulation Type
- 6.3.4.1.2 China Antacids Market by Mechanism of Action
- 6.3.4.1.3 China Antacids Market by Distribution Channel
- 6.3.4.2 Japan Antacids Market
- 6.3.4.2.1 Japan Antacids Market by Formulation Type
- 6.3.4.2.2 Japan Antacids Market by Mechanism of Action
- 6.3.4.2.3 Japan Antacids Market by Distribution Channel
- 6.3.4.3 India Antacids Market
- 6.3.4.3.1 India Antacids Market by Formulation Type
- 6.3.4.3.2 India Antacids Market by Mechanism of Action
- 6.3.4.3.3 India Antacids Market by Distribution Channel
- 6.3.4.4 South Korea Antacids Market
- 6.3.4.4.1 South Korea Antacids Market by Formulation Type
- 6.3.4.4.2 South Korea Antacids Market by Mechanism of Action
- 6.3.4.4.3 South Korea Antacids Market by Distribution Channel
- 6.3.4.5 Singapore Antacids Market
- 6.3.4.5.1 Singapore Antacids Market by Formulation Type
- 6.3.4.5.2 Singapore Antacids Market by Mechanism of Action
- 6.3.4.5.3 Singapore Antacids Market by Distribution Channel
- 6.3.4.6 Malaysia Antacids Market
- 6.3.4.6.1 Malaysia Antacids Market by Formulation Type
- 6.3.4.6.2 Malaysia Antacids Market by Mechanism of Action
- 6.3.4.6.3 Malaysia Antacids Market by Distribution Channel
- 6.3.4.7 Rest of Asia Pacific Antacids Market
- 6.3.4.7.1 Rest of Asia Pacific Antacids Market by Formulation Type
- 6.3.4.7.2 Rest of Asia Pacific Antacids Market by Mechanism of Action
- 6.3.4.7.3 Rest of Asia Pacific Antacids Market by Distribution Channel
- 6.3.4.1 China Antacids Market
- 6.3.1 Asia Pacific Antacids Market by Formulation Type
- 6.4 LAMEA Antacids Market
- 6.4.1 LAMEA Antacids Market by Formulation Type
- 6.4.1.1 LAMEA Tablets Market by Country
- 6.4.1.2 LAMEA Liquids Market by Country
- 6.4.1.3 LAMEA Others Market by Country
- 6.4.2 LAMEA Antacids Market by Mechanism of Action
- 6.4.2.1 LAMEA Non-systemic Market by Country
- 6.4.2.2 LAMEA Systemic Market by Country
- 6.4.3 LAMEA Antacids Market by Distribution Channel
- 6.4.3.1 LAMEA Drug Store & Retail Pharmacies Market by Country
- 6.4.3.2 LAMEA Hospital Pharmacies Market by Country
- 6.4.3.3 LAMEA Online Pharmacies Market by Country
- 6.4.4 LAMEA Antacids Market by Country
- 6.4.4.1 Brazil Antacids Market
- 6.4.4.1.1 Brazil Antacids Market by Formulation Type
- 6.4.4.1.2 Brazil Antacids Market by Mechanism of Action
- 6.4.4.1.3 Brazil Antacids Market by Distribution Channel
- 6.4.4.2 Argentina Antacids Market
- 6.4.4.2.1 Argentina Antacids Market by Formulation Type
- 6.4.4.2.2 Argentina Antacids Market by Mechanism of Action
- 6.4.4.2.3 Argentina Antacids Market by Distribution Channel
- 6.4.4.3 UAE Antacids Market
- 6.4.4.3.1 UAE Antacids Market by Formulation Type
- 6.4.4.3.2 UAE Antacids Market by Mechanism of Action
- 6.4.4.3.3 UAE Antacids Market by Distribution Channel
- 6.4.4.4 Saudi Arabia Antacids Market
- 6.4.4.4.1 Saudi Arabia Antacids Market by Formulation Type
- 6.4.4.4.2 Saudi Arabia Antacids Market by Mechanism of Action
- 6.4.4.4.3 Saudi Arabia Antacids Market by Distribution Channel
- 6.4.4.5 South Africa Antacids Market
- 6.4.4.5.1 South Africa Antacids Market by Formulation Type
- 6.4.4.5.2 South Africa Antacids Market by Mechanism of Action
- 6.4.4.5.3 South Africa Antacids Market by Distribution Channel
- 6.4.4.6 Nigeria Antacids Market
- 6.4.4.6.1 Nigeria Antacids Market by Formulation Type
- 6.4.4.6.2 Nigeria Antacids Market by Mechanism of Action
- 6.4.4.6.3 Nigeria Antacids Market by Distribution Channel
- 6.4.4.7 Rest of LAMEA Antacids Market
- 6.4.4.7.1 Rest of LAMEA Antacids Market by Formulation Type
- 6.4.4.7.2 Rest of LAMEA Antacids Market by Mechanism of Action
- 6.4.4.7.3 Rest of LAMEA Antacids Market by Distribution Channel
- 6.4.4.1 Brazil Antacids Market
- 6.4.1 LAMEA Antacids Market by Formulation Type
Chapter 7. Company Profiles
- 7.1 Abbott Laboratories
- 7.1.1 Company Overview
- 7.1.2 Financial Analysis
- 7.1.3 Segmental and Regional Analysis
- 7.1.4 Research & Development Expense
- 7.1.5 SWOT Analysis
- 7.2 Alkem Laboratories Ltd.
- 7.2.1 Company Overview
- 7.2.2 Financial Analysis
- 7.2.3 Regional Analysis
- 7.2.4 Research & Development Expenses
- 7.3 Bayer AG
- 7.3.1 Company Overview
- 7.3.2 Financial Analysis
- 7.3.3 Segmental and Regional Analysis
- 7.3.4 Research & Development Expense
- 7.3.5 SWOT Analysis
- 7.4 Cipla Limited
- 7.4.1 Company Overview
- 7.4.2 Financial Analysis
- 7.4.3 Regional Analysis
- 7.4.4 Research & Development Expense
- 7.5 Pfizer, Inc.
- 7.5.1 Company Overview
- 7.5.2 Financial Analysis
- 7.5.3 Regional & Segmental Analysis
- 7.5.4 Research & Development Expense
- 7.6 Prestige Consumer Healthcare, Inc.
- 7.6.1 Company Overview
- 7.6.2 Financial Analysis
- 7.6.3 Segmental and Regional Analysis
- 7.7 Reckitt Benckiser Group PLC
- 7.7.1 Company Overview
- 7.7.2 Financial Analysis
- 7.7.3 Segmental and Regional Analysis
- 7.7.4 Research & Development Expenses
- 7.8 WellSpring Pharmaceutical Corporation (Avista Capital Partners)
- 7.8.1 Company Overview
- 7.9 Sanofi S.A.
- 7.9.1 Company Overview
- 7.9.2 Financial Analysis
- 7.9.3 Segmental and Regional Analysis
- 7.9.4 Research & Development Expense
- 7.10. Sun Pharmaceutical Industries Ltd.
- 7.10.1 Company Overview
- 7.10.2 Financial Analysis
- 7.10.3 Regional Analysis
- 7.10.4 Research & Development Expenses