
|
市場調査レポート
商品コード
1936647
電動モビリティデバイス市場の機会、成長要因、業界動向分析、および2026年から2035年までの予測Powered Mobility Devices Market Opportunity, Growth Drivers, Industry Trend Analysis, and Forecast 2026 - 2035 |
||||||
カスタマイズ可能
|
|||||||
| 電動モビリティデバイス市場の機会、成長要因、業界動向分析、および2026年から2035年までの予測 |
|
出版日: 2026年01月21日
発行: Global Market Insights Inc.
ページ情報: 英文 140 Pages
納期: 2~3営業日
|

概要
世界の電動モビリティデバイス市場は、2025年に39億米ドルと評価され、2035年までにCAGR6.7%で成長し、78億米ドルに達すると予測されています。
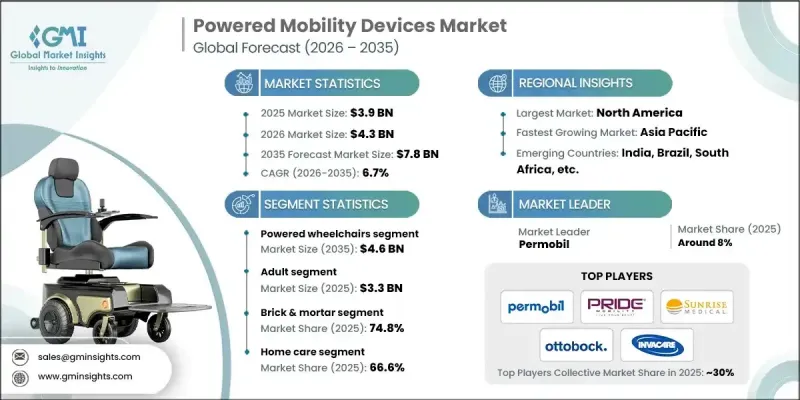
市場成長は、移動能力を損なう疾患の増加傾向と、自立した日常生活を維持するために電動モビリティデバイスへの依存度が高まる高齢人口の拡大によって支えられています。基本的な移動補助具とは異なり、電動モビリティデバイスは急速にスマート医療機器の領域へ移行しつつあります。メーカー各社は、長距離走行可能なバッテリーシステム、高効率モーター、人間工学に基づいた座席システム、快適性を向上させ介護者の負担を軽減するプログラム可能な制御装置などを統合しているからです。また、在宅ケアへの広範な移行も市場の勢いを後押ししています。患者やご家族は、高齢者が住み慣れた環境で生活し続けられるよう支援し、施設への繰り返し通院を減らし、屋内・屋外での安全な移動を可能にする実用的な移動ソリューションを好まれる傾向にあります。
| 市場範囲 | |
|---|---|
| 開始年 | 2025年 |
| 予測年度 | 2026-2035 |
| 開始時価値 | 39億米ドル |
| 予測金額 | 78億米ドル |
| CAGR | 6.7% |
製品と普及の観点から、市場は幅広い重症度範囲にわたる需要の恩恵を受けています。常時電動サポートを必要とするユーザーから、追加ユニットによる補助を求めるユーザーまで多岐にわたります。関節炎、脳卒中後の障害、脊髄損傷、神経変性疾患などの慢性疾患に伴う臨床的ニーズが高まっており、これらは短期的なリハビリ支援ではなく、長期的で信頼性の高い移動支援を必要とする場合が多いのです。技術面でも需要拡大が促進されています。現代の機器は軽量素材の採用、操作性の向上、インテリジェントブレーキ、座面の個別調整機能、転倒防止・安定性向上などの安全機能に重点を置く傾向が強まっており、施設内だけでなく日常生活においても電動モビリティデバイスの受け入れが拡大しています。
電動車椅子セグメントは2025年に46億米ドルの市場規模を記録しました。これは、高度な操作オプション、強力な姿勢サポート、屋内・屋外環境を問わない安定した性能を必要とする、重度または進行性の移動制限を持つユーザーにとって、依然として最適な解決策であるためです。これらの製品は、駆動方式、座席モジュール、安全システムによって差別化が進んでおり、ケアの経路が家庭へ移行する中でさらに注目を集めています。家庭環境では、臨床仕様と同様に、快適性、信頼性、カスタマイズ性が重要視されるためです。
在宅ケア分野は2025年に66.6%のシェアを占めました。これは、高齢者が住み慣れた住宅環境で生活したいという意向、慢性疾患の有病率増加、そして日常生活・安全性・自立性が不可欠な住宅内での利便性の高い移動手段へのニーズに後押しされたものです。在宅ケア需要は、コンパクトな設置面積、屋内移動のための旋回半径の改善、スマートな操作性、充電の簡便化といった機器の使いやすさの向上によっても支えられています。また、配送・設置・メンテナンスといったサービスモデルは、低摩擦な所有体験を求める高齢者や介護者にとっての障壁を軽減するのに役立っています。
北米電動モビリティデバイス市場は2025年に41.3%のシェアを占め、その背景には、より強固な医療インフラ、移動障害を伴う疾患の診断・治療率の高さ、償還経路や確立されたリハビリテーション/在宅ケアエコシステムを通じた比較的良好なアクセス環境が挙げられます。さらに、安全性・接続性・快適性を重視した先進技術搭載デバイスの導入加速も、この地域の市場強みを強化しています。こうした機能は、日常生活機能や生活の質の測定可能な改善を期待する医療従事者と消費者の双方に強く支持されています。
よくあるご質問
目次
第1章 調査手法と範囲
第2章 エグゼクティブサマリー
第3章 業界考察
- エコシステム分析
- 業界への影響要因
- 促進要因
- 神経疾患の増加傾向
- 電動移動製品の技術的進歩
- 高齢人口の割合の増加
- 世界の障害の増加傾向
- 業界の潜在的リスク&課題
- 電動車椅子の高コスト
- 厳格な規制枠組み
- 機会
- 軽量で折りたたみ可能な電動車椅子に焦点を当てる
- 促進要因
- 成長可能性分析
- 規制情勢
- 北米
- 欧州
- アジア太平洋地域
- 技術とイノベーションの動向
- 現在の技術動向
- 新興技術
- バリューチェーン分析
- 償還シナリオ
- 消費者行動と動向
- 製品タイプ別価格分析2025
- ポーター分析
- PESTEL分析
- ギャップ分析
- 将来の市場動向
第4章 競合情勢
- イントロダクション
- 企業マトリックス分析
- 企業の市場シェア分析
- 世界
- 北米
- 欧州
- アジア太平洋地域
- 主要市場企業の競合分析
- 競合ポジショニングマトリックス
- 主な発展
- 合併・買収
- 提携・協業
- 新製品の発売
- 拡大計画
第5章 市場推計・予測:製品タイプ別、2022-2035
- 電動車椅子
- 後輪駆動式車椅子
- ミッドホイールドライブ車椅子
- 前輪駆動式車椅子
- 複合駆動式車椅子
- 電動モビリティスクーター
- 三輪式移動機器
- 四輪式移動機器
- パワーアドオンまたは推進補助ユニット
第6章 市場推計・予測:患者別、2022-2035
- 成人用
- 小児
第7章 市場推計・予測:流通チャネル別、2022-2035
- 実店舗
- オンラインチャネル
第8章 市場推計・予測:最終用途別、2022-2035
- 在宅ケア
- リハビリテーションセンター
- 病院
- その他のエンドユーザー
第9章 市場推計・予測:地域別、2022-2035
- 北米
- 米国
- カナダ
- 欧州
- ドイツ
- 英国
- フランス
- スペイン
- イタリア
- オランダ
- アジア太平洋地域
- 中国
- 日本
- インド
- オーストラリア
- 韓国
- ラテンアメリカ
- ブラジル
- メキシコ
- アルゼンチン
- 中東・アフリカ地域
- 南アフリカ
- サウジアラビア
- アラブ首長国連邦
第10章 企業プロファイル
- Airwheel
- Callidai Motor Works
- Decon
- DriveDeVilbiss Healthcare
- Frido
- Golden Technologies
- INVACARE
- Karman Healthcare
- LEVO
- Merits Health Products
- MEYRA
- Ostrich Mobility Instruments
- Ottobock
- Permobil
- Pride Mobility
- Sunrise medical
