|
|
市場調査レポート
商品コード
1276687
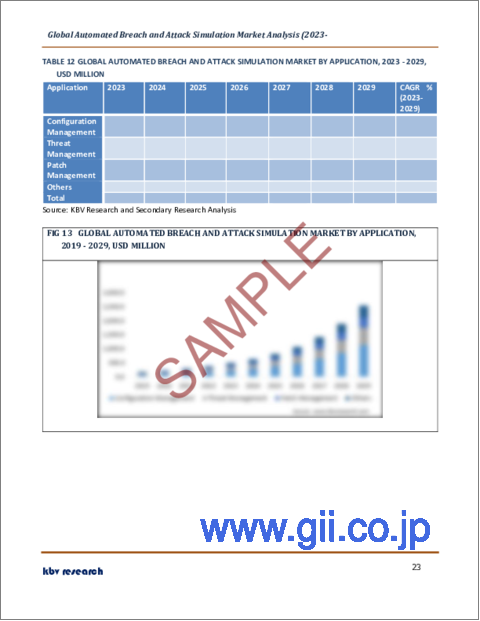
自動BAS(Breach and Attack Simulation)の世界市場規模、シェア、産業動向分析レポート:提供別、展開モード別、エンドユーザー別、アプリケーション別、地域別展望と予測、2023年~2029年Global Automated Breach and Attack Simulation Market Size, Share & Industry Trends Analysis Report By Offering, By Deployment Mode, By End User, By Application, By Regional Outlook and Forecast, 2023 - 2029 |
||||||
|
|
|||||||


| 自動BAS(Breach and Attack Simulation)の世界市場規模、シェア、産業動向分析レポート:提供別、展開モード別、エンドユーザー別、アプリケーション別、地域別展望と予測、2023年~2029年 |
|
出版日: 2023年04月28日
発行: KBV Research
ページ情報: 英文 244 Pages
納期: 即納可能
|
- 全表示
- 概要
- 図表
- 目次
自動BAS(Breach and Attack Simulation)市場規模は、2029年までに25億米ドルに達すると予測され、予測期間中にCAGR31.4%の市場成長率で上昇する見込みです。
セキュリティ投資の拡大やセキュリティ要件の遵守に対する懸念から、自動BAS(Breach and Attack Simulation)の市場は世界的に拡大すると予測されています。実際の攻撃状況をモデル化することで、セキュリティ評価の自動化を可能にするプラットフォームや技術が、自動BAS(Breach and Attack Simulation)ソリューションです。これらのソリューションは、ユーザーが現在のセキュリティシステムの欠陥を発見するのを支援することで、データセキュリティを強化します。
産業データの量は増加しており、組織のセキュリティを強化し、施設の運用を改善するための分析ツールやソリューションへのニーズが高まっています。これらが市場成長の主な促進要因となっています。自動BAS(Breach and Attack Simulation)は、自動化された攻撃を開始するために使用することができ、予期しないまたは計画されたシミュレーション攻撃を開始するために頻繁に利用されます。複雑な攻撃を開始し、組織のサイバーセキュリティインフラの状態を評価するために、人工知能(AI)と機械学習(ML)機能を備えています。
COVID-19の影響分析
COVID-19の発生は、自動BAS(Breach and Attack Simulation)市場の拡大にプラスの影響を与えました。その要因として、デジタルソリューションの人気の上昇、非倫理的なハッカーの動向によるサイバー攻撃の脅威の上昇などが挙げられます。COVID-19の大流行時に中小企業が効果的なABASソリューションの導入を奨励され、これが自動BAS(Breach and Attack Simulation)(ABAS)市場の成長を促進しました。これにより、現在のセキュリティアーキテクチャと、組織のリソースに侵入するための高度な手法を用いるサイバー攻撃とのギャップを埋めることができました。
市場成長要因
データ漏洩の増加により、ABASソリューションのニーズが高まる
健全なネットワークアーキテクチャには、何重もの予防策が盛り込まれていることが理想的です。ネットワークアーキテクチャには、予防的な対策に加えて、調査的な対策も必要です。サイバー攻撃の大半は防ぐことができないです。ファイアウォールが特定の種類のトラフィックがネットワークに侵入するのをブロックする機能を備えているにもかかわらず、予防的手法がそのような攻撃を特定し阻止できない場合があります。有害または違法なトラフィックがセキュリティ対策を回避しながらシステムに侵入した場合、ログにその旨が表示されないことがあります。差し迫った攻撃を検出するために、これらの有害なエントリを調べることはありません。そのため、このような攻撃を認識し、阻止するためには、強固なネットワークアーキテクチャと、自動BAS(Breach and Attack Simulation)が必要です。
セキュリティ脅威の管理における複雑化
ビジネスのデジタル化が継続的かつ急速に進み、アプリケーションベースのソリューションの数が世界的に増加していることが確認されています。しかし、アプリケーションに関連するセキュリティ問題をすべて解決したソリューションはありません。シミュレーションプラットフォームは、これらの問題を解決し、システムの脆弱性調査を支援するのに有効です。また、脆弱性が特定されると、開発者は特定された脆弱性から企業システムを容易に保護することができます。このようにセキュリティ脅威の管理が複雑化しているため、自動BAS(Breach and Attack Simulation)ソリューションの必要性が生じ、市場の拡大に繋がっているのです。
市場抑制要因
熟練したプロフェッショナルの不足
ペネトレーションテストは高価なサービスです。侵入テストが正しく行われないと、サービスプロバイダーと顧客企業の双方が経済的損失を被る可能性があります。雇用者の中には、サイバーセキュリティの専門家が不足しており、この不足がビジネスに直接影響すると考えている人もいます。このことは、スキルギャップを解消し、サイバー攻撃を発見し評価するために必要な能力を生み出す、適切かつ優れたセキュリティ専門家のトレーニングの必要性を強調しています。セキュリティ専門家の不足は、市場の拡大を遅らせる可能性があります。
提供の展望
自動BAS(Breach and Attack Simulation)市場は、提供形態によって、プラットフォーム・ツール、サービスに区分されます。2022年の自動BAS(Breach and Attack Simulation)市場では、プラットフォーム・ツール部門が最も高い収益シェアを占めています。これは、サイバーセキュリティプロバイダーがプラットフォームとして自動BAS(Breach and Attack Simulation)ソリューションを提供しているためです。キルチェーン全体に沿った攻撃を模倣し、継続的なアップグレードやメンテナンスの際に追加の危険を取り除くことができるため、エンドユーザーはこれらのソリューションを選択することが推奨されます。
展開モードの展望
自動BAS(Breach and Attack Simulation)市場は、展開モードによって、オンプレミスとクラウドに分類されます。2022年、自動BAS(Breach and Attack Simulation)市場では、クラウドセグメントが大きな収益シェアを獲得しました。組織は、コスト削減とビジネスの俊敏性を高めるために、クラウドベースのABASソリューションを使用しています。その手頃な価格と簡便性から、中小企業はクラウドベースの導入を好んでいます。中小企業は、これらのソリューションのクラウドベースの展開の助けを借りて、はるかに低いコストで脆弱性を調べ、脅威環境を軽減し、顧客にサービスを提供する能力を高めることができます。
アプリケーションの展望
自動BAS(Breach and Attack Simulation)市場は、アプリケーション別に、構成管理、パッチ管理、脅威管理、その他に分類されます。脅威管理は、2022年の自動BAS(Breach and Attack Simulation)市場でかなりの収益シェアを獲得しました。脅威インテリジェンスシステムは、現在および新たな脅威ベクトルに関する多くのソースからのデータを収集および分析し、さまざまなセキュリティ制御ソリューションが効率的に使用できる実用的な脅威管理のフィードとレポートを作成します。これらのソリューションは、高度な持続的脅威(APT)、ゼロデイ攻撃、およびその他の類似の懸念事項の危険性を通知することにより、データ侵害の発生の可能性から組織を保護することを支援します。
エンドユーザーの展望
エンドユーザー別に見ると、自動BAS(Breach and Attack Simulation)市場は、エンタープライズ・データセンターとマネージドサービスプロバイダーに二分されます。2022年、エンタープライズ・データセンター部門は、自動BAS(Breach and Attack Simulation)市場において最大の収益シェアを記録しました。様々なエンドユーザーによるサイバーセキュリティへの支出が増加しているにもかかわらず、新たな攻撃ベクトルをプロアクティブに軽減する効果にはまだ大きな隔たりがあり、ほとんどのインシデントは報告されないか、一部しか報告されません。今日の高度なサイバー攻撃に対抗するため、企業は侵害緩和のためのプロアクティブな戦略の実施を検討しています。
地域別の展望
地域別に見ると、自動BAS(Breach and Attack Simulation)市場は、北米、欧州、アジア太平洋、LAMEAで分析されています。2022年、北米地域は最大の収益シェアを獲得し、自動BAS(Breach and Attack Simulation)市場をリードしました。これは、技術的に先進的な地域であり、アーリーアダプターの人口が多く、主要な市場参入企業が存在することに起因しています。スマートシティ、スマートインフラなどの政府プログラムの拡大、ABASへのAIやMLの組み込みをめぐる進歩、クラウドベースのABASの需要の高まりは、ABASの需要を促進すると予測されています。
目次
第1章 市場範囲と調査手法
- 市場の定義
- 目的
- 市場範囲
- セグメンテーション
- 調査手法
第2章 市場概要
- イントロダクション
- 概要
- 市場構成とシナリオ
- 概要
- 市場に影響を与える主な要因
- 市場促進要因
- 市場抑制要因
第3章 自動BAS(Breach and Attack Simulation)市場に展開される戦略
第4章 世界の自動BAS(Breach and Attack Simulation)市場:提供別
- 世界のプラットフォーム・ツール市場:地域別
- 世界のサービス市場:地域別
第5章 世界の自動BAS(Breach and Attack Simulation)市場:展開モード別
- 世界のオンプレミス市場:地域別
- 世界のクラウド市場:地域別
第6章 世界の自動BAS(Breach and Attack Simulation)市場:エンドユーザー別
- 世界のエンタープライズ・データセンター市場:地域別
- 世界のマネージドサービスプロバイダー市場:地域別
第7章 世界の自動BAS(Breach and Attack Simulation)市場:アプリケーション別
- 世界の構成管理市場:地域別
- 世界の脅威管理市場:地域別
- 世界のパッチ管理市場:地域別
- 世界のその他の市場:地域別
第8章 世界の自動BAS(Breach and Attack Simulation)市場:地域別
- 北米
- 北米の市場:国別
- 米国
- カナダ
- メキシコ
- その他北米地域
- 北米の市場:国別
- 欧州
- 欧州の市場:国別
- ドイツ
- 英国
- フランス
- ロシア
- スペイン
- イタリア
- その他欧州地域
- 欧州の市場:国別
- アジア太平洋
- アジア太平洋の市場:国別
- 中国
- 日本
- インド
- 韓国
- シンガポール
- マレーシア
- その他アジア太平洋地域
- アジア太平洋の市場:国別
- ラテンアメリカ・中東・アフリカ
- ラテンアメリカ・中東・アフリカの市場:国別
- ブラジル
- アルゼンチン
- アラブ首長国連邦
- サウジアラビア
- 南アフリカ
- ナイジェリア
- その他ラテンアメリカ・中東・アフリカ地域
- ラテンアメリカ・中東・アフリカの市場:国別
第9章 企業プロファイル
- Qualys, Inc
- Rapid7, Inc(IntSights)
- Sophos Group PLC(Thoma Bravo)
- Keysight Technologies, Inc
- Skybox Security, Inc
- NopSeccom, Inc.
- ReliaQuest, LLC
- SCYTHE Inc
- CyCognito Ltd
- FireEye, Inc
LIST OF TABLES
- TABLE 1 Global Automated Breach and Attack Simulation Market, 2019 - 2022, USD Million
- TABLE 2 Global Automated Breach and Attack Simulation Market, 2023 - 2029, USD Million
- TABLE 3 Global Automated Breach and Attack Simulation Market by Offering, 2019 - 2022, USD Million
- TABLE 4 Global Automated Breach and Attack Simulation Market by Offering, 2023 - 2029, USD Million
- TABLE 5 Global Platforms & Tools Market by Region, 2019 - 2022, USD Million
- TABLE 6 Global Platforms & Tools Market by Region, 2023 - 2029, USD Million
- TABLE 7 Global Services Market by Region, 2019 - 2022, USD Million
- TABLE 8 Global Services Market by Region, 2023 - 2029, USD Million
- TABLE 9 Global Automated Breach and Attack Simulation Market by Deployment Mode, 2019 - 2022, USD Million
- TABLE 10 Global Automated Breach and Attack Simulation Market by Deployment Mode, 2023 - 2029, USD Million
- TABLE 11 Global On-premise Market by Region, 2019 - 2022, USD Million
- TABLE 12 Global On-premise Market by Region, 2023 - 2029, USD Million
- TABLE 13 Global Cloud Market by Region, 2019 - 2022, USD Million
- TABLE 14 Global Cloud Market by Region, 2023 - 2029, USD Million
- TABLE 15 Global Automated Breach and Attack Simulation Market by End User, 2019 - 2022, USD Million
- TABLE 16 Global Automated Breach and Attack Simulation Market by End User, 2023 - 2029, USD Million
- TABLE 17 Global Enterprises & Data Centers Market by Region, 2019 - 2022, USD Million
- TABLE 18 Global Enterprises & Data Centers Market by Region, 2023 - 2029, USD Million
- TABLE 19 Global Managed Service Providers Market by Region, 2019 - 2022, USD Million
- TABLE 20 Global Managed Service Providers Market by Region, 2023 - 2029, USD Million
- TABLE 21 Global Automated Breach and Attack Simulation Market by Application, 2019 - 2022, USD Million
- TABLE 22 Global Automated Breach and Attack Simulation Market by Application, 2023 - 2029, USD Million
- TABLE 23 Global Configuration Management Market by Region, 2019 - 2022, USD Million
- TABLE 24 Global Configuration Management Market by Region, 2023 - 2029, USD Million
- TABLE 25 Global Threat Management Market by Region, 2019 - 2022, USD Million
- TABLE 26 Global Threat Management Market by Region, 2023 - 2029, USD Million
- TABLE 27 Global Patch Management Market by Region, 2019 - 2022, USD Million
- TABLE 28 Global Patch Management Market by Region, 2023 - 2029, USD Million
- TABLE 29 Global Others Market by Region, 2019 - 2022, USD Million
- TABLE 30 Global Others Market by Region, 2023 - 2029, USD Million
- TABLE 31 Global Automated Breach and Attack Simulation Market by Region, 2019 - 2022, USD Million
- TABLE 32 Global Automated Breach and Attack Simulation Market by Region, 2023 - 2029, USD Million
- TABLE 33 North America Automated Breach and Attack Simulation Market, 2019 - 2022, USD Million
- TABLE 34 North America Automated Breach and Attack Simulation Market, 2023 - 2029, USD Million
- TABLE 35 North America Automated Breach and Attack Simulation Market by Offering, 2019 - 2022, USD Million
- TABLE 36 North America Automated Breach and Attack Simulation Market by Offering, 2023 - 2029, USD Million
- TABLE 37 North America Platforms & Tools Market by Country, 2019 - 2022, USD Million
- TABLE 38 North America Platforms & Tools Market by Country, 2023 - 2029, USD Million
- TABLE 39 North America Services Market by Country, 2019 - 2022, USD Million
- TABLE 40 North America Services Market by Country, 2023 - 2029, USD Million
- TABLE 41 North America Automated Breach and Attack Simulation Market by Deployment Mode, 2019 - 2022, USD Million
- TABLE 42 North America Automated Breach and Attack Simulation Market by Deployment Mode, 2023 - 2029, USD Million
- TABLE 43 North America On-premise Market by Country, 2019 - 2022, USD Million
- TABLE 44 North America On-premise Market by Country, 2023 - 2029, USD Million
- TABLE 45 North America Cloud Market by Country, 2019 - 2022, USD Million
- TABLE 46 North America Cloud Market by Country, 2023 - 2029, USD Million
- TABLE 47 North America Automated Breach and Attack Simulation Market by End User, 2019 - 2022, USD Million
- TABLE 48 North America Automated Breach and Attack Simulation Market by End User, 2023 - 2029, USD Million
- TABLE 49 North America Enterprises & Data Centers Market by Country, 2019 - 2022, USD Million
- TABLE 50 North America Enterprises & Data Centers Market by Country, 2023 - 2029, USD Million
- TABLE 51 North America Managed Service Providers Market by Country, 2019 - 2022, USD Million
- TABLE 52 North America Managed Service Providers Market by Country, 2023 - 2029, USD Million
- TABLE 53 North America Automated Breach and Attack Simulation Market by Application, 2019 - 2022, USD Million
- TABLE 54 North America Automated Breach and Attack Simulation Market by Application, 2023 - 2029, USD Million
- TABLE 55 North America Configuration Management Market by Country, 2019 - 2022, USD Million
- TABLE 56 North America Configuration Management Market by Country, 2023 - 2029, USD Million
- TABLE 57 North America Threat Management Market by Country, 2019 - 2022, USD Million
- TABLE 58 North America Threat Management Market by Country, 2023 - 2029, USD Million
- TABLE 59 North America Patch Management Market by Country, 2019 - 2022, USD Million
- TABLE 60 North America Patch Management Market by Country, 2023 - 2029, USD Million
- TABLE 61 North America Others Market by Country, 2019 - 2022, USD Million
- TABLE 62 North America Others Market by Country, 2023 - 2029, USD Million
- TABLE 63 North America Automated Breach and Attack Simulation Market by Country, 2019 - 2022, USD Million
- TABLE 64 North America Automated Breach and Attack Simulation Market by Country, 2023 - 2029, USD Million
- TABLE 65 US Automated Breach and Attack Simulation Market, 2019 - 2022, USD Million
- TABLE 66 US Automated Breach and Attack Simulation Market, 2023 - 2029, USD Million
- TABLE 67 US Automated Breach and Attack Simulation Market by Offering, 2019 - 2022, USD Million
- TABLE 68 US Automated Breach and Attack Simulation Market by Offering, 2023 - 2029, USD Million
- TABLE 69 US Automated Breach and Attack Simulation Market by Deployment Mode, 2019 - 2022, USD Million
- TABLE 70 US Automated Breach and Attack Simulation Market by Deployment Mode, 2023 - 2029, USD Million
- TABLE 71 US Automated Breach and Attack Simulation Market by End User, 2019 - 2022, USD Million
- TABLE 72 US Automated Breach and Attack Simulation Market by End User, 2023 - 2029, USD Million
- TABLE 73 US Automated Breach and Attack Simulation Market by Application, 2019 - 2022, USD Million
- TABLE 74 US Automated Breach and Attack Simulation Market by Application, 2023 - 2029, USD Million
- TABLE 75 Canada Automated Breach and Attack Simulation Market, 2019 - 2022, USD Million
- TABLE 76 Canada Automated Breach and Attack Simulation Market, 2023 - 2029, USD Million
- TABLE 77 Canada Automated Breach and Attack Simulation Market by Offering, 2019 - 2022, USD Million
- TABLE 78 Canada Automated Breach and Attack Simulation Market by Offering, 2023 - 2029, USD Million
- TABLE 79 Canada Automated Breach and Attack Simulation Market by Deployment Mode, 2019 - 2022, USD Million
- TABLE 80 Canada Automated Breach and Attack Simulation Market by Deployment Mode, 2023 - 2029, USD Million
- TABLE 81 Canada Automated Breach and Attack Simulation Market by End User, 2019 - 2022, USD Million
- TABLE 82 Canada Automated Breach and Attack Simulation Market by End User, 2023 - 2029, USD Million
- TABLE 83 Canada Automated Breach and Attack Simulation Market by Application, 2019 - 2022, USD Million
- TABLE 84 Canada Automated Breach and Attack Simulation Market by Application, 2023 - 2029, USD Million
- TABLE 85 Mexico Automated Breach and Attack Simulation Market, 2019 - 2022, USD Million
- TABLE 86 Mexico Automated Breach and Attack Simulation Market, 2023 - 2029, USD Million
- TABLE 87 Mexico Automated Breach and Attack Simulation Market by Offering, 2019 - 2022, USD Million
- TABLE 88 Mexico Automated Breach and Attack Simulation Market by Offering, 2023 - 2029, USD Million
- TABLE 89 Mexico Automated Breach and Attack Simulation Market by Deployment Mode, 2019 - 2022, USD Million
- TABLE 90 Mexico Automated Breach and Attack Simulation Market by Deployment Mode, 2023 - 2029, USD Million
- TABLE 91 Mexico Automated Breach and Attack Simulation Market by End User, 2019 - 2022, USD Million
- TABLE 92 Mexico Automated Breach and Attack Simulation Market by End User, 2023 - 2029, USD Million
- TABLE 93 Mexico Automated Breach and Attack Simulation Market by Application, 2019 - 2022, USD Million
- TABLE 94 Mexico Automated Breach and Attack Simulation Market by Application, 2023 - 2029, USD Million
- TABLE 95 Rest of North America Automated Breach and Attack Simulation Market, 2019 - 2022, USD Million
- TABLE 96 Rest of North America Automated Breach and Attack Simulation Market, 2023 - 2029, USD Million
- TABLE 97 Rest of North America Automated Breach and Attack Simulation Market by Offering, 2019 - 2022, USD Million
- TABLE 98 Rest of North America Automated Breach and Attack Simulation Market by Offering, 2023 - 2029, USD Million
- TABLE 99 Rest of North America Automated Breach and Attack Simulation Market by Deployment Mode, 2019 - 2022, USD Million
- TABLE 100 Rest of North America Automated Breach and Attack Simulation Market by Deployment Mode, 2023 - 2029, USD Million
- TABLE 101 Rest of North America Automated Breach and Attack Simulation Market by End User, 2019 - 2022, USD Million
- TABLE 102 Rest of North America Automated Breach and Attack Simulation Market by End User, 2023 - 2029, USD Million
- TABLE 103 Rest of North America Automated Breach and Attack Simulation Market by Application, 2019 - 2022, USD Million
- TABLE 104 Rest of North America Automated Breach and Attack Simulation Market by Application, 2023 - 2029, USD Million
- TABLE 105 Europe Automated Breach and Attack Simulation Market, 2019 - 2022, USD Million
- TABLE 106 Europe Automated Breach and Attack Simulation Market, 2023 - 2029, USD Million
- TABLE 107 Europe Automated Breach and Attack Simulation Market by Offering, 2019 - 2022, USD Million
- TABLE 108 Europe Automated Breach and Attack Simulation Market by Offering, 2023 - 2029, USD Million
- TABLE 109 Europe Platforms & Tools Market by Country, 2019 - 2022, USD Million
- TABLE 110 Europe Platforms & Tools Market by Country, 2023 - 2029, USD Million
- TABLE 111 Europe Services Market by Country, 2019 - 2022, USD Million
- TABLE 112 Europe Services Market by Country, 2023 - 2029, USD Million
- TABLE 113 Europe Automated Breach and Attack Simulation Market by Deployment Mode, 2019 - 2022, USD Million
- TABLE 114 Europe Automated Breach and Attack Simulation Market by Deployment Mode, 2023 - 2029, USD Million
- TABLE 115 Europe On-premise Market by Country, 2019 - 2022, USD Million
- TABLE 116 Europe On-premise Market by Country, 2023 - 2029, USD Million
- TABLE 117 Europe Cloud Market by Country, 2019 - 2022, USD Million
- TABLE 118 Europe Cloud Market by Country, 2023 - 2029, USD Million
- TABLE 119 Europe Automated Breach and Attack Simulation Market by End User, 2019 - 2022, USD Million
- TABLE 120 Europe Automated Breach and Attack Simulation Market by End User, 2023 - 2029, USD Million
- TABLE 121 Europe Enterprises & Data Centers Market by Country, 2019 - 2022, USD Million
- TABLE 122 Europe Enterprises & Data Centers Market by Country, 2023 - 2029, USD Million
- TABLE 123 Europe Managed Service Providers Market by Country, 2019 - 2022, USD Million
- TABLE 124 Europe Managed Service Providers Market by Country, 2023 - 2029, USD Million
- TABLE 125 Europe Automated Breach and Attack Simulation Market by Application, 2019 - 2022, USD Million
- TABLE 126 Europe Automated Breach and Attack Simulation Market by Application, 2023 - 2029, USD Million
- TABLE 127 Europe Configuration Management Market by Country, 2019 - 2022, USD Million
- TABLE 128 Europe Configuration Management Market by Country, 2023 - 2029, USD Million
- TABLE 129 Europe Threat Management Market by Country, 2019 - 2022, USD Million
- TABLE 130 Europe Threat Management Market by Country, 2023 - 2029, USD Million
- TABLE 131 Europe Patch Management Market by Country, 2019 - 2022, USD Million
- TABLE 132 Europe Patch Management Market by Country, 2023 - 2029, USD Million
- TABLE 133 Europe Others Market by Country, 2019 - 2022, USD Million
- TABLE 134 Europe Others Market by Country, 2023 - 2029, USD Million
- TABLE 135 Europe Automated Breach and Attack Simulation Market by Country, 2019 - 2022, USD Million
- TABLE 136 Europe Automated Breach and Attack Simulation Market by Country, 2023 - 2029, USD Million
- TABLE 137 Germany Automated Breach and Attack Simulation Market, 2019 - 2022, USD Million
- TABLE 138 Germany Automated Breach and Attack Simulation Market, 2023 - 2029, USD Million
- TABLE 139 Germany Automated Breach and Attack Simulation Market by Offering, 2019 - 2022, USD Million
- TABLE 140 Germany Automated Breach and Attack Simulation Market by Offering, 2023 - 2029, USD Million
- TABLE 141 Germany Automated Breach and Attack Simulation Market by Deployment Mode, 2019 - 2022, USD Million
- TABLE 142 Germany Automated Breach and Attack Simulation Market by Deployment Mode, 2023 - 2029, USD Million
- TABLE 143 Germany Automated Breach and Attack Simulation Market by End User, 2019 - 2022, USD Million
- TABLE 144 Germany Automated Breach and Attack Simulation Market by End User, 2023 - 2029, USD Million
- TABLE 145 Germany Automated Breach and Attack Simulation Market by Application, 2019 - 2022, USD Million
- TABLE 146 Germany Automated Breach and Attack Simulation Market by Application, 2023 - 2029, USD Million
- TABLE 147 UK Automated Breach and Attack Simulation Market, 2019 - 2022, USD Million
- TABLE 148 UK Automated Breach and Attack Simulation Market, 2023 - 2029, USD Million
- TABLE 149 UK Automated Breach and Attack Simulation Market by Offering, 2019 - 2022, USD Million
- TABLE 150 UK Automated Breach and Attack Simulation Market by Offering, 2023 - 2029, USD Million
- TABLE 151 UK Automated Breach and Attack Simulation Market by Deployment Mode, 2019 - 2022, USD Million
- TABLE 152 UK Automated Breach and Attack Simulation Market by Deployment Mode, 2023 - 2029, USD Million
- TABLE 153 UK Automated Breach and Attack Simulation Market by End User, 2019 - 2022, USD Million
- TABLE 154 UK Automated Breach and Attack Simulation Market by End User, 2023 - 2029, USD Million
- TABLE 155 UK Automated Breach and Attack Simulation Market by Application, 2019 - 2022, USD Million
- TABLE 156 UK Automated Breach and Attack Simulation Market by Application, 2023 - 2029, USD Million
- TABLE 157 France Automated Breach and Attack Simulation Market, 2019 - 2022, USD Million
- TABLE 158 France Automated Breach and Attack Simulation Market, 2023 - 2029, USD Million
- TABLE 159 France Automated Breach and Attack Simulation Market by Offering, 2019 - 2022, USD Million
- TABLE 160 France Automated Breach and Attack Simulation Market by Offering, 2023 - 2029, USD Million
- TABLE 161 France Automated Breach and Attack Simulation Market by Deployment Mode, 2019 - 2022, USD Million
- TABLE 162 France Automated Breach and Attack Simulation Market by Deployment Mode, 2023 - 2029, USD Million
- TABLE 163 France Automated Breach and Attack Simulation Market by End User, 2019 - 2022, USD Million
- TABLE 164 France Automated Breach and Attack Simulation Market by End User, 2023 - 2029, USD Million
- TABLE 165 France Automated Breach and Attack Simulation Market by Application, 2019 - 2022, USD Million
- TABLE 166 France Automated Breach and Attack Simulation Market by Application, 2023 - 2029, USD Million
- TABLE 167 Russia Automated Breach and Attack Simulation Market, 2019 - 2022, USD Million
- TABLE 168 Russia Automated Breach and Attack Simulation Market, 2023 - 2029, USD Million
- TABLE 169 Russia Automated Breach and Attack Simulation Market by Offering, 2019 - 2022, USD Million
- TABLE 170 Russia Automated Breach and Attack Simulation Market by Offering, 2023 - 2029, USD Million
- TABLE 171 Russia Automated Breach and Attack Simulation Market by Deployment Mode, 2019 - 2022, USD Million
- TABLE 172 Russia Automated Breach and Attack Simulation Market by Deployment Mode, 2023 - 2029, USD Million
- TABLE 173 Russia Automated Breach and Attack Simulation Market by End User, 2019 - 2022, USD Million
- TABLE 174 Russia Automated Breach and Attack Simulation Market by End User, 2023 - 2029, USD Million
- TABLE 175 Russia Automated Breach and Attack Simulation Market by Application, 2019 - 2022, USD Million
- TABLE 176 Russia Automated Breach and Attack Simulation Market by Application, 2023 - 2029, USD Million
- TABLE 177 Spain Automated Breach and Attack Simulation Market, 2019 - 2022, USD Million
- TABLE 178 Spain Automated Breach and Attack Simulation Market, 2023 - 2029, USD Million
- TABLE 179 Spain Automated Breach and Attack Simulation Market by Offering, 2019 - 2022, USD Million
- TABLE 180 Spain Automated Breach and Attack Simulation Market by Offering, 2023 - 2029, USD Million
- TABLE 181 Spain Automated Breach and Attack Simulation Market by Deployment Mode, 2019 - 2022, USD Million
- TABLE 182 Spain Automated Breach and Attack Simulation Market by Deployment Mode, 2023 - 2029, USD Million
- TABLE 183 Spain Automated Breach and Attack Simulation Market by End User, 2019 - 2022, USD Million
- TABLE 184 Spain Automated Breach and Attack Simulation Market by End User, 2023 - 2029, USD Million
- TABLE 185 Spain Automated Breach and Attack Simulation Market by Application, 2019 - 2022, USD Million
- TABLE 186 Spain Automated Breach and Attack Simulation Market by Application, 2023 - 2029, USD Million
- TABLE 187 Italy Automated Breach and Attack Simulation Market, 2019 - 2022, USD Million
- TABLE 188 Italy Automated Breach and Attack Simulation Market, 2023 - 2029, USD Million
- TABLE 189 Italy Automated Breach and Attack Simulation Market by Offering, 2019 - 2022, USD Million
- TABLE 190 Italy Automated Breach and Attack Simulation Market by Offering, 2023 - 2029, USD Million
- TABLE 191 Italy Automated Breach and Attack Simulation Market by Deployment Mode, 2019 - 2022, USD Million
- TABLE 192 Italy Automated Breach and Attack Simulation Market by Deployment Mode, 2023 - 2029, USD Million
- TABLE 193 Italy Automated Breach and Attack Simulation Market by End User, 2019 - 2022, USD Million
- TABLE 194 Italy Automated Breach and Attack Simulation Market by End User, 2023 - 2029, USD Million
- TABLE 195 Italy Automated Breach and Attack Simulation Market by Application, 2019 - 2022, USD Million
- TABLE 196 Italy Automated Breach and Attack Simulation Market by Application, 2023 - 2029, USD Million
- TABLE 197 Rest of Europe Automated Breach and Attack Simulation Market, 2019 - 2022, USD Million
- TABLE 198 Rest of Europe Automated Breach and Attack Simulation Market, 2023 - 2029, USD Million
- TABLE 199 Rest of Europe Automated Breach and Attack Simulation Market by Offering, 2019 - 2022, USD Million
- TABLE 200 Rest of Europe Automated Breach and Attack Simulation Market by Offering, 2023 - 2029, USD Million
- TABLE 201 Rest of Europe Automated Breach and Attack Simulation Market by Deployment Mode, 2019 - 2022, USD Million
- TABLE 202 Rest of Europe Automated Breach and Attack Simulation Market by Deployment Mode, 2023 - 2029, USD Million
- TABLE 203 Rest of Europe Automated Breach and Attack Simulation Market by End User, 2019 - 2022, USD Million
- TABLE 204 Rest of Europe Automated Breach and Attack Simulation Market by End User, 2023 - 2029, USD Million
- TABLE 205 Rest of Europe Automated Breach and Attack Simulation Market by Application, 2019 - 2022, USD Million
- TABLE 206 Rest of Europe Automated Breach and Attack Simulation Market by Application, 2023 - 2029, USD Million
- TABLE 207 Asia Pacific Automated Breach and Attack Simulation Market, 2019 - 2022, USD Million
- TABLE 208 Asia Pacific Automated Breach and Attack Simulation Market, 2023 - 2029, USD Million
- TABLE 209 Asia Pacific Automated Breach and Attack Simulation Market by Offering, 2019 - 2022, USD Million
- TABLE 210 Asia Pacific Automated Breach and Attack Simulation Market by Offering, 2023 - 2029, USD Million
- TABLE 211 Asia Pacific Platforms & Tools Market by Country, 2019 - 2022, USD Million
- TABLE 212 Asia Pacific Platforms & Tools Market by Country, 2023 - 2029, USD Million
- TABLE 213 Asia Pacific Services Market by Country, 2019 - 2022, USD Million
- TABLE 214 Asia Pacific Services Market by Country, 2023 - 2029, USD Million
- TABLE 215 Asia Pacific Automated Breach and Attack Simulation Market by Deployment Mode, 2019 - 2022, USD Million
- TABLE 216 Asia Pacific Automated Breach and Attack Simulation Market by Deployment Mode, 2023 - 2029, USD Million
- TABLE 217 Asia Pacific On-premise Market by Country, 2019 - 2022, USD Million
- TABLE 218 Asia Pacific On-premise Market by Country, 2023 - 2029, USD Million
- TABLE 219 Asia Pacific Cloud Market by Country, 2019 - 2022, USD Million
- TABLE 220 Asia Pacific Cloud Market by Country, 2023 - 2029, USD Million
- TABLE 221 Asia Pacific Automated Breach and Attack Simulation Market by End User, 2019 - 2022, USD Million
- TABLE 222 Asia Pacific Automated Breach and Attack Simulation Market by End User, 2023 - 2029, USD Million
- TABLE 223 Asia Pacific Enterprises & Data Centers Market by Country, 2019 - 2022, USD Million
- TABLE 224 Asia Pacific Enterprises & Data Centers Market by Country, 2023 - 2029, USD Million
- TABLE 225 Asia Pacific Managed Service Providers Market by Country, 2019 - 2022, USD Million
- TABLE 226 Asia Pacific Managed Service Providers Market by Country, 2023 - 2029, USD Million
- TABLE 227 Asia Pacific Automated Breach and Attack Simulation Market by Application, 2019 - 2022, USD Million
- TABLE 228 Asia Pacific Automated Breach and Attack Simulation Market by Application, 2023 - 2029, USD Million
- TABLE 229 Asia Pacific Configuration Management Market by Country, 2019 - 2022, USD Million
- TABLE 230 Asia Pacific Configuration Management Market by Country, 2023 - 2029, USD Million
- TABLE 231 Asia Pacific Threat Management Market by Country, 2019 - 2022, USD Million
- TABLE 232 Asia Pacific Threat Management Market by Country, 2023 - 2029, USD Million
- TABLE 233 Asia Pacific Patch Management Market by Country, 2019 - 2022, USD Million
- TABLE 234 Asia Pacific Patch Management Market by Country, 2023 - 2029, USD Million
- TABLE 235 Asia Pacific Others Market by Country, 2019 - 2022, USD Million
- TABLE 236 Asia Pacific Others Market by Country, 2023 - 2029, USD Million
- TABLE 237 Asia Pacific Automated Breach and Attack Simulation Market by Country, 2019 - 2022, USD Million
- TABLE 238 Asia Pacific Automated Breach and Attack Simulation Market by Country, 2023 - 2029, USD Million
- TABLE 239 China Automated Breach and Attack Simulation Market, 2019 - 2022, USD Million
- TABLE 240 China Automated Breach and Attack Simulation Market, 2023 - 2029, USD Million
- TABLE 241 China Automated Breach and Attack Simulation Market by Offering, 2019 - 2022, USD Million
- TABLE 242 China Automated Breach and Attack Simulation Market by Offering, 2023 - 2029, USD Million
- TABLE 243 China Automated Breach and Attack Simulation Market by Deployment Mode, 2019 - 2022, USD Million
- TABLE 244 China Automated Breach and Attack Simulation Market by Deployment Mode, 2023 - 2029, USD Million
- TABLE 245 China Automated Breach and Attack Simulation Market by End User, 2019 - 2022, USD Million
- TABLE 246 China Automated Breach and Attack Simulation Market by End User, 2023 - 2029, USD Million
- TABLE 247 China Automated Breach and Attack Simulation Market by Application, 2019 - 2022, USD Million
- TABLE 248 China Automated Breach and Attack Simulation Market by Application, 2023 - 2029, USD Million
- TABLE 249 Japan Automated Breach and Attack Simulation Market, 2019 - 2022, USD Million
- TABLE 250 Japan Automated Breach and Attack Simulation Market, 2023 - 2029, USD Million
- TABLE 251 Japan Automated Breach and Attack Simulation Market by Offering, 2019 - 2022, USD Million
- TABLE 252 Japan Automated Breach and Attack Simulation Market by Offering, 2023 - 2029, USD Million
- TABLE 253 Japan Automated Breach and Attack Simulation Market by Deployment Mode, 2019 - 2022, USD Million
- TABLE 254 Japan Automated Breach and Attack Simulation Market by Deployment Mode, 2023 - 2029, USD Million
- TABLE 255 Japan Automated Breach and Attack Simulation Market by End User, 2019 - 2022, USD Million
- TABLE 256 Japan Automated Breach and Attack Simulation Market by End User, 2023 - 2029, USD Million
- TABLE 257 Japan Automated Breach and Attack Simulation Market by Application, 2019 - 2022, USD Million
- TABLE 258 Japan Automated Breach and Attack Simulation Market by Application, 2023 - 2029, USD Million
- TABLE 259 India Automated Breach and Attack Simulation Market, 2019 - 2022, USD Million
- TABLE 260 India Automated Breach and Attack Simulation Market, 2023 - 2029, USD Million
- TABLE 261 India Automated Breach and Attack Simulation Market by Offering, 2019 - 2022, USD Million
- TABLE 262 India Automated Breach and Attack Simulation Market by Offering, 2023 - 2029, USD Million
- TABLE 263 India Automated Breach and Attack Simulation Market by Deployment Mode, 2019 - 2022, USD Million
- TABLE 264 India Automated Breach and Attack Simulation Market by Deployment Mode, 2023 - 2029, USD Million
- TABLE 265 India Automated Breach and Attack Simulation Market by End User, 2019 - 2022, USD Million
- TABLE 266 India Automated Breach and Attack Simulation Market by End User, 2023 - 2029, USD Million
- TABLE 267 India Automated Breach and Attack Simulation Market by Application, 2019 - 2022, USD Million
- TABLE 268 India Automated Breach and Attack Simulation Market by Application, 2023 - 2029, USD Million
- TABLE 269 South Korea Automated Breach and Attack Simulation Market, 2019 - 2022, USD Million
- TABLE 270 South Korea Automated Breach and Attack Simulation Market, 2023 - 2029, USD Million
- TABLE 271 South Korea Automated Breach and Attack Simulation Market by Offering, 2019 - 2022, USD Million
- TABLE 272 South Korea Automated Breach and Attack Simulation Market by Offering, 2023 - 2029, USD Million
- TABLE 273 South Korea Automated Breach and Attack Simulation Market by Deployment Mode, 2019 - 2022, USD Million
- TABLE 274 South Korea Automated Breach and Attack Simulation Market by Deployment Mode, 2023 - 2029, USD Million
- TABLE 275 South Korea Automated Breach and Attack Simulation Market by End User, 2019 - 2022, USD Million
- TABLE 276 South Korea Automated Breach and Attack Simulation Market by End User, 2023 - 2029, USD Million
- TABLE 277 South Korea Automated Breach and Attack Simulation Market by Application, 2019 - 2022, USD Million
- TABLE 278 South Korea Automated Breach and Attack Simulation Market by Application, 2023 - 2029, USD Million
- TABLE 279 Singapore Automated Breach and Attack Simulation Market, 2019 - 2022, USD Million
- TABLE 280 Singapore Automated Breach and Attack Simulation Market, 2023 - 2029, USD Million
- TABLE 281 Singapore Automated Breach and Attack Simulation Market by Offering, 2019 - 2022, USD Million
- TABLE 282 Singapore Automated Breach and Attack Simulation Market by Offering, 2023 - 2029, USD Million
- TABLE 283 Singapore Automated Breach and Attack Simulation Market by Deployment Mode, 2019 - 2022, USD Million
- TABLE 284 Singapore Automated Breach and Attack Simulation Market by Deployment Mode, 2023 - 2029, USD Million
- TABLE 285 Singapore Automated Breach and Attack Simulation Market by End User, 2019 - 2022, USD Million
- TABLE 286 Singapore Automated Breach and Attack Simulation Market by End User, 2023 - 2029, USD Million
- TABLE 287 Singapore Automated Breach and Attack Simulation Market by Application, 2019 - 2022, USD Million
- TABLE 288 Singapore Automated Breach and Attack Simulation Market by Application, 2023 - 2029, USD Million
- TABLE 289 Malaysia Automated Breach and Attack Simulation Market, 2019 - 2022, USD Million
- TABLE 290 Malaysia Automated Breach and Attack Simulation Market, 2023 - 2029, USD Million
- TABLE 291 Malaysia Automated Breach and Attack Simulation Market by Offering, 2019 - 2022, USD Million
- TABLE 292 Malaysia Automated Breach and Attack Simulation Market by Offering, 2023 - 2029, USD Million
- TABLE 293 Malaysia Automated Breach and Attack Simulation Market by Deployment Mode, 2019 - 2022, USD Million
- TABLE 294 Malaysia Automated Breach and Attack Simulation Market by Deployment Mode, 2023 - 2029, USD Million
- TABLE 295 Malaysia Automated Breach and Attack Simulation Market by End User, 2019 - 2022, USD Million
- TABLE 296 Malaysia Automated Breach and Attack Simulation Market by End User, 2023 - 2029, USD Million
- TABLE 297 Malaysia Automated Breach and Attack Simulation Market by Application, 2019 - 2022, USD Million
- TABLE 298 Malaysia Automated Breach and Attack Simulation Market by Application, 2023 - 2029, USD Million
- TABLE 299 Rest of Asia Pacific Automated Breach and Attack Simulation Market, 2019 - 2022, USD Million
- TABLE 300 Rest of Asia Pacific Automated Breach and Attack Simulation Market, 2023 - 2029, USD Million
- TABLE 301 Rest of Asia Pacific Automated Breach and Attack Simulation Market by Offering, 2019 - 2022, USD Million
- TABLE 302 Rest of Asia Pacific Automated Breach and Attack Simulation Market by Offering, 2023 - 2029, USD Million
- TABLE 303 Rest of Asia Pacific Automated Breach and Attack Simulation Market by Deployment Mode, 2019 - 2022, USD Million
- TABLE 304 Rest of Asia Pacific Automated Breach and Attack Simulation Market by Deployment Mode, 2023 - 2029, USD Million
- TABLE 305 Rest of Asia Pacific Automated Breach and Attack Simulation Market by End User, 2019 - 2022, USD Million
- TABLE 306 Rest of Asia Pacific Automated Breach and Attack Simulation Market by End User, 2023 - 2029, USD Million
- TABLE 307 Rest of Asia Pacific Automated Breach and Attack Simulation Market by Application, 2019 - 2022, USD Million
- TABLE 308 Rest of Asia Pacific Automated Breach and Attack Simulation Market by Application, 2023 - 2029, USD Million
- TABLE 309 LAMEA Automated Breach and Attack Simulation Market, 2019 - 2022, USD Million
- TABLE 310 LAMEA Automated Breach and Attack Simulation Market, 2023 - 2029, USD Million
- TABLE 311 LAMEA Automated Breach and Attack Simulation Market by Offering, 2019 - 2022, USD Million
- TABLE 312 LAMEA Automated Breach and Attack Simulation Market by Offering, 2023 - 2029, USD Million
- TABLE 313 LAMEA Platforms & Tools Market by Country, 2019 - 2022, USD Million
- TABLE 314 LAMEA Platforms & Tools Market by Country, 2023 - 2029, USD Million
- TABLE 315 LAMEA Services Market by Country, 2019 - 2022, USD Million
- TABLE 316 LAMEA Services Market by Country, 2023 - 2029, USD Million
- TABLE 317 LAMEA Automated Breach and Attack Simulation Market by Deployment Mode, 2019 - 2022, USD Million
- TABLE 318 LAMEA Automated Breach and Attack Simulation Market by Deployment Mode, 2023 - 2029, USD Million
- TABLE 319 LAMEA On-premise Market by Country, 2019 - 2022, USD Million
- TABLE 320 LAMEA On-premise Market by Country, 2023 - 2029, USD Million
- TABLE 321 LAMEA Cloud Market by Country, 2019 - 2022, USD Million
- TABLE 322 LAMEA Cloud Market by Country, 2023 - 2029, USD Million
- TABLE 323 LAMEA Automated Breach and Attack Simulation Market by End User, 2019 - 2022, USD Million
- TABLE 324 LAMEA Automated Breach and Attack Simulation Market by End User, 2023 - 2029, USD Million
- TABLE 325 LAMEA Enterprises & Data Centers Market by Country, 2019 - 2022, USD Million
- TABLE 326 LAMEA Enterprises & Data Centers Market by Country, 2023 - 2029, USD Million
- TABLE 327 LAMEA Managed Service Providers Market by Country, 2019 - 2022, USD Million
- TABLE 328 LAMEA Managed Service Providers Market by Country, 2023 - 2029, USD Million
- TABLE 329 LAMEA Automated Breach and Attack Simulation Market by Application, 2019 - 2022, USD Million
- TABLE 330 LAMEA Automated Breach and Attack Simulation Market by Application, 2023 - 2029, USD Million
- TABLE 331 LAMEA Configuration Management Market by Country, 2019 - 2022, USD Million
- TABLE 332 LAMEA Configuration Management Market by Country, 2023 - 2029, USD Million
- TABLE 333 LAMEA Threat Management Market by Country, 2019 - 2022, USD Million
- TABLE 334 LAMEA Threat Management Market by Country, 2023 - 2029, USD Million
- TABLE 335 LAMEA Patch Management Market by Country, 2019 - 2022, USD Million
- TABLE 336 LAMEA Patch Management Market by Country, 2023 - 2029, USD Million
- TABLE 337 LAMEA Others Market by Country, 2019 - 2022, USD Million
- TABLE 338 LAMEA Others Market by Country, 2023 - 2029, USD Million
- TABLE 339 LAMEA Automated Breach and Attack Simulation Market by Country, 2019 - 2022, USD Million
- TABLE 340 LAMEA Automated Breach and Attack Simulation Market by Country, 2023 - 2029, USD Million
- TABLE 341 Brazil Automated Breach and Attack Simulation Market, 2019 - 2022, USD Million
- TABLE 342 Brazil Automated Breach and Attack Simulation Market, 2023 - 2029, USD Million
- TABLE 343 Brazil Automated Breach and Attack Simulation Market by Offering, 2019 - 2022, USD Million
- TABLE 344 Brazil Automated Breach and Attack Simulation Market by Offering, 2023 - 2029, USD Million
- TABLE 345 Brazil Automated Breach and Attack Simulation Market by Deployment Mode, 2019 - 2022, USD Million
- TABLE 346 Brazil Automated Breach and Attack Simulation Market by Deployment Mode, 2023 - 2029, USD Million
- TABLE 347 Brazil Automated Breach and Attack Simulation Market by End User, 2019 - 2022, USD Million
- TABLE 348 Brazil Automated Breach and Attack Simulation Market by End User, 2023 - 2029, USD Million
- TABLE 349 Brazil Automated Breach and Attack Simulation Market by Application, 2019 - 2022, USD Million
- TABLE 350 Brazil Automated Breach and Attack Simulation Market by Application, 2023 - 2029, USD Million
- TABLE 351 Argentina Automated Breach and Attack Simulation Market, 2019 - 2022, USD Million
- TABLE 352 Argentina Automated Breach and Attack Simulation Market, 2023 - 2029, USD Million
- TABLE 353 Argentina Automated Breach and Attack Simulation Market by Offering, 2019 - 2022, USD Million
- TABLE 354 Argentina Automated Breach and Attack Simulation Market by Offering, 2023 - 2029, USD Million
- TABLE 355 Argentina Automated Breach and Attack Simulation Market by Deployment Mode, 2019 - 2022, USD Million
- TABLE 356 Argentina Automated Breach and Attack Simulation Market by Deployment Mode, 2023 - 2029, USD Million
- TABLE 357 Argentina Automated Breach and Attack Simulation Market by End User, 2019 - 2022, USD Million
- TABLE 358 Argentina Automated Breach and Attack Simulation Market by End User, 2023 - 2029, USD Million
- TABLE 359 Argentina Automated Breach and Attack Simulation Market by Application, 2019 - 2022, USD Million
- TABLE 360 Argentina Automated Breach and Attack Simulation Market by Application, 2023 - 2029, USD Million
- TABLE 361 UAE Automated Breach and Attack Simulation Market, 2019 - 2022, USD Million
- TABLE 362 UAE Automated Breach and Attack Simulation Market, 2023 - 2029, USD Million
- TABLE 363 UAE Automated Breach and Attack Simulation Market by Offering, 2019 - 2022, USD Million
- TABLE 364 UAE Automated Breach and Attack Simulation Market by Offering, 2023 - 2029, USD Million
- TABLE 365 UAE Automated Breach and Attack Simulation Market by Deployment Mode, 2019 - 2022, USD Million
- TABLE 366 UAE Automated Breach and Attack Simulation Market by Deployment Mode, 2023 - 2029, USD Million
- TABLE 367 UAE Automated Breach and Attack Simulation Market by End User, 2019 - 2022, USD Million
- TABLE 368 UAE Automated Breach and Attack Simulation Market by End User, 2023 - 2029, USD Million
- TABLE 369 UAE Automated Breach and Attack Simulation Market by Application, 2019 - 2022, USD Million
- TABLE 370 UAE Automated Breach and Attack Simulation Market by Application, 2023 - 2029, USD Million
- TABLE 371 Saudi Arabia Automated Breach and Attack Simulation Market, 2019 - 2022, USD Million
- TABLE 372 Saudi Arabia Automated Breach and Attack Simulation Market, 2023 - 2029, USD Million
- TABLE 373 Saudi Arabia Automated Breach and Attack Simulation Market by Offering, 2019 - 2022, USD Million
- TABLE 374 Saudi Arabia Automated Breach and Attack Simulation Market by Offering, 2023 - 2029, USD Million
- TABLE 375 Saudi Arabia Automated Breach and Attack Simulation Market by Deployment Mode, 2019 - 2022, USD Million
- TABLE 376 Saudi Arabia Automated Breach and Attack Simulation Market by Deployment Mode, 2023 - 2029, USD Million
- TABLE 377 Saudi Arabia Automated Breach and Attack Simulation Market by End User, 2019 - 2022, USD Million
- TABLE 378 Saudi Arabia Automated Breach and Attack Simulation Market by End User, 2023 - 2029, USD Million
- TABLE 379 Saudi Arabia Automated Breach and Attack Simulation Market by Application, 2019 - 2022, USD Million
- TABLE 380 Saudi Arabia Automated Breach and Attack Simulation Market by Application, 2023 - 2029, USD Million
- TABLE 381 South Africa Automated Breach and Attack Simulation Market, 2019 - 2022, USD Million
- TABLE 382 South Africa Automated Breach and Attack Simulation Market, 2023 - 2029, USD Million
- TABLE 383 South Africa Automated Breach and Attack Simulation Market by Offering, 2019 - 2022, USD Million
- TABLE 384 South Africa Automated Breach and Attack Simulation Market by Offering, 2023 - 2029, USD Million
- TABLE 385 South Africa Automated Breach and Attack Simulation Market by Deployment Mode, 2019 - 2022, USD Million
- TABLE 386 South Africa Automated Breach and Attack Simulation Market by Deployment Mode, 2023 - 2029, USD Million
- TABLE 387 South Africa Automated Breach and Attack Simulation Market by End User, 2019 - 2022, USD Million
- TABLE 388 South Africa Automated Breach and Attack Simulation Market by End User, 2023 - 2029, USD Million
- TABLE 389 South Africa Automated Breach and Attack Simulation Market by Application, 2019 - 2022, USD Million
- TABLE 390 South Africa Automated Breach and Attack Simulation Market by Application, 2023 - 2029, USD Million
- TABLE 391 Nigeria Automated Breach and Attack Simulation Market, 2019 - 2022, USD Million
- TABLE 392 Nigeria Automated Breach and Attack Simulation Market, 2023 - 2029, USD Million
- TABLE 393 Nigeria Automated Breach and Attack Simulation Market by Offering, 2019 - 2022, USD Million
- TABLE 394 Nigeria Automated Breach and Attack Simulation Market by Offering, 2023 - 2029, USD Million
- TABLE 395 Nigeria Automated Breach and Attack Simulation Market by Deployment Mode, 2019 - 2022, USD Million
- TABLE 396 Nigeria Automated Breach and Attack Simulation Market by Deployment Mode, 2023 - 2029, USD Million
- TABLE 397 Nigeria Automated Breach and Attack Simulation Market by End User, 2019 - 2022, USD Million
- TABLE 398 Nigeria Automated Breach and Attack Simulation Market by End User, 2023 - 2029, USD Million
- TABLE 399 Nigeria Automated Breach and Attack Simulation Market by Application, 2019 - 2022, USD Million
- TABLE 400 Nigeria Automated Breach and Attack Simulation Market by Application, 2023 - 2029, USD Million
- TABLE 401 Rest of LAMEA Automated Breach and Attack Simulation Market, 2019 - 2022, USD Million
- TABLE 402 Rest of LAMEA Automated Breach and Attack Simulation Market, 2023 - 2029, USD Million
- TABLE 403 Rest of LAMEA Automated Breach and Attack Simulation Market by Offering, 2019 - 2022, USD Million
- TABLE 404 Rest of LAMEA Automated Breach and Attack Simulation Market by Offering, 2023 - 2029, USD Million
- TABLE 405 Rest of LAMEA Automated Breach and Attack Simulation Market by Deployment Mode, 2019 - 2022, USD Million
- TABLE 406 Rest of LAMEA Automated Breach and Attack Simulation Market by Deployment Mode, 2023 - 2029, USD Million
- TABLE 407 Rest of LAMEA Automated Breach and Attack Simulation Market by End User, 2019 - 2022, USD Million
- TABLE 408 Rest of LAMEA Automated Breach and Attack Simulation Market by End User, 2023 - 2029, USD Million
- TABLE 409 Rest of LAMEA Automated Breach and Attack Simulation Market by Application, 2019 - 2022, USD Million
- TABLE 410 Rest of LAMEA Automated Breach and Attack Simulation Market by Application, 2023 - 2029, USD Million
- TABLE 411 Key Information - QUALYS, INC.
- TABLE 412 Key Information - Rapid7, Inc.
- TABLE 413 Key Information - Sophos Group PLC
- TABLE 414 Key Information - Keysight Technologies, Inc.
- TABLE 415 Key Information - Skybox Security, Inc.
- TABLE 416 Key Information - NopSec.com, inc.
- TABLE 417 Key Information - ReliaQuest, LLC
- TABLE 418 Key Information - SCYTHE Inc.
- TABLE 419 Key Information - CyCognito Ltd.
- TABLE 420 Key Information - FireEye, Inc.
List of Figures
- FIG 1 Methodology for the research
- FIG 2 Global Automated Breach and Attack Simulation Market share by Offering, 2022
- FIG 3 Global Automated Breach and Attack Simulation Market share by Offering, 2029
- FIG 4 Global Automated Breach and Attack Simulation Market by Offering, 2019 - 2029, USD Million
- FIG 5 Global Automated Breach and Attack Simulation Market share by Deployment Mode, 2022
- FIG 6 Global Automated Breach and Attack Simulation Market share by Deployment Mode, 2029
- FIG 7 Global Automated Breach and Attack Simulation Market by Deployment Mode, 2019 - 2029, USD Million
- FIG 8 Global Automated Breach and Attack Simulation Market share by End User, 2022
- FIG 9 Global Automated Breach and Attack Simulation Market share by End User, 2029
- FIG 10 Global Automated Breach and Attack Simulation Market by End User, 2019 - 2029, USD Million
- FIG 11 Global Automated Breach and Attack Simulation Market share by Application, 2022
- FIG 12 Global Automated Breach and Attack Simulation Market share by Application, 2029
- FIG 13 Global Automated Breach and Attack Simulation Market by Application, 2019 - 2029, USD Million
- FIG 14 Global Automated Breach and Attack Simulation Market share by Region, 2022
- FIG 15 Global Automated Breach and Attack Simulation Market share by Region, 2029
- FIG 16 Global Automated Breach and Attack Simulation Market by Region, 2019 - 2029, USD Million
- FIG 17 Recent strategies and developments: Sophos Group PLC
- FIG 18 Recent strategies and developments: Keysight Technologies, Inc.
- FIG 19 Recent strategies and developments: ReliaQuest, LLC
The Global Automated Breach and Attack Simulation Market size is expected to reach $2.5 billion by 2029, rising at a market growth of 31.4% CAGR during the forecast period.
Platforms or systems that automate security assessment by simulating actual attack scenarios are known as automated breach and attack simulation solutions. End users can increase data protection by using these technologies to find security flaws in the current security framework. In addition, ABAS is a computerized method that mimics actual cyberattacks and aids organizations in understanding their security posture & locating potential holes.
The automated breach and attack simulation market is expanding due to the rising complexity of managing security risks and the spike in need for prioritizing security investments. Also, the market for automated breach and assault simulation is expanding favorably as the number of cyberattacks increases globally. On the other hand, it's anticipated that the rise in digitalization initiatives will present lucrative chances for the growth of the automated breach and attack simulation market during the forecast period.
Due to escalating security investments and concerns over compliance with security requirements, the market for automated breach & attack simulation is anticipated to expand globally. By modeling actual attack situations, the automated breach and attack simulation solutions are the platforms or technologies that make it possible to automate security assessment. These solutions enhance data security by assisting users in finding flaws in the current security system.
The volume of industrial data is growing, and there is a growing need for analytics tools and solutions to strengthen organizational security and improve facility operations. These are the main drivers of market growth. The automated breach and simulation solutions can be used to launch automated attacks, frequently utilized to launch unexpected or planned simulated attacks. To launch complex assaults and evaluate the condition of an organization's cybersecurity infrastructure, they have artificial intelligence (AI) and machine learning (ML) capabilities.
COVID-19 Impact Analysis
The COVID-19 outbreak positively affected the expansion of the automated breach and attack simulation market because of these factors: a rise in the popularity of digital solutions; a rise in the threat of cyberattacks from unethical hackers' trend. Small and medium businesses were encouraged to adopt effective ABAS solutions during the COVID-19 pandemic, which drove the growth of the automated breach and attack simulation (ABAS) market. This has helped to bridge the gap between current security architecture and cyber-attacks that use advanced methods to penetrate organizational resources.
Market Growth Factors
Growing incidence of data breaches rising need for ABAS solutions
Numerous layers of preventive measures should ideally be included in any sound network architecture. The network architecture must have preventive and investigative controls in addition to the former. The majority of cyberattacks cannot be prevented. Despite the firewall's ability to block specific types of traffic from entering the network, preventive techniques may fail to identify and stop such attacks. When harmful or illegal traffic enters the system while evading security measures, the logs may not show that it did so. To detect an impending attack, these harmful entries are not examined. As a result, to recognize and stop such assaults, solid network architecture and automated breach and attack simulation solutions are required.
Growing complexities in managing security threats
Continuous and rapid increases in the digitization of business could be observed globally, increasing the number of application-based solutions. However, no such solutions have resolved all application-related security issues. The simulated platform is effective in resolving the issues and aiding in the system's vulnerability investigation. In addition, once a vulnerability has been identified, developers can readily protect the enterprise system from the identified vulnerabilities. Due to this growing complexity in managing security threats, the need for automated breach and attack simulation solutions arises, leading to market expansion.
Market Restraining Factors
Dearth of skilled professionals
A pricey service is penetration testing. Both service providers & client firms may suffer financial losses if penetration testing is not done correctly. Several employers say there is a scarcity of cybersecurity professionals, and they think this shortfall directly impacts their businesses. This highlights the necessity for proper and better security professional training, which will close the skill gap and produce the necessary competence for locating and assessing cyberattacks. The lack of security professionals could slow the market's expansion.
Offering Outlook
Based on offering, the automated breach and attack simulation market is segmented into platforms & tools, and services. The platforms & tools segment held the highest revenue share in the automated breach and attack simulation market in 2022. This is because cybersecurity providers provide automated breach and attack simulation solutions as a platform. The end-users are encouraged to choose these solutions since they mimic attacks along the entire kill chain and remove any additional danger during continuous upgrades and maintenance.
Deployment Mode Outlook
On the basis of deployment mode, the automated breach and attack simulation market is fragmented into on-premises, and cloud. In 2022, the cloud segment garnered a significant revenue share in the automated break-and-attack simulation market. Organizations are using cloud-based ABAS solutions to reduce costs and increase business agility. Due to its affordability and simplicity, SMEs favor cloud-based implementation. Small businesses can examine vulnerabilities and lessen the threat environment at a far lower cost with the help of the cloud-based deployment of these solutions, boosting their ability to serve customers.
Application Outlook
By application, the automated breach and attack simulation market is divided into configuration management, patch management, threat management and others. The threat management acquired a substantial revenue share in the automated breach and attack simulation market in 2022. Threat intelligence systems gather and analyze data from many sources about the current and emerging threat vectors to produce actionable threat management feeds & reports that different security control solutions can efficiently use. These solutions assist organizations in protecting themselves against the potential occurrences of data breaches by informing them of the hazards of Advanced Persistent Threats (APTs), zero-day assaults, and other similar concerns.
End User Outlook
Based on end user, the automated breach and attack simulation market is bifurcated into enterprises & data centers, and managed service providers. In 2022, the enterprise & data centers segment registered the maximum revenue share in the automated breach and attack simulation market. There is still a significant gap in the effectiveness of proactively mitigating new attack vectors despite increasing cybersecurity spending from various end users, and most incidents go unreported or are only partially reported. To combat today's sophisticated cyberattacks, businesses are considering implementing a proactive strategy for breach mitigation.
Regional Outlook
Region wise, the automated breach and attack simulation market is analyzed across North America, Europe, Asia Pacific and LAMEA. In 2022, the North America region led the automated breach and attack simulation market by generating maximum revenue share. This is due to the fact that it is a technologically advanced region with a significant early adopter population and the presence of key market participants. The expansion of government programs, like smart cities, smart infrastructure, etc., as well as advances surrounding the incorporation of AI and ML in ABASs as well as rising demand for cloud-based ABAS are predicted to fuel the demand for ABAS.
The market research report covers the analysis of key stake holders of the market. Key companies profiled in the report include Qualys, Inc., Rapid7, Inc. (IntSights), Sophos Group PLC (Thoma Bravo), Keysight Technologies, Inc., Skybox Security, Inc., NopSec.com, Inc., ReliaQuest, LLC, SCYTHE Inc., CyCognito Ltd. And FireEye, Inc.
Strategies deployed in Automated Breach and Attack Simulation Market
Mar-2023: Sophos came into partnership with Cowbell, a provider of cyber risk insurance. Following the partnership, the company would provide small and medium enterprises with streamlined access to cyber insurance coverage and facilitate optimal insurance provision for its customers in the U.S. with opt-in sharing of endpoint health security data.
Jan-2023: Sophos introduced Sophos Network Detection and Response (NDR) which recognizes rogue assets, insider threats, unprotected devices, and novel attacks for accelerating threat detection and response. Using a combination of machine learning, advanced analytics, and rule-based matching approaches, Sophos NDR continuously monitors network traffic to detect suspicious activities that may be suggestive of attacker activity.
Jun-2022: ReliaQuest announced an agreement to acquire Digital Shadows, a threat intelligence startup. An end-to-end picture is created for businesses worldwide by combining the internal visibility offered by ReliaQuest with the external threat intelligence and digital risk monitoring offered by Digital Shadows. This is an exceptional opportunity for its clients and partners because of the complementing technical capabilities, shared cultural values, and geographic synergies.
Mar-2022: Keysight Technologies announced a partnership with SCADAfence for creating a new concept called 'Virtual BAS Agents'. Because of this, security teams may simulate assaults on the IT-OT boundary in a secure and non-intrusive manner.
Mar-2022: Keysight Technologies launched Breach Defense, a security operations (SecOps) platform created for improving operational security effectiveness. The new platform Threat Simulator breach and attack simulation solution allows network and security operations teams to securely model the most recent assaults and exploits on live networks to assess the effectiveness of operational security. Keysight's Threat Simulator offers both practical assistance for patching vulnerabilities and real-time threat intelligence.
Jan-2022: ReliaQuest opened a new office in Pune, Maharashtra. The expansion would provide the company with quality technical talent for continuously creating and providing an OpenXDR platform, which would help the security operators in becoming more efficient and proactive with their security posture.
Sep-2020: ReliaQuest signed a partnership with Tampa Bay Buccaneers that comprises its designation as the team's Official Cybersecurity Partner. Through this partnership, ReliaQuest's GreyMatter platform will be able to help the Buccaneers defend against security breaches by giving them unmatched visibility into potential threats and the on-demand automation capabilities to proactively respond and continuously validate the team's security over time.
Jun-2019: ReliaQuest announced the launch of GreyMatter, a first-of-its-kind, integrated platform that integrates disparate processes, technologies, and teams for delivering greater control and visibility of enterprise security operations. GreyMatter proactively identifies and addresses cybersecurity threats across an organization using a combination of machine learning and human analysis so that security teams can mobilize more quickly and efficiently.
Scope of the Study
Market Segments covered in the Report:
By Offering
- Platforms & Tools
- Services
By Deployment Mode
- On-premise
- Cloud
By End User
- Enterprises & Data Centers
- Managed Service Providers
By Application
- Configuration Management
- Threat Management
- Patch Management
- Others
By Geography
- North America
- US
- Canada
- Mexico
- Rest of North America
- Europe
- Germany
- UK
- France
- Russia
- Spain
- Italy
- Rest of Europe
- Asia Pacific
- China
- Japan
- India
- South Korea
- Singapore
- Malaysia
- Rest of Asia Pacific
- LAMEA
- Brazil
- Argentina
- UAE
- Saudi Arabia
- South Africa
- Nigeria
- Rest of LAMEA
Companies Profiled
- Qualys, Inc.
- Rapid7, Inc. (IntSights)
- Sophos Group PLC (Thoma Bravo)
- Keysight Technologies, Inc.
- Skybox Security, Inc.
- NopSec.com, Inc.
- ReliaQuest, LLC
- SCYTHE Inc.
- CyCognito Ltd.
- FireEye, Inc.
Unique Offerings from KBV Research
- Exhaustive coverage
- Highest number of market tables and figures
- Subscription based model available
- Guaranteed best price
- Assured post sales research support with 10% customization free
Table of Contents
Chapter 1. Market Scope & Methodology
- 1.1 Market Definition
- 1.2 Objectives
- 1.3 Market Scope
- 1.4 Segmentation
- 1.4.1 Global Automated Breach and Attack Simulation Market, by Offering
- 1.4.2 Global Automated Breach and Attack Simulation Market, by Deployment Mode
- 1.4.3 Global Automated Breach and Attack Simulation Market, by End User
- 1.4.4 Global Automated Breach and Attack Simulation Market, by Application
- 1.4.5 Global Automated Breach and Attack Simulation Market, by Geography
- 1.5 Methodology for the research
Chapter 2. Market Overview
- 2.1 Introduction
- 2.1.1 Overview
- 2.1.1.1 Market Composition & Scenario
- 2.1.1 Overview
- 2.2 Key Factors Impacting the Market
- 2.2.1 Market Drivers
- 2.2.2 Market Restraints
Chapter 3. Strategies deployed in Automated Breach and Attack Simulation Market
Chapter 4. Global Automated Breach and Attack Simulation Market by Offering
- 4.1 Global Platforms & Tools Market by Region
- 4.2 Global Services Market by Region
Chapter 5. Global Automated Breach and Attack Simulation Market by Deployment Mode
- 5.1 Global On-premise Market by Region
- 5.2 Global Cloud Market by Region
Chapter 6. Global Automated Breach and Attack Simulation Market by End User
- 6.1 Global Enterprises & Data Centers Market by Region
- 6.2 Global Managed Service Providers Market by Region
Chapter 7. Global Automated Breach and Attack Simulation Market by Application
- 7.1 Global Configuration Management Market by Region
- 7.2 Global Threat Management Market by Region
- 7.3 Global Patch Management Market by Region
- 7.4 Global Others Market by Region
Chapter 8. Global Automated Breach and Attack Simulation Market by Region
- 8.1 North America Automated Breach and Attack Simulation Market
- 8.1.1 North America Automated Breach and Attack Simulation Market by Offering
- 8.1.1.1 North America Platforms & Tools Market by Country
- 8.1.1.2 North America Services Market by Country
- 8.1.2 North America Automated Breach and Attack Simulation Market by Deployment Mode
- 8.1.2.1 North America On-premise Market by Country
- 8.1.2.2 North America Cloud Market by Country
- 8.1.3 North America Automated Breach and Attack Simulation Market by End User
- 8.1.3.1 North America Enterprises & Data Centers Market by Country
- 8.1.3.2 North America Managed Service Providers Market by Country
- 8.1.4 North America Automated Breach and Attack Simulation Market by Application
- 8.1.4.1 North America Configuration Management Market by Country
- 8.1.4.2 North America Threat Management Market by Country
- 8.1.4.3 North America Patch Management Market by Country
- 8.1.4.4 North America Others Market by Country
- 8.1.5 North America Automated Breach and Attack Simulation Market by Country
- 8.1.5.1 US Automated Breach and Attack Simulation Market
- 8.1.5.1.1 US Automated Breach and Attack Simulation Market by Offering
- 8.1.5.1.2 US Automated Breach and Attack Simulation Market by Deployment Mode
- 8.1.5.1.3 US Automated Breach and Attack Simulation Market by End User
- 8.1.5.1.4 US Automated Breach and Attack Simulation Market by Application
- 8.1.5.2 Canada Automated Breach and Attack Simulation Market
- 8.1.5.2.1 Canada Automated Breach and Attack Simulation Market by Offering
- 8.1.5.2.2 Canada Automated Breach and Attack Simulation Market by Deployment Mode
- 8.1.5.2.3 Canada Automated Breach and Attack Simulation Market by End User
- 8.1.5.2.4 Canada Automated Breach and Attack Simulation Market by Application
- 8.1.5.3 Mexico Automated Breach and Attack Simulation Market
- 8.1.5.3.1 Mexico Automated Breach and Attack Simulation Market by Offering
- 8.1.5.3.2 Mexico Automated Breach and Attack Simulation Market by Deployment Mode
- 8.1.5.3.3 Mexico Automated Breach and Attack Simulation Market by End User
- 8.1.5.3.4 Mexico Automated Breach and Attack Simulation Market by Application
- 8.1.5.4 Rest of North America Automated Breach and Attack Simulation Market
- 8.1.5.4.1 Rest of North America Automated Breach and Attack Simulation Market by Offering
- 8.1.5.4.2 Rest of North America Automated Breach and Attack Simulation Market by Deployment Mode
- 8.1.5.4.3 Rest of North America Automated Breach and Attack Simulation Market by End User
- 8.1.5.4.4 Rest of North America Automated Breach and Attack Simulation Market by Application
- 8.1.5.1 US Automated Breach and Attack Simulation Market
- 8.1.1 North America Automated Breach and Attack Simulation Market by Offering
- 8.2 Europe Automated Breach and Attack Simulation Market
- 8.2.1 Europe Automated Breach and Attack Simulation Market by Offering
- 8.2.1.1 Europe Platforms & Tools Market by Country
- 8.2.1.2 Europe Services Market by Country
- 8.2.2 Europe Automated Breach and Attack Simulation Market by Deployment Mode
- 8.2.2.1 Europe On-premise Market by Country
- 8.2.2.2 Europe Cloud Market by Country
- 8.2.3 Europe Automated Breach and Attack Simulation Market by End User
- 8.2.3.1 Europe Enterprises & Data Centers Market by Country
- 8.2.3.2 Europe Managed Service Providers Market by Country
- 8.2.4 Europe Automated Breach and Attack Simulation Market by Application
- 8.2.4.1 Europe Configuration Management Market by Country
- 8.2.4.2 Europe Threat Management Market by Country
- 8.2.4.3 Europe Patch Management Market by Country
- 8.2.4.4 Europe Others Market by Country
- 8.2.5 Europe Automated Breach and Attack Simulation Market by Country
- 8.2.5.1 Germany Automated Breach and Attack Simulation Market
- 8.2.5.1.1 Germany Automated Breach and Attack Simulation Market by Offering
- 8.2.5.1.2 Germany Automated Breach and Attack Simulation Market by Deployment Mode
- 8.2.5.1.3 Germany Automated Breach and Attack Simulation Market by End User
- 8.2.5.1.4 Germany Automated Breach and Attack Simulation Market by Application
- 8.2.5.2 UK Automated Breach and Attack Simulation Market
- 8.2.5.2.1 UK Automated Breach and Attack Simulation Market by Offering
- 8.2.5.2.2 UK Automated Breach and Attack Simulation Market by Deployment Mode
- 8.2.5.2.3 UK Automated Breach and Attack Simulation Market by End User
- 8.2.5.2.4 UK Automated Breach and Attack Simulation Market by Application
- 8.2.5.3 France Automated Breach and Attack Simulation Market
- 8.2.5.3.1 France Automated Breach and Attack Simulation Market by Offering
- 8.2.5.3.2 France Automated Breach and Attack Simulation Market by Deployment Mode
- 8.2.5.3.3 France Automated Breach and Attack Simulation Market by End User
- 8.2.5.3.4 France Automated Breach and Attack Simulation Market by Application
- 8.2.5.4 Russia Automated Breach and Attack Simulation Market
- 8.2.5.4.1 Russia Automated Breach and Attack Simulation Market by Offering
- 8.2.5.4.2 Russia Automated Breach and Attack Simulation Market by Deployment Mode
- 8.2.5.4.3 Russia Automated Breach and Attack Simulation Market by End User
- 8.2.5.4.4 Russia Automated Breach and Attack Simulation Market by Application
- 8.2.5.5 Spain Automated Breach and Attack Simulation Market
- 8.2.5.5.1 Spain Automated Breach and Attack Simulation Market by Offering
- 8.2.5.5.2 Spain Automated Breach and Attack Simulation Market by Deployment Mode
- 8.2.5.5.3 Spain Automated Breach and Attack Simulation Market by End User
- 8.2.5.5.4 Spain Automated Breach and Attack Simulation Market by Application
- 8.2.5.6 Italy Automated Breach and Attack Simulation Market
- 8.2.5.6.1 Italy Automated Breach and Attack Simulation Market by Offering
- 8.2.5.6.2 Italy Automated Breach and Attack Simulation Market by Deployment Mode
- 8.2.5.6.3 Italy Automated Breach and Attack Simulation Market by End User
- 8.2.5.6.4 Italy Automated Breach and Attack Simulation Market by Application
- 8.2.5.7 Rest of Europe Automated Breach and Attack Simulation Market
- 8.2.5.7.1 Rest of Europe Automated Breach and Attack Simulation Market by Offering
- 8.2.5.7.2 Rest of Europe Automated Breach and Attack Simulation Market by Deployment Mode
- 8.2.5.7.3 Rest of Europe Automated Breach and Attack Simulation Market by End User
- 8.2.5.7.4 Rest of Europe Automated Breach and Attack Simulation Market by Application
- 8.2.5.1 Germany Automated Breach and Attack Simulation Market
- 8.2.1 Europe Automated Breach and Attack Simulation Market by Offering
- 8.3 Asia Pacific Automated Breach and Attack Simulation Market
- 8.3.1 Asia Pacific Automated Breach and Attack Simulation Market by Offering
- 8.3.1.1 Asia Pacific Platforms & Tools Market by Country
- 8.3.1.2 Asia Pacific Services Market by Country
- 8.3.2 Asia Pacific Automated Breach and Attack Simulation Market by Deployment Mode
- 8.3.2.1 Asia Pacific On-premise Market by Country
- 8.3.2.2 Asia Pacific Cloud Market by Country
- 8.3.3 Asia Pacific Automated Breach and Attack Simulation Market by End User
- 8.3.3.1 Asia Pacific Enterprises & Data Centers Market by Country
- 8.3.3.2 Asia Pacific Managed Service Providers Market by Country
- 8.3.4 Asia Pacific Automated Breach and Attack Simulation Market by Application
- 8.3.4.1 Asia Pacific Configuration Management Market by Country
- 8.3.4.2 Asia Pacific Threat Management Market by Country
- 8.3.4.3 Asia Pacific Patch Management Market by Country
- 8.3.4.4 Asia Pacific Others Market by Country
- 8.3.5 Asia Pacific Automated Breach and Attack Simulation Market by Country
- 8.3.5.1 China Automated Breach and Attack Simulation Market
- 8.3.5.1.1 China Automated Breach and Attack Simulation Market by Offering
- 8.3.5.1.2 China Automated Breach and Attack Simulation Market by Deployment Mode
- 8.3.5.1.3 China Automated Breach and Attack Simulation Market by End User
- 8.3.5.1.4 China Automated Breach and Attack Simulation Market by Application
- 8.3.5.2 Japan Automated Breach and Attack Simulation Market
- 8.3.5.2.1 Japan Automated Breach and Attack Simulation Market by Offering
- 8.3.5.2.2 Japan Automated Breach and Attack Simulation Market by Deployment Mode
- 8.3.5.2.3 Japan Automated Breach and Attack Simulation Market by End User
- 8.3.5.2.4 Japan Automated Breach and Attack Simulation Market by Application
- 8.3.5.3 India Automated Breach and Attack Simulation Market
- 8.3.5.3.1 India Automated Breach and Attack Simulation Market by Offering
- 8.3.5.3.2 India Automated Breach and Attack Simulation Market by Deployment Mode
- 8.3.5.3.3 India Automated Breach and Attack Simulation Market by End User
- 8.3.5.3.4 India Automated Breach and Attack Simulation Market by Application
- 8.3.5.4 South Korea Automated Breach and Attack Simulation Market
- 8.3.5.4.1 South Korea Automated Breach and Attack Simulation Market by Offering
- 8.3.5.4.2 South Korea Automated Breach and Attack Simulation Market by Deployment Mode
- 8.3.5.4.3 South Korea Automated Breach and Attack Simulation Market by End User
- 8.3.5.4.4 South Korea Automated Breach and Attack Simulation Market by Application
- 8.3.5.5 Singapore Automated Breach and Attack Simulation Market
- 8.3.5.5.1 Singapore Automated Breach and Attack Simulation Market by Offering
- 8.3.5.5.2 Singapore Automated Breach and Attack Simulation Market by Deployment Mode
- 8.3.5.5.3 Singapore Automated Breach and Attack Simulation Market by End User
- 8.3.5.5.4 Singapore Automated Breach and Attack Simulation Market by Application
- 8.3.5.6 Malaysia Automated Breach and Attack Simulation Market
- 8.3.5.6.1 Malaysia Automated Breach and Attack Simulation Market by Offering
- 8.3.5.6.2 Malaysia Automated Breach and Attack Simulation Market by Deployment Mode
- 8.3.5.6.3 Malaysia Automated Breach and Attack Simulation Market by End User
- 8.3.5.6.4 Malaysia Automated Breach and Attack Simulation Market by Application
- 8.3.5.7 Rest of Asia Pacific Automated Breach and Attack Simulation Market
- 8.3.5.7.1 Rest of Asia Pacific Automated Breach and Attack Simulation Market by Offering
- 8.3.5.7.2 Rest of Asia Pacific Automated Breach and Attack Simulation Market by Deployment Mode
- 8.3.5.7.3 Rest of Asia Pacific Automated Breach and Attack Simulation Market by End User
- 8.3.5.7.4 Rest of Asia Pacific Automated Breach and Attack Simulation Market by Application
- 8.3.5.1 China Automated Breach and Attack Simulation Market
- 8.3.1 Asia Pacific Automated Breach and Attack Simulation Market by Offering
- 8.4 LAMEA Automated Breach and Attack Simulation Market
- 8.4.1 LAMEA Automated Breach and Attack Simulation Market by Offering
- 8.4.1.1 LAMEA Platforms & Tools Market by Country
- 8.4.1.2 LAMEA Services Market by Country
- 8.4.2 LAMEA Automated Breach and Attack Simulation Market by Deployment Mode
- 8.4.2.1 LAMEA On-premise Market by Country
- 8.4.2.2 LAMEA Cloud Market by Country
- 8.4.3 LAMEA Automated Breach and Attack Simulation Market by End User
- 8.4.3.1 LAMEA Enterprises & Data Centers Market by Country
- 8.4.3.2 LAMEA Managed Service Providers Market by Country
- 8.4.4 LAMEA Automated Breach and Attack Simulation Market by Application
- 8.4.4.1 LAMEA Configuration Management Market by Country
- 8.4.4.2 LAMEA Threat Management Market by Country
- 8.4.4.3 LAMEA Patch Management Market by Country
- 8.4.4.4 LAMEA Others Market by Country
- 8.4.5 LAMEA Automated Breach and Attack Simulation Market by Country
- 8.4.5.1 Brazil Automated Breach and Attack Simulation Market
- 8.4.5.1.1 Brazil Automated Breach and Attack Simulation Market by Offering
- 8.4.5.1.2 Brazil Automated Breach and Attack Simulation Market by Deployment Mode
- 8.4.5.1.3 Brazil Automated Breach and Attack Simulation Market by End User
- 8.4.5.1.4 Brazil Automated Breach and Attack Simulation Market by Application
- 8.4.5.2 Argentina Automated Breach and Attack Simulation Market
- 8.4.5.2.1 Argentina Automated Breach and Attack Simulation Market by Offering
- 8.4.5.2.2 Argentina Automated Breach and Attack Simulation Market by Deployment Mode
- 8.4.5.2.3 Argentina Automated Breach and Attack Simulation Market by End User
- 8.4.5.2.4 Argentina Automated Breach and Attack Simulation Market by Application
- 8.4.5.3 UAE Automated Breach and Attack Simulation Market
- 8.4.5.3.1 UAE Automated Breach and Attack Simulation Market by Offering
- 8.4.5.3.2 UAE Automated Breach and Attack Simulation Market by Deployment Mode
- 8.4.5.3.3 UAE Automated Breach and Attack Simulation Market by End User
- 8.4.5.3.4 UAE Automated Breach and Attack Simulation Market by Application
- 8.4.5.4 Saudi Arabia Automated Breach and Attack Simulation Market
- 8.4.5.4.1 Saudi Arabia Automated Breach and Attack Simulation Market by Offering
- 8.4.5.4.2 Saudi Arabia Automated Breach and Attack Simulation Market by Deployment Mode
- 8.4.5.4.3 Saudi Arabia Automated Breach and Attack Simulation Market by End User
- 8.4.5.4.4 Saudi Arabia Automated Breach and Attack Simulation Market by Application
- 8.4.5.5 South Africa Automated Breach and Attack Simulation Market
- 8.4.5.5.1 South Africa Automated Breach and Attack Simulation Market by Offering
- 8.4.5.5.2 South Africa Automated Breach and Attack Simulation Market by Deployment Mode
- 8.4.5.5.3 South Africa Automated Breach and Attack Simulation Market by End User
- 8.4.5.5.4 South Africa Automated Breach and Attack Simulation Market by Application
- 8.4.5.6 Nigeria Automated Breach and Attack Simulation Market
- 8.4.5.6.1 Nigeria Automated Breach and Attack Simulation Market by Offering
- 8.4.5.6.2 Nigeria Automated Breach and Attack Simulation Market by Deployment Mode
- 8.4.5.6.3 Nigeria Automated Breach and Attack Simulation Market by End User
- 8.4.5.6.4 Nigeria Automated Breach and Attack Simulation Market by Application
- 8.4.5.7 Rest of LAMEA Automated Breach and Attack Simulation Market
- 8.4.5.7.1 Rest of LAMEA Automated Breach and Attack Simulation Market by Offering
- 8.4.5.7.2 Rest of LAMEA Automated Breach and Attack Simulation Market by Deployment Mode
- 8.4.5.7.3 Rest of LAMEA Automated Breach and Attack Simulation Market by End User
- 8.4.5.7.4 Rest of LAMEA Automated Breach and Attack Simulation Market by Application
- 8.4.5.1 Brazil Automated Breach and Attack Simulation Market
- 8.4.1 LAMEA Automated Breach and Attack Simulation Market by Offering
Chapter 9. Company Profiles
- 9.1 Qualys, Inc.
- 9.1.1 Company Overview
- 9.1.2 Financial Analysis
- 9.1.3 Regional Analysis
- 9.1.4 Research & Development Expenses
- 9.2 Rapid7, Inc. (IntSights)
- 9.2.1 Company Overview
- 9.2.2 Financial Analysis
- 9.2.3 Regional Analysis
- 9.2.4 Research & Development Expenses
- 9.3 Sophos Group PLC (Thoma Bravo)
- 9.3.1 Company Overview
- 9.3.2 Recent strategies and developments:
- 9.3.2.1 Partnerships, Collaborations, and Agreements:
- 9.3.2.2 Product Launches and Product Expansions:
- 9.4 Keysight Technologies, Inc.
- 9.4.1 Company Overview
- 9.4.2 Financial Analysis
- 9.4.3 Segmental and Regional Analysis
- 9.4.4 Research & Development Expenses
- 9.4.5 Recent strategies and developments:
- 9.4.5.1 Partnerships, Collaborations, and Agreements:
- 9.4.5.2 Product Launches and Product Expansions:
- 9.5 Skybox Security, Inc.
- 9.5.1 Company Overview
- 9.6 NopSec.com, Inc.
- 9.6.1 Company Overview
- 9.7 ReliaQuest, LLC
- 9.7.1 Company Overview
- 9.7.2 Recent strategies and developments:
- 9.7.2.1 Partnerships, Collaborations, and Agreements:
- 9.7.2.2 Product Launches and Product Expansions:
- 9.7.2.3 Acquisition and Mergers:
- 9.7.2.4 Geographical Expansions:
- 9.8 SCYTHE Inc.
- 9.8.1 Company Overview
- 9.9 CyCognito Ltd.
- 9.9.1 Company Overview
- 9.10. FireEye, Inc.
- 9.10.1 Company Overview