|
|
市場調査レポート
商品コード
1219664
ナローバンドIoTの世界市場の規模、シェア、産業動向分析レポート:コンポーネント別、アプリケーション別、展開モード別、業種別、地域別展望・予測、2022年~2028年Global Narrowband Internet of Things Market Size, Share & Industry Trends Analysis Report By Component, By Application, By Deployment Mode, By Vertical, By Regional Outlook and Forecast, 2022 - 2028 |
||||||
|
|
|||||||


| ナローバンドIoTの世界市場の規模、シェア、産業動向分析レポート:コンポーネント別、アプリケーション別、展開モード別、業種別、地域別展望・予測、2022年~2028年 |
|
出版日: 2023年01月31日
発行: KBV Research
ページ情報: 英文 323 Pages
納期: 即納可能
|
- 全表示
- 概要
- 図表
- 目次
世界のナローバンドIoT市場規模は、2028年までに96億米ドルに達し、予測期間中にCAGR51.5%の市場成長率で上昇すると予測されています。
ナローバンドIoTの適用は、価格節約、電力効力、より広い準備、信頼性などの様々な利点につながります。ナローバンドIoTは、IoTデバイスの費用対効果の高い電力供給を可能にします。NB-IoTなどの技術は複雑な波形が少ないため、消費電力が少なくなる傾向にあります。NB-IoTのチップは、作るのが複雑でないため、安価になります。また、ナローバンドIoTアプリケーションは、制御されたサービス品質に必要なリソースの割り当てが結合されているため、通信事業者の信頼性強化につながります。
NB-IoTは、ナローバンドIoTの利用を直接つなぐように設定されており、世界中で都市化が進む中、さらに広範に強化されると認識されるかもしれません。NB-IoTデバイスは、委託されたスペクトル内で採用され、消費者に信頼性の高い安全なプロパティを確保します。
COVID-19インパクト分析
COVID-19の流行により、大手企業は自動化技術の利用に向けて進化しており、特にモニタリングやドラッグデリバリーのためのドローンの領域で進化しています。ロボットや自動化は、パンデミックによって生じた状況において、人的労働の必要性を減らし、将来の工場閉鎖の可能性を減少させることで、生産性を高めることができます。IoT、AI、デジタル化も今後ますます重要性を増し、新しい働き方を定義することになるでしょう。これらすべての要因によって、ナローバンド・インターネット・オブ・シングス市場は新型コロナウイルスの蔓延から大きな恩恵を受けており、パンデミック期以降も成長の見込みを示すことになるでしょう。
市場の成長要因
IoT技術の採用が進み、他の接続機器のバッテリー寿命が向上していること
バッテリー寿命は、IoTデバイスや様々なコネクテッドデバイスの現在のシナリオにおいて重要な機能です。スマートフォンメーカーは、最新のスマートフォンが数年前のバージョンと大きく異なるため、大量のバッテリー寿命を持つデバイスを強化しようと常に試みています。また、スマートフォンの技術は年々進化しており、より高度なものになっています。その結果、特に産業分野ではM2M通信が頻繁に行われるようになり、コネクテッドデバイスの市場需要が拡大しています。家畜監視装置、スマートメーター、スマートパーキングソリューション、スマート街灯などのM2MまたはIoTデバイスの成長は、長距離接続のための接続デバイスの必要性の高まりによって促進されると予想されます。
初期投資・保守費用の低減と信頼性の向上
企業は、長期にわたって収益を拡大できないのであれば、最新技術への目立った投資は行いません。情報インフラが急速に整備され、経済が相互接続されるようになった今、このような配慮は以前にも増して適切になってきています。NB-IoTなどの技術は、非常にシンプルな波形を利用し、低消費電力で動作します。とはいえ、単に電力を節約すればいいというわけではありません。NB-IoTが普及すれば、NB-IoTのデバイスも安く作れるようになります。これは、顧客と企業の双方にさらなる利益をもたらすポジティブフィードバックサイクルを提供することになります。これらの要因は、ナローバンド・インターネット・オブ・シングスの採用を増加させ、それによって市場の拡大をサポートすると予測されます。
市場抑制要因
低速データ転送アプリケーションへの制限
NB-IoTデバイスではデータ転送速度が制限されており、ビデオ監視や音声通信のような顕著な帯域幅を必要とするアプリではセルラー能力が制限されます。GSM、高速データ通信、メッセージング、3G、LTE(Long Term Evolution)などの音声通信を行う携帯電話には不向きです。LTE-M(long-term evolution for machines)などの新しい技術は、データ通信速度が速く、携帯電話の機能を最も包括的に提供することが可能です。LTE-Mは他のLPWA技術に比べて帯域幅が広いため、モバイルネットワークや据置型での利用に適しています。したがって、これは今後数年間のナローバンド・インターネット・オブ・シングス市場の成長を阻害します。
コンポーネントの展望
コンポーネントに基づいて、ナローバンド・インターネット・オブ・シングス市場は、ソリューションとサービスに区分されます。2021年、サービスセグメントはナローバンド・インターネット・オブ・シングスで大きな収益シェアを獲得しました。これは、帯域効率とシステム容量を拡大しながら、連携するデバイスの消費電力を減少させるためです。また、様々な業界別でモノのインターネット(IoT)の導入が進んでいるため、このセグメントで市場が拡大しています。
アプリケーションの展望
狭帯域モノのインターネット市場は、アプリケーション別に、スマートメーター、スマートパッケージング、アラーム&ディテクター、スマートライトニング、トラッカー、ウェアラブル、その他に分類されます。2021年、トラッカーセグメントはナローバンドインターネットオブシングス市場において突出した収益シェアを記録しました。これは、人や資産のモニタリング&トラッキングからなる消費者向けや産業向けの利用が拡大しているためです。さらに、自動車部門からのナビゲーション、テレマティクス、車載インフォテインメント設備に対する需要の高まりは、予測期間を通じてトラッカー分野の発展に寄与すると予想されます。
展開モードの展望
展開に基づき、ナローバンド・インターネット・オブ・シングス市場は、インバンド、ガードバンド、スタンドアロンに細分化されます。2021年、スタンドアロン部門はナローバンド・インターネット・オブ・シングスでかなりの収益シェアを記録しました。スタンドアロン区分では、ワーカーはNB-IoTを使用して、アイドル周波数リソースを利用します。これらのリソースは、従業員の非標準帯域幅のスペクトルピースで構成されるか、リファーミングによって他のRAT(無線アクセス技術)から免除される場合があります。
業界別の展望
ナローバンド・インターネット・オブ・シングス市場は、垂直方向に基づいて、インフラ、農業、自動車、ヘルスケア、エネルギー&ユーティリティ、製造、家電、その他に分類されます。2021年、自動車分野はナローバンド・インターネット・オブ・シングス市場においてかなりの成長率を調達しました。自動車会社は、より便利で安全な輸送を提供できる高度な技術を使用することで、乗客が直面する安全関連の問題を克服しようとしています。そのため、NB-IoTは幹線道路の渋滞を回避・判断し、車両を追跡し、効率的な交通制御に貢献できることから、自動車産業におけるナローバンドIoTの導入が急速に拡大しています。
地域別の展望
ナローバンド・インターネット・オブ・シングス市場を地域別に見ると、北米、欧州、アジア太平洋、LAMEAで分析されます。2021年、北米地域はナローバンド・インターネット・オブ・シングス市場を独占し、最大の収益シェアを占めました。北米は、産業および消費者向けアプリケーションのソリューションの検討と商業化に集中している様々な支配的なデバイス生産者企業およびネットワークサービスサプライヤーの拠点です。技術に精通した人口の増加、可処分所得の増加、ビジネスや個人的なアプリケーションのための開発技術の継続的な受け入れは、地域の市場開発を推進する主要な要因のいくつかです。
市場参入企業がとっている主な戦略は、パートナーシップです。カーディナルマトリックスで提示された分析に基づいて、Huawei Technologies Co., Ltd., AT&T, Inc., Intel Corporation, Verizon Communications, Inc.は、ナローバンド物事のインターネット市場における先駆者です。Qualcomm, Inc.、MediaTek, Inc.、Ericsson ABなどの企業は、Narrowband Internet of Things市場における主要な革新者の一人です。
目次
第1章 市場の範囲と調査手法
- 市場の定義
- 目的
- 市場規模
- セグメンテーション
- 世界のナローバンドIoT市場、コンポーネント別
- 世界のナローバンドIoT市場、アプリケーション別
- ナローバンドIoTの世界市場、デプロイメントモード別
- ナローバンドIoT世界市場、業界別
- ナローバンドIoT世界市場、地域別
- 調査手法
第2章 市場概要
- イントロダクション
- 概要の説明
- 市場の構成とシナリオ
- 概要の説明
- 市場に影響を与える主な要因
- 市場促進要因
- 市場の抑制要因
第3章 競合分析-世界
- KBVカーディナルマトリックス
- 最近の業界全体の戦略的展開
- パートナーシップ、コラボレーション、契約
- 製品上市と製品拡大
- 地理的拡大
- 主要成功戦略
- 主要なリーディング戦略:割合の分布(2018-2022)
- 主要な戦略的動き:(パートナーシップ、コラボレーション&アグリーメント:2018年、3月~2022年、9月)主要なプレーヤーたち
第4章 世界のナローバンドIoT市場:コンポーネント別
- ソリューションの世界市場:地域別
- 地域別世界のサービス市場
第5章 世界のナローバンドIoT市場:アプリケーション別
- アラーム&ディテクターの世界市場:地域別
- スマートメーターの世界市場:地域別
- トラッカーの世界市場:地域別
- ウェアラブルデバイスの世界市場:地域別
- スマートパーキングの世界市場:地域別
- スマートライティングの世界市場:地域別
- 地域別世界のその他市場
第6章 ナローバンドIoTの世界市場:デプロイメントモード別
- 世界のガード市場:地域別
- スタンドアローンの世界市場:地域別
- インバンドの世界市場:地域別
第7章 世界のナローバンドIoT市場業界別
- インフラストラクチャの世界地域別市場
- エネルギー&ユーティリティの世界市場:地域別
- 自動車・輸送の世界市場:地域別
- 農業の世界市場:地域別
- ヘルスケアの世界市場:地域別
- コンシューマーエレクトロニクスの世界市場:地域別
- 製造業の世界市場:地域別
- 地域別世界のその他市場
第8章 世界のナローバンドIoT市場:地域別
- 北米
- 北米のナローバンドIoT国別市場
- 米国
- カナダ
- メキシコ
- その他北米地域
- 北米のナローバンドIoT国別市場
- 欧州
- 欧州ナローバンドIoT国別市場
- ドイツ
- 英国
- フランス
- ロシア
- スペイン
- イタリア
- その他欧州
- 欧州ナローバンドIoT国別市場
- アジア太平洋地域
- アジア太平洋地域のナローバンドIoTの国別市場
- 中国
- 日本
- インド
- 韓国
- シンガポール
- マレーシア
- その他アジア太平洋地域
- アジア太平洋地域のナローバンドIoTの国別市場
- LAMEA
- LAMEAナローバンドIoTの国別市場
- ブラジル
- アルゼンチン
- UAE
- サウジアラビア
- 南アフリカ共和国
- ナイジェリア
- LAMEAの他の地域
- LAMEAナローバンドIoTの国別市場
第9章 企業プロファイル
- Intel Corporation
- Qualcomm, Inc.
- Huawei Technologies Co., Ltd.(Huawei Investment & Holding Co., Ltd.)
- MediaTek, Inc.
- Nokia Corporation
- Verizon Communications, Inc.
- AT&T, Inc.
- Vodafone Group Plc
- Orange S.A
- Ericsson AB
LIST OF TABLES
- TABLE 1 Global Narrowband Internet of Things Market, 2018 - 2021, USD Million
- TABLE 2 Global Narrowband Internet of Things Market, 2022 - 2028, USD Million
- TABLE 3 Partnerships, Collaborations and Agreements- Narrowband Internet of Things Market
- TABLE 4 Product Launches And Product Expansions- Narrowband Internet of Things Market
- TABLE 5 geographical Expansions- Narrowband Internet of Things Market
- TABLE 6 Global Narrowband Internet of Things Market by Component, 2018 - 2021, USD Million
- TABLE 7 Global Narrowband Internet of Things Market by Component, 2022 - 2028, USD Million
- TABLE 8 Global Solution Market by Region, 2018 - 2021, USD Million
- TABLE 9 Global Solution Market by Region, 2022 - 2028, USD Million
- TABLE 10 Global Services Market by Region, 2018 - 2021, USD Million
- TABLE 11 Global Services Market by Region, 2022 - 2028, USD Million
- TABLE 12 Global Narrowband Internet of Things Market by Application, 2018 - 2021, USD Million
- TABLE 13 Global Narrowband Internet of Things Market by Application, 2022 - 2028, USD Million
- TABLE 14 Global Alarms & Detectors Market by Region, 2018 - 2021, USD Million
- TABLE 15 Global Alarms & Detectors Market by Region, 2022 - 2028, USD Million
- TABLE 16 Global Smart Meters Market by Region, 2018 - 2021, USD Million
- TABLE 17 Global Smart Meters Market by Region, 2022 - 2028, USD Million
- TABLE 18 Global Trackers Market by Region, 2018 - 2021, USD Million
- TABLE 19 Global Trackers Market by Region, 2022 - 2028, USD Million
- TABLE 20 Global Wearable Devices Market by Region, 2018 - 2021, USD Million
- TABLE 21 Global Wearable Devices Market by Region, 2022 - 2028, USD Million
- TABLE 22 Global Smart Parking Market by Region, 2018 - 2021, USD Million
- TABLE 23 Global Smart Parking Market by Region, 2022 - 2028, USD Million
- TABLE 24 Global Smart Lighting Market by Region, 2018 - 2021, USD Million
- TABLE 25 Global Smart Lighting Market by Region, 2022 - 2028, USD Million
- TABLE 26 Global Others Market by Region, 2018 - 2021, USD Million
- TABLE 27 Global Others Market by Region, 2022 - 2028, USD Million
- TABLE 28 Global Narrowband Internet of Things Market by Deployment Mode, 2018 - 2021, USD Million
- TABLE 29 Global Narrowband Internet of Things Market by Deployment Mode, 2022 - 2028, USD Million
- TABLE 30 Global Guard Market by Region, 2018 - 2021, USD Million
- TABLE 31 Global Guard Market by Region, 2022 - 2028, USD Million
- TABLE 32 Global Stand-alone Market by Region, 2018 - 2021, USD Million
- TABLE 33 Global Stand-alone Market by Region, 2022 - 2028, USD Million
- TABLE 34 Global In-band Market by Region, 2018 - 2021, USD Million
- TABLE 35 Global In-band Market by Region, 2022 - 2028, USD Million
- TABLE 36 Global Narrowband Internet of Things Market by Vertical, 2018 - 2021, USD Million
- TABLE 37 Global Narrowband Internet of Things Market by Vertical, 2022 - 2028, USD Million
- TABLE 38 Global Infrastructure Market by Region, 2018 - 2021, USD Million
- TABLE 39 Global Infrastructure Market by Region, 2022 - 2028, USD Million
- TABLE 40 Global Energy & Utilities Market by Region, 2018 - 2021, USD Million
- TABLE 41 Global Energy & Utilities Market by Region, 2022 - 2028, USD Million
- TABLE 42 Global Automotive & Transportation Market by Region, 2018 - 2021, USD Million
- TABLE 43 Global Automotive & Transportation Market by Region, 2022 - 2028, USD Million
- TABLE 44 Global Agriculture Market by Region, 2018 - 2021, USD Million
- TABLE 45 Global Agriculture Market by Region, 2022 - 2028, USD Million
- TABLE 46 Global Healthcare Market by Region, 2018 - 2021, USD Million
- TABLE 47 Global Healthcare Market by Region, 2022 - 2028, USD Million
- TABLE 48 Global Consumer Electronics Market by Region, 2018 - 2021, USD Million
- TABLE 49 Global Consumer Electronics Market by Region, 2022 - 2028, USD Million
- TABLE 50 Global Manufacturing Market by Region, 2018 - 2021, USD Million
- TABLE 51 Global Manufacturing Market by Region, 2022 - 2028, USD Million
- TABLE 52 Global Others Market by Region, 2018 - 2021, USD Million
- TABLE 53 Global Others Market by Region, 2022 - 2028, USD Million
- TABLE 54 Global Narrowband Internet of Things Market by Region, 2018 - 2021, USD Million
- TABLE 55 Global Narrowband Internet of Things Market by Region, 2022 - 2028, USD Million
- TABLE 56 North America Narrowband Internet of Things Market, 2018 - 2021, USD Million
- TABLE 57 North America Narrowband Internet of Things Market, 2022 - 2028, USD Million
- TABLE 58 North America Narrowband Internet of Things Market by Component, 2018 - 2021, USD Million
- TABLE 59 North America Narrowband Internet of Things Market by Component, 2022 - 2028, USD Million
- TABLE 60 North America Solution Market by Country, 2018 - 2021, USD Million
- TABLE 61 North America Solution Market by Country, 2022 - 2028, USD Million
- TABLE 62 North America Services Market by Country, 2018 - 2021, USD Million
- TABLE 63 North America Services Market by Country, 2022 - 2028, USD Million
- TABLE 64 North America Narrowband Internet of Things Market by Application, 2018 - 2021, USD Million
- TABLE 65 North America Narrowband Internet of Things Market by Application, 2022 - 2028, USD Million
- TABLE 66 North America Alarms & Detectors Market by Country, 2018 - 2021, USD Million
- TABLE 67 North America Alarms & Detectors Market by Country, 2022 - 2028, USD Million
- TABLE 68 North America Smart Meters Market by Country, 2018 - 2021, USD Million
- TABLE 69 North America Smart Meters Market by Country, 2022 - 2028, USD Million
- TABLE 70 North America Trackers Market by Country, 2018 - 2021, USD Million
- TABLE 71 North America Trackers Market by Country, 2022 - 2028, USD Million
- TABLE 72 North America Wearable Devices Market by Country, 2018 - 2021, USD Million
- TABLE 73 North America Wearable Devices Market by Country, 2022 - 2028, USD Million
- TABLE 74 North America Smart Parking Market by Country, 2018 - 2021, USD Million
- TABLE 75 North America Smart Parking Market by Country, 2022 - 2028, USD Million
- TABLE 76 North America Smart Lighting Market by Country, 2018 - 2021, USD Million
- TABLE 77 North America Smart Lighting Market by Country, 2022 - 2028, USD Million
- TABLE 78 North America Others Market by Country, 2018 - 2021, USD Million
- TABLE 79 North America Others Market by Country, 2022 - 2028, USD Million
- TABLE 80 North America Narrowband Internet of Things Market by Deployment Mode, 2018 - 2021, USD Million
- TABLE 81 North America Narrowband Internet of Things Market by Deployment Mode, 2022 - 2028, USD Million
- TABLE 82 North America Guard Market by Country, 2018 - 2021, USD Million
- TABLE 83 North America Guard Market by Country, 2022 - 2028, USD Million
- TABLE 84 North America Stand-alone Market by Country, 2018 - 2021, USD Million
- TABLE 85 North America Stand-alone Market by Country, 2022 - 2028, USD Million
- TABLE 86 North America In-band Market by Country, 2018 - 2021, USD Million
- TABLE 87 North America In-band Market by Country, 2022 - 2028, USD Million
- TABLE 88 North America Narrowband Internet of Things Market by Vertical, 2018 - 2021, USD Million
- TABLE 89 North America Narrowband Internet of Things Market by Vertical, 2022 - 2028, USD Million
- TABLE 90 North America Infrastructure Market by Country, 2018 - 2021, USD Million
- TABLE 91 North America Infrastructure Market by Country, 2022 - 2028, USD Million
- TABLE 92 North America Energy & Utilities Market by Country, 2018 - 2021, USD Million
- TABLE 93 North America Energy & Utilities Market by Country, 2022 - 2028, USD Million
- TABLE 94 North America Automotive & Transportation Market by Country, 2018 - 2021, USD Million
- TABLE 95 North America Automotive & Transportation Market by Country, 2022 - 2028, USD Million
- TABLE 96 North America Agriculture Market by Country, 2018 - 2021, USD Million
- TABLE 97 North America Agriculture Market by Country, 2022 - 2028, USD Million
- TABLE 98 North America Healthcare Market by Country, 2018 - 2021, USD Million
- TABLE 99 North America Healthcare Market by Country, 2022 - 2028, USD Million
- TABLE 100 North America Consumer Electronics Market by Country, 2018 - 2021, USD Million
- TABLE 101 North America Consumer Electronics Market by Country, 2022 - 2028, USD Million
- TABLE 102 North America Manufacturing Market by Country, 2018 - 2021, USD Million
- TABLE 103 North America Manufacturing Market by Country, 2022 - 2028, USD Million
- TABLE 104 North America Others Market by Country, 2018 - 2021, USD Million
- TABLE 105 North America Others Market by Country, 2022 - 2028, USD Million
- TABLE 106 North America Narrowband Internet of Things Market by Country, 2018 - 2021, USD Million
- TABLE 107 North America Narrowband Internet of Things Market by Country, 2022 - 2028, USD Million
- TABLE 108 US Narrowband Internet of Things Market, 2018 - 2021, USD Million
- TABLE 109 US Narrowband Internet of Things Market, 2022 - 2028, USD Million
- TABLE 110 US Narrowband Internet of Things Market by Component, 2018 - 2021, USD Million
- TABLE 111 US Narrowband Internet of Things Market by Component, 2022 - 2028, USD Million
- TABLE 112 US Narrowband Internet of Things Market by Application, 2018 - 2021, USD Million
- TABLE 113 US Narrowband Internet of Things Market by Application, 2022 - 2028, USD Million
- TABLE 114 US Narrowband Internet of Things Market by Deployment Mode, 2018 - 2021, USD Million
- TABLE 115 US Narrowband Internet of Things Market by Deployment Mode, 2022 - 2028, USD Million
- TABLE 116 US Narrowband Internet of Things Market by Vertical, 2018 - 2021, USD Million
- TABLE 117 US Narrowband Internet of Things Market by Vertical, 2022 - 2028, USD Million
- TABLE 118 Canada Narrowband Internet of Things Market, 2018 - 2021, USD Million
- TABLE 119 Canada Narrowband Internet of Things Market, 2022 - 2028, USD Million
- TABLE 120 Canada Narrowband Internet of Things Market by Component, 2018 - 2021, USD Million
- TABLE 121 Canada Narrowband Internet of Things Market by Component, 2022 - 2028, USD Million
- TABLE 122 Canada Narrowband Internet of Things Market by Application, 2018 - 2021, USD Million
- TABLE 123 Canada Narrowband Internet of Things Market by Application, 2022 - 2028, USD Million
- TABLE 124 Canada Narrowband Internet of Things Market by Deployment Mode, 2018 - 2021, USD Million
- TABLE 125 Canada Narrowband Internet of Things Market by Deployment Mode, 2022 - 2028, USD Million
- TABLE 126 Canada Narrowband Internet of Things Market by Vertical, 2018 - 2021, USD Million
- TABLE 127 Canada Narrowband Internet of Things Market by Vertical, 2022 - 2028, USD Million
- TABLE 128 Mexico Narrowband Internet of Things Market, 2018 - 2021, USD Million
- TABLE 129 Mexico Narrowband Internet of Things Market, 2022 - 2028, USD Million
- TABLE 130 Mexico Narrowband Internet of Things Market by Component, 2018 - 2021, USD Million
- TABLE 131 Mexico Narrowband Internet of Things Market by Component, 2022 - 2028, USD Million
- TABLE 132 Mexico Narrowband Internet of Things Market by Application, 2018 - 2021, USD Million
- TABLE 133 Mexico Narrowband Internet of Things Market by Application, 2022 - 2028, USD Million
- TABLE 134 Mexico Narrowband Internet of Things Market by Deployment Mode, 2018 - 2021, USD Million
- TABLE 135 Mexico Narrowband Internet of Things Market by Deployment Mode, 2022 - 2028, USD Million
- TABLE 136 Mexico Narrowband Internet of Things Market by Vertical, 2018 - 2021, USD Million
- TABLE 137 Mexico Narrowband Internet of Things Market by Vertical, 2022 - 2028, USD Million
- TABLE 138 Rest of North America Narrowband Internet of Things Market, 2018 - 2021, USD Million
- TABLE 139 Rest of North America Narrowband Internet of Things Market, 2022 - 2028, USD Million
- TABLE 140 Rest of North America Narrowband Internet of Things Market by Component, 2018 - 2021, USD Million
- TABLE 141 Rest of North America Narrowband Internet of Things Market by Component, 2022 - 2028, USD Million
- TABLE 142 Rest of North America Narrowband Internet of Things Market by Application, 2018 - 2021, USD Million
- TABLE 143 Rest of North America Narrowband Internet of Things Market by Application, 2022 - 2028, USD Million
- TABLE 144 Rest of North America Narrowband Internet of Things Market by Deployment Mode, 2018 - 2021, USD Million
- TABLE 145 Rest of North America Narrowband Internet of Things Market by Deployment Mode, 2022 - 2028, USD Million
- TABLE 146 Rest of North America Narrowband Internet of Things Market by Vertical, 2018 - 2021, USD Million
- TABLE 147 Rest of North America Narrowband Internet of Things Market by Vertical, 2022 - 2028, USD Million
- TABLE 148 Europe Narrowband Internet of Things Market, 2018 - 2021, USD Million
- TABLE 149 Europe Narrowband Internet of Things Market, 2022 - 2028, USD Million
- TABLE 150 Europe Narrowband Internet of Things Market by Component, 2018 - 2021, USD Million
- TABLE 151 Europe Narrowband Internet of Things Market by Component, 2022 - 2028, USD Million
- TABLE 152 Europe Solution Market by Country, 2018 - 2021, USD Million
- TABLE 153 Europe Solution Market by Country, 2022 - 2028, USD Million
- TABLE 154 Europe Services Market by Country, 2018 - 2021, USD Million
- TABLE 155 Europe Services Market by Country, 2022 - 2028, USD Million
- TABLE 156 Europe Narrowband Internet of Things Market by Application, 2018 - 2021, USD Million
- TABLE 157 Europe Narrowband Internet of Things Market by Application, 2022 - 2028, USD Million
- TABLE 158 Europe Alarms & Detectors Market by Country, 2018 - 2021, USD Million
- TABLE 159 Europe Alarms & Detectors Market by Country, 2022 - 2028, USD Million
- TABLE 160 Europe Smart Meters Market by Country, 2018 - 2021, USD Million
- TABLE 161 Europe Smart Meters Market by Country, 2022 - 2028, USD Million
- TABLE 162 Europe Trackers Market by Country, 2018 - 2021, USD Million
- TABLE 163 Europe Trackers Market by Country, 2022 - 2028, USD Million
- TABLE 164 Europe Wearable Devices Market by Country, 2018 - 2021, USD Million
- TABLE 165 Europe Wearable Devices Market by Country, 2022 - 2028, USD Million
- TABLE 166 Europe Smart Parking Market by Country, 2018 - 2021, USD Million
- TABLE 167 Europe Smart Parking Market by Country, 2022 - 2028, USD Million
- TABLE 168 Europe Smart Lighting Market by Country, 2018 - 2021, USD Million
- TABLE 169 Europe Smart Lighting Market by Country, 2022 - 2028, USD Million
- TABLE 170 Europe Others Market by Country, 2018 - 2021, USD Million
- TABLE 171 Europe Others Market by Country, 2022 - 2028, USD Million
- TABLE 172 Europe Narrowband Internet of Things Market by Deployment Mode, 2018 - 2021, USD Million
- TABLE 173 Europe Narrowband Internet of Things Market by Deployment Mode, 2022 - 2028, USD Million
- TABLE 174 Europe Guard Market by Country, 2018 - 2021, USD Million
- TABLE 175 Europe Guard Market by Country, 2022 - 2028, USD Million
- TABLE 176 Europe Stand-alone Market by Country, 2018 - 2021, USD Million
- TABLE 177 Europe Stand-alone Market by Country, 2022 - 2028, USD Million
- TABLE 178 Europe In-band Market by Country, 2018 - 2021, USD Million
- TABLE 179 Europe In-band Market by Country, 2022 - 2028, USD Million
- TABLE 180 Europe Narrowband Internet of Things Market by Vertical, 2018 - 2021, USD Million
- TABLE 181 Europe Narrowband Internet of Things Market by Vertical, 2022 - 2028, USD Million
- TABLE 182 Europe Infrastructure Market by Country, 2018 - 2021, USD Million
- TABLE 183 Europe Infrastructure Market by Country, 2022 - 2028, USD Million
- TABLE 184 Europe Energy & Utilities Market by Country, 2018 - 2021, USD Million
- TABLE 185 Europe Energy & Utilities Market by Country, 2022 - 2028, USD Million
- TABLE 186 Europe Automotive & Transportation Market by Country, 2018 - 2021, USD Million
- TABLE 187 Europe Automotive & Transportation Market by Country, 2022 - 2028, USD Million
- TABLE 188 Europe Agriculture Market by Country, 2018 - 2021, USD Million
- TABLE 189 Europe Agriculture Market by Country, 2022 - 2028, USD Million
- TABLE 190 Europe Healthcare Market by Country, 2018 - 2021, USD Million
- TABLE 191 Europe Healthcare Market by Country, 2022 - 2028, USD Million
- TABLE 192 Europe Consumer Electronics Market by Country, 2018 - 2021, USD Million
- TABLE 193 Europe Consumer Electronics Market by Country, 2022 - 2028, USD Million
- TABLE 194 Europe Manufacturing Market by Country, 2018 - 2021, USD Million
- TABLE 195 Europe Manufacturing Market by Country, 2022 - 2028, USD Million
- TABLE 196 Europe Others Market by Country, 2018 - 2021, USD Million
- TABLE 197 Europe Others Market by Country, 2022 - 2028, USD Million
- TABLE 198 Europe Narrowband Internet of Things Market by Country, 2018 - 2021, USD Million
- TABLE 199 Europe Narrowband Internet of Things Market by Country, 2022 - 2028, USD Million
- TABLE 200 Germany Narrowband Internet of Things Market, 2018 - 2021, USD Million
- TABLE 201 Germany Narrowband Internet of Things Market, 2022 - 2028, USD Million
- TABLE 202 Germany Narrowband Internet of Things Market by Component, 2018 - 2021, USD Million
- TABLE 203 Germany Narrowband Internet of Things Market by Component, 2022 - 2028, USD Million
- TABLE 204 Germany Narrowband Internet of Things Market by Application, 2018 - 2021, USD Million
- TABLE 205 Germany Narrowband Internet of Things Market by Application, 2022 - 2028, USD Million
- TABLE 206 Germany Narrowband Internet of Things Market by Deployment Mode, 2018 - 2021, USD Million
- TABLE 207 Germany Narrowband Internet of Things Market by Deployment Mode, 2022 - 2028, USD Million
- TABLE 208 Germany Narrowband Internet of Things Market by Vertical, 2018 - 2021, USD Million
- TABLE 209 Germany Narrowband Internet of Things Market by Vertical, 2022 - 2028, USD Million
- TABLE 210 UK Narrowband Internet of Things Market, 2018 - 2021, USD Million
- TABLE 211 UK Narrowband Internet of Things Market, 2022 - 2028, USD Million
- TABLE 212 UK Narrowband Internet of Things Market by Component, 2018 - 2021, USD Million
- TABLE 213 UK Narrowband Internet of Things Market by Component, 2022 - 2028, USD Million
- TABLE 214 UK Narrowband Internet of Things Market by Application, 2018 - 2021, USD Million
- TABLE 215 UK Narrowband Internet of Things Market by Application, 2022 - 2028, USD Million
- TABLE 216 UK Narrowband Internet of Things Market by Deployment Mode, 2018 - 2021, USD Million
- TABLE 217 UK Narrowband Internet of Things Market by Deployment Mode, 2022 - 2028, USD Million
- TABLE 218 UK Narrowband Internet of Things Market by Vertical, 2018 - 2021, USD Million
- TABLE 219 UK Narrowband Internet of Things Market by Vertical, 2022 - 2028, USD Million
- TABLE 220 France Narrowband Internet of Things Market, 2018 - 2021, USD Million
- TABLE 221 France Narrowband Internet of Things Market, 2022 - 2028, USD Million
- TABLE 222 France Narrowband Internet of Things Market by Component, 2018 - 2021, USD Million
- TABLE 223 France Narrowband Internet of Things Market by Component, 2022 - 2028, USD Million
- TABLE 224 France Narrowband Internet of Things Market by Application, 2018 - 2021, USD Million
- TABLE 225 France Narrowband Internet of Things Market by Application, 2022 - 2028, USD Million
- TABLE 226 France Narrowband Internet of Things Market by Deployment Mode, 2018 - 2021, USD Million
- TABLE 227 France Narrowband Internet of Things Market by Deployment Mode, 2022 - 2028, USD Million
- TABLE 228 France Narrowband Internet of Things Market by Vertical, 2018 - 2021, USD Million
- TABLE 229 France Narrowband Internet of Things Market by Vertical, 2022 - 2028, USD Million
- TABLE 230 Russia Narrowband Internet of Things Market, 2018 - 2021, USD Million
- TABLE 231 Russia Narrowband Internet of Things Market, 2022 - 2028, USD Million
- TABLE 232 Russia Narrowband Internet of Things Market by Component, 2018 - 2021, USD Million
- TABLE 233 Russia Narrowband Internet of Things Market by Component, 2022 - 2028, USD Million
- TABLE 234 Russia Narrowband Internet of Things Market by Application, 2018 - 2021, USD Million
- TABLE 235 Russia Narrowband Internet of Things Market by Application, 2022 - 2028, USD Million
- TABLE 236 Russia Narrowband Internet of Things Market by Deployment Mode, 2018 - 2021, USD Million
- TABLE 237 Russia Narrowband Internet of Things Market by Deployment Mode, 2022 - 2028, USD Million
- TABLE 238 Russia Narrowband Internet of Things Market by Vertical, 2018 - 2021, USD Million
- TABLE 239 Russia Narrowband Internet of Things Market by Vertical, 2022 - 2028, USD Million
- TABLE 240 Spain Narrowband Internet of Things Market, 2018 - 2021, USD Million
- TABLE 241 Spain Narrowband Internet of Things Market, 2022 - 2028, USD Million
- TABLE 242 Spain Narrowband Internet of Things Market by Component, 2018 - 2021, USD Million
- TABLE 243 Spain Narrowband Internet of Things Market by Component, 2022 - 2028, USD Million
- TABLE 244 Spain Narrowband Internet of Things Market by Application, 2018 - 2021, USD Million
- TABLE 245 Spain Narrowband Internet of Things Market by Application, 2022 - 2028, USD Million
- TABLE 246 Spain Narrowband Internet of Things Market by Deployment Mode, 2018 - 2021, USD Million
- TABLE 247 Spain Narrowband Internet of Things Market by Deployment Mode, 2022 - 2028, USD Million
- TABLE 248 Spain Narrowband Internet of Things Market by Vertical, 2018 - 2021, USD Million
- TABLE 249 Spain Narrowband Internet of Things Market by Vertical, 2022 - 2028, USD Million
- TABLE 250 Italy Narrowband Internet of Things Market, 2018 - 2021, USD Million
- TABLE 251 Italy Narrowband Internet of Things Market, 2022 - 2028, USD Million
- TABLE 252 Italy Narrowband Internet of Things Market by Component, 2018 - 2021, USD Million
- TABLE 253 Italy Narrowband Internet of Things Market by Component, 2022 - 2028, USD Million
- TABLE 254 Italy Narrowband Internet of Things Market by Application, 2018 - 2021, USD Million
- TABLE 255 Italy Narrowband Internet of Things Market by Application, 2022 - 2028, USD Million
- TABLE 256 Italy Narrowband Internet of Things Market by Deployment Mode, 2018 - 2021, USD Million
- TABLE 257 Italy Narrowband Internet of Things Market by Deployment Mode, 2022 - 2028, USD Million
- TABLE 258 Italy Narrowband Internet of Things Market by Vertical, 2018 - 2021, USD Million
- TABLE 259 Italy Narrowband Internet of Things Market by Vertical, 2022 - 2028, USD Million
- TABLE 260 Rest of Europe Narrowband Internet of Things Market, 2018 - 2021, USD Million
- TABLE 261 Rest of Europe Narrowband Internet of Things Market, 2022 - 2028, USD Million
- TABLE 262 Rest of Europe Narrowband Internet of Things Market by Component, 2018 - 2021, USD Million
- TABLE 263 Rest of Europe Narrowband Internet of Things Market by Component, 2022 - 2028, USD Million
- TABLE 264 Rest of Europe Narrowband Internet of Things Market by Application, 2018 - 2021, USD Million
- TABLE 265 Rest of Europe Narrowband Internet of Things Market by Application, 2022 - 2028, USD Million
- TABLE 266 Rest of Europe Narrowband Internet of Things Market by Deployment Mode, 2018 - 2021, USD Million
- TABLE 267 Rest of Europe Narrowband Internet of Things Market by Deployment Mode, 2022 - 2028, USD Million
- TABLE 268 Rest of Europe Narrowband Internet of Things Market by Vertical, 2018 - 2021, USD Million
- TABLE 269 Rest of Europe Narrowband Internet of Things Market by Vertical, 2022 - 2028, USD Million
- TABLE 270 Asia Pacific Narrowband Internet of Things Market, 2018 - 2021, USD Million
- TABLE 271 Asia Pacific Narrowband Internet of Things Market, 2022 - 2028, USD Million
- TABLE 272 Asia Pacific Narrowband Internet of Things Market by Component, 2018 - 2021, USD Million
- TABLE 273 Asia Pacific Narrowband Internet of Things Market by Component, 2022 - 2028, USD Million
- TABLE 274 Asia Pacific Solution Market by Country, 2018 - 2021, USD Million
- TABLE 275 Asia Pacific Solution Market by Country, 2022 - 2028, USD Million
- TABLE 276 Asia Pacific Services Market by Country, 2018 - 2021, USD Million
- TABLE 277 Asia Pacific Services Market by Country, 2022 - 2028, USD Million
- TABLE 278 Asia Pacific Narrowband Internet of Things Market by Application, 2018 - 2021, USD Million
- TABLE 279 Asia Pacific Narrowband Internet of Things Market by Application, 2022 - 2028, USD Million
- TABLE 280 Asia Pacific Alarms & Detectors Market by Country, 2018 - 2021, USD Million
- TABLE 281 Asia Pacific Alarms & Detectors Market by Country, 2022 - 2028, USD Million
- TABLE 282 Asia Pacific Smart Meters Market by Country, 2018 - 2021, USD Million
- TABLE 283 Asia Pacific Smart Meters Market by Country, 2022 - 2028, USD Million
- TABLE 284 Asia Pacific Trackers Market by Country, 2018 - 2021, USD Million
- TABLE 285 Asia Pacific Trackers Market by Country, 2022 - 2028, USD Million
- TABLE 286 Asia Pacific Wearable Devices Market by Country, 2018 - 2021, USD Million
- TABLE 287 Asia Pacific Wearable Devices Market by Country, 2022 - 2028, USD Million
- TABLE 288 Asia Pacific Smart Parking Market by Country, 2018 - 2021, USD Million
- TABLE 289 Asia Pacific Smart Parking Market by Country, 2022 - 2028, USD Million
- TABLE 290 Asia Pacific Smart Lighting Market by Country, 2018 - 2021, USD Million
- TABLE 291 Asia Pacific Smart Lighting Market by Country, 2022 - 2028, USD Million
- TABLE 292 Asia Pacific Others Market by Country, 2018 - 2021, USD Million
- TABLE 293 Asia Pacific Others Market by Country, 2022 - 2028, USD Million
- TABLE 294 Asia Pacific Narrowband Internet of Things Market by Deployment Mode, 2018 - 2021, USD Million
- TABLE 295 Asia Pacific Narrowband Internet of Things Market by Deployment Mode, 2022 - 2028, USD Million
- TABLE 296 Asia Pacific Guard Market by Country, 2018 - 2021, USD Million
- TABLE 297 Asia Pacific Guard Market by Country, 2022 - 2028, USD Million
- TABLE 298 Asia Pacific Stand-alone Market by Country, 2018 - 2021, USD Million
- TABLE 299 Asia Pacific Stand-alone Market by Country, 2022 - 2028, USD Million
- TABLE 300 Asia Pacific In-band Market by Country, 2018 - 2021, USD Million
- TABLE 301 Asia Pacific In-band Market by Country, 2022 - 2028, USD Million
- TABLE 302 Asia Pacific Narrowband Internet of Things Market by Vertical, 2018 - 2021, USD Million
- TABLE 303 Asia Pacific Narrowband Internet of Things Market by Vertical, 2022 - 2028, USD Million
- TABLE 304 Asia Pacific Infrastructure Market by Country, 2018 - 2021, USD Million
- TABLE 305 Asia Pacific Infrastructure Market by Country, 2022 - 2028, USD Million
- TABLE 306 Asia Pacific Energy & Utilities Market by Country, 2018 - 2021, USD Million
- TABLE 307 Asia Pacific Energy & Utilities Market by Country, 2022 - 2028, USD Million
- TABLE 308 Asia Pacific Automotive & Transportation Market by Country, 2018 - 2021, USD Million
- TABLE 309 Asia Pacific Automotive & Transportation Market by Country, 2022 - 2028, USD Million
- TABLE 310 Asia Pacific Agriculture Market by Country, 2018 - 2021, USD Million
- TABLE 311 Asia Pacific Agriculture Market by Country, 2022 - 2028, USD Million
- TABLE 312 Asia Pacific Healthcare Market by Country, 2018 - 2021, USD Million
- TABLE 313 Asia Pacific Healthcare Market by Country, 2022 - 2028, USD Million
- TABLE 314 Asia Pacific Consumer Electronics Market by Country, 2018 - 2021, USD Million
- TABLE 315 Asia Pacific Consumer Electronics Market by Country, 2022 - 2028, USD Million
- TABLE 316 Asia Pacific Manufacturing Market by Country, 2018 - 2021, USD Million
- TABLE 317 Asia Pacific Manufacturing Market by Country, 2022 - 2028, USD Million
- TABLE 318 Asia Pacific Others Market by Country, 2018 - 2021, USD Million
- TABLE 319 Asia Pacific Others Market by Country, 2022 - 2028, USD Million
- TABLE 320 Asia Pacific Narrowband Internet of Things Market by Country, 2018 - 2021, USD Million
- TABLE 321 Asia Pacific Narrowband Internet of Things Market by Country, 2022 - 2028, USD Million
- TABLE 322 China Narrowband Internet of Things Market, 2018 - 2021, USD Million
- TABLE 323 China Narrowband Internet of Things Market, 2022 - 2028, USD Million
- TABLE 324 China Narrowband Internet of Things Market by Component, 2018 - 2021, USD Million
- TABLE 325 China Narrowband Internet of Things Market by Component, 2022 - 2028, USD Million
- TABLE 326 China Narrowband Internet of Things Market by Application, 2018 - 2021, USD Million
- TABLE 327 China Narrowband Internet of Things Market by Application, 2022 - 2028, USD Million
- TABLE 328 China Narrowband Internet of Things Market by Deployment Mode, 2018 - 2021, USD Million
- TABLE 329 China Narrowband Internet of Things Market by Deployment Mode, 2022 - 2028, USD Million
- TABLE 330 China Narrowband Internet of Things Market by Vertical, 2018 - 2021, USD Million
- TABLE 331 China Narrowband Internet of Things Market by Vertical, 2022 - 2028, USD Million
- TABLE 332 Japan Narrowband Internet of Things Market, 2018 - 2021, USD Million
- TABLE 333 Japan Narrowband Internet of Things Market, 2022 - 2028, USD Million
- TABLE 334 Japan Narrowband Internet of Things Market by Component, 2018 - 2021, USD Million
- TABLE 335 Japan Narrowband Internet of Things Market by Component, 2022 - 2028, USD Million
- TABLE 336 Japan Narrowband Internet of Things Market by Application, 2018 - 2021, USD Million
- TABLE 337 Japan Narrowband Internet of Things Market by Application, 2022 - 2028, USD Million
- TABLE 338 Japan Narrowband Internet of Things Market by Deployment Mode, 2018 - 2021, USD Million
- TABLE 339 Japan Narrowband Internet of Things Market by Deployment Mode, 2022 - 2028, USD Million
- TABLE 340 Japan Narrowband Internet of Things Market by Vertical, 2018 - 2021, USD Million
- TABLE 341 Japan Narrowband Internet of Things Market by Vertical, 2022 - 2028, USD Million
- TABLE 342 India Narrowband Internet of Things Market, 2018 - 2021, USD Million
- TABLE 343 India Narrowband Internet of Things Market, 2022 - 2028, USD Million
- TABLE 344 India Narrowband Internet of Things Market by Component, 2018 - 2021, USD Million
- TABLE 345 India Narrowband Internet of Things Market by Component, 2022 - 2028, USD Million
- TABLE 346 India Narrowband Internet of Things Market by Application, 2018 - 2021, USD Million
- TABLE 347 India Narrowband Internet of Things Market by Application, 2022 - 2028, USD Million
- TABLE 348 India Narrowband Internet of Things Market by Deployment Mode, 2018 - 2021, USD Million
- TABLE 349 India Narrowband Internet of Things Market by Deployment Mode, 2022 - 2028, USD Million
- TABLE 350 India Narrowband Internet of Things Market by Vertical, 2018 - 2021, USD Million
- TABLE 351 India Narrowband Internet of Things Market by Vertical, 2022 - 2028, USD Million
- TABLE 352 South Korea Narrowband Internet of Things Market, 2018 - 2021, USD Million
- TABLE 353 South Korea Narrowband Internet of Things Market, 2022 - 2028, USD Million
- TABLE 354 South Korea Narrowband Internet of Things Market by Component, 2018 - 2021, USD Million
- TABLE 355 South Korea Narrowband Internet of Things Market by Component, 2022 - 2028, USD Million
- TABLE 356 South Korea Narrowband Internet of Things Market by Application, 2018 - 2021, USD Million
- TABLE 357 South Korea Narrowband Internet of Things Market by Application, 2022 - 2028, USD Million
- TABLE 358 South Korea Narrowband Internet of Things Market by Deployment Mode, 2018 - 2021, USD Million
- TABLE 359 South Korea Narrowband Internet of Things Market by Deployment Mode, 2022 - 2028, USD Million
- TABLE 360 South Korea Narrowband Internet of Things Market by Vertical, 2018 - 2021, USD Million
- TABLE 361 South Korea Narrowband Internet of Things Market by Vertical, 2022 - 2028, USD Million
- TABLE 362 Singapore Narrowband Internet of Things Market, 2018 - 2021, USD Million
- TABLE 363 Singapore Narrowband Internet of Things Market, 2022 - 2028, USD Million
- TABLE 364 Singapore Narrowband Internet of Things Market by Component, 2018 - 2021, USD Million
- TABLE 365 Singapore Narrowband Internet of Things Market by Component, 2022 - 2028, USD Million
- TABLE 366 Singapore Narrowband Internet of Things Market by Application, 2018 - 2021, USD Million
- TABLE 367 Singapore Narrowband Internet of Things Market by Application, 2022 - 2028, USD Million
- TABLE 368 Singapore Narrowband Internet of Things Market by Deployment Mode, 2018 - 2021, USD Million
- TABLE 369 Singapore Narrowband Internet of Things Market by Deployment Mode, 2022 - 2028, USD Million
- TABLE 370 Singapore Narrowband Internet of Things Market by Vertical, 2018 - 2021, USD Million
- TABLE 371 Singapore Narrowband Internet of Things Market by Vertical, 2022 - 2028, USD Million
- TABLE 372 Malaysia Narrowband Internet of Things Market, 2018 - 2021, USD Million
- TABLE 373 Malaysia Narrowband Internet of Things Market, 2022 - 2028, USD Million
- TABLE 374 Malaysia Narrowband Internet of Things Market by Component, 2018 - 2021, USD Million
- TABLE 375 Malaysia Narrowband Internet of Things Market by Component, 2022 - 2028, USD Million
- TABLE 376 Malaysia Narrowband Internet of Things Market by Application, 2018 - 2021, USD Million
- TABLE 377 Malaysia Narrowband Internet of Things Market by Application, 2022 - 2028, USD Million
- TABLE 378 Malaysia Narrowband Internet of Things Market by Deployment Mode, 2018 - 2021, USD Million
- TABLE 379 Malaysia Narrowband Internet of Things Market by Deployment Mode, 2022 - 2028, USD Million
- TABLE 380 Malaysia Narrowband Internet of Things Market by Vertical, 2018 - 2021, USD Million
- TABLE 381 Malaysia Narrowband Internet of Things Market by Vertical, 2022 - 2028, USD Million
- TABLE 382 Rest of Asia Pacific Narrowband Internet of Things Market, 2018 - 2021, USD Million
- TABLE 383 Rest of Asia Pacific Narrowband Internet of Things Market, 2022 - 2028, USD Million
- TABLE 384 Rest of Asia Pacific Narrowband Internet of Things Market by Component, 2018 - 2021, USD Million
- TABLE 385 Rest of Asia Pacific Narrowband Internet of Things Market by Component, 2022 - 2028, USD Million
- TABLE 386 Rest of Asia Pacific Narrowband Internet of Things Market by Application, 2018 - 2021, USD Million
- TABLE 387 Rest of Asia Pacific Narrowband Internet of Things Market by Application, 2022 - 2028, USD Million
- TABLE 388 Rest of Asia Pacific Narrowband Internet of Things Market by Deployment Mode, 2018 - 2021, USD Million
- TABLE 389 Rest of Asia Pacific Narrowband Internet of Things Market by Deployment Mode, 2022 - 2028, USD Million
- TABLE 390 Rest of Asia Pacific Narrowband Internet of Things Market by Vertical, 2018 - 2021, USD Million
- TABLE 391 Rest of Asia Pacific Narrowband Internet of Things Market by Vertical, 2022 - 2028, USD Million
- TABLE 392 LAMEA Narrowband Internet of Things Market, 2018 - 2021, USD Million
- TABLE 393 LAMEA Narrowband Internet of Things Market, 2022 - 2028, USD Million
- TABLE 394 LAMEA Narrowband Internet of Things Market by Component, 2018 - 2021, USD Million
- TABLE 395 LAMEA Narrowband Internet of Things Market by Component, 2022 - 2028, USD Million
- TABLE 396 LAMEA Solution Market by Country, 2018 - 2021, USD Million
- TABLE 397 LAMEA Solution Market by Country, 2022 - 2028, USD Million
- TABLE 398 LAMEA Services Market by Country, 2018 - 2021, USD Million
- TABLE 399 LAMEA Services Market by Country, 2022 - 2028, USD Million
- TABLE 400 LAMEA Narrowband Internet of Things Market by Application, 2018 - 2021, USD Million
- TABLE 401 LAMEA Narrowband Internet of Things Market by Application, 2022 - 2028, USD Million
- TABLE 402 LAMEA Alarms & Detectors Market by Country, 2018 - 2021, USD Million
- TABLE 403 LAMEA Alarms & Detectors Market by Country, 2022 - 2028, USD Million
- TABLE 404 LAMEA Smart Meters Market by Country, 2018 - 2021, USD Million
- TABLE 405 LAMEA Smart Meters Market by Country, 2022 - 2028, USD Million
- TABLE 406 LAMEA Trackers Market by Country, 2018 - 2021, USD Million
- TABLE 407 LAMEA Trackers Market by Country, 2022 - 2028, USD Million
- TABLE 408 LAMEA Wearable Devices Market by Country, 2018 - 2021, USD Million
- TABLE 409 LAMEA Wearable Devices Market by Country, 2022 - 2028, USD Million
- TABLE 410 LAMEA Smart Parking Market by Country, 2018 - 2021, USD Million
- TABLE 411 LAMEA Smart Parking Market by Country, 2022 - 2028, USD Million
- TABLE 412 LAMEA Smart Lighting Market by Country, 2018 - 2021, USD Million
- TABLE 413 LAMEA Smart Lighting Market by Country, 2022 - 2028, USD Million
- TABLE 414 LAMEA Others Market by Country, 2018 - 2021, USD Million
- TABLE 415 LAMEA Others Market by Country, 2022 - 2028, USD Million
- TABLE 416 LAMEA Narrowband Internet of Things Market by Deployment Mode, 2018 - 2021, USD Million
- TABLE 417 LAMEA Narrowband Internet of Things Market by Deployment Mode, 2022 - 2028, USD Million
- TABLE 418 LAMEA Guard Market by Country, 2018 - 2021, USD Million
- TABLE 419 LAMEA Guard Market by Country, 2022 - 2028, USD Million
- TABLE 420 LAMEA Stand-alone Market by Country, 2018 - 2021, USD Million
- TABLE 421 LAMEA Stand-alone Market by Country, 2022 - 2028, USD Million
- TABLE 422 LAMEA In-band Market by Country, 2018 - 2021, USD Million
- TABLE 423 LAMEA In-band Market by Country, 2022 - 2028, USD Million
- TABLE 424 LAMEA Narrowband Internet of Things Market by Vertical, 2018 - 2021, USD Million
- TABLE 425 LAMEA Narrowband Internet of Things Market by Vertical, 2022 - 2028, USD Million
- TABLE 426 LAMEA Infrastructure Market by Country, 2018 - 2021, USD Million
- TABLE 427 LAMEA Infrastructure Market by Country, 2022 - 2028, USD Million
- TABLE 428 LAMEA Energy & Utilities Market by Country, 2018 - 2021, USD Million
- TABLE 429 LAMEA Energy & Utilities Market by Country, 2022 - 2028, USD Million
- TABLE 430 LAMEA Automotive & Transportation Market by Country, 2018 - 2021, USD Million
- TABLE 431 LAMEA Automotive & Transportation Market by Country, 2022 - 2028, USD Million
- TABLE 432 LAMEA Agriculture Market by Country, 2018 - 2021, USD Million
- TABLE 433 LAMEA Agriculture Market by Country, 2022 - 2028, USD Million
- TABLE 434 LAMEA Healthcare Market by Country, 2018 - 2021, USD Million
- TABLE 435 LAMEA Healthcare Market by Country, 2022 - 2028, USD Million
- TABLE 436 LAMEA Consumer Electronics Market by Country, 2018 - 2021, USD Million
- TABLE 437 LAMEA Consumer Electronics Market by Country, 2022 - 2028, USD Million
- TABLE 438 LAMEA Manufacturing Market by Country, 2018 - 2021, USD Million
- TABLE 439 LAMEA Manufacturing Market by Country, 2022 - 2028, USD Million
- TABLE 440 LAMEA Others Market by Country, 2018 - 2021, USD Million
- TABLE 441 LAMEA Others Market by Country, 2022 - 2028, USD Million
- TABLE 442 LAMEA Narrowband Internet of Things Market by Country, 2018 - 2021, USD Million
- TABLE 443 LAMEA Narrowband Internet of Things Market by Country, 2022 - 2028, USD Million
- TABLE 444 Brazil Narrowband Internet of Things Market, 2018 - 2021, USD Million
- TABLE 445 Brazil Narrowband Internet of Things Market, 2022 - 2028, USD Million
- TABLE 446 Brazil Narrowband Internet of Things Market by Component, 2018 - 2021, USD Million
- TABLE 447 Brazil Narrowband Internet of Things Market by Component, 2022 - 2028, USD Million
- TABLE 448 Brazil Narrowband Internet of Things Market by Application, 2018 - 2021, USD Million
- TABLE 449 Brazil Narrowband Internet of Things Market by Application, 2022 - 2028, USD Million
- TABLE 450 Brazil Narrowband Internet of Things Market by Deployment Mode, 2018 - 2021, USD Million
- TABLE 451 Brazil Narrowband Internet of Things Market by Deployment Mode, 2022 - 2028, USD Million
- TABLE 452 Brazil Narrowband Internet of Things Market by Vertical, 2018 - 2021, USD Million
- TABLE 453 Brazil Narrowband Internet of Things Market by Vertical, 2022 - 2028, USD Million
- TABLE 454 Argentina Narrowband Internet of Things Market, 2018 - 2021, USD Million
- TABLE 455 Argentina Narrowband Internet of Things Market, 2022 - 2028, USD Million
- TABLE 456 Argentina Narrowband Internet of Things Market by Component, 2018 - 2021, USD Million
- TABLE 457 Argentina Narrowband Internet of Things Market by Component, 2022 - 2028, USD Million
- TABLE 458 Argentina Narrowband Internet of Things Market by Application, 2018 - 2021, USD Million
- TABLE 459 Argentina Narrowband Internet of Things Market by Application, 2022 - 2028, USD Million
- TABLE 460 Argentina Narrowband Internet of Things Market by Deployment Mode, 2018 - 2021, USD Million
- TABLE 461 Argentina Narrowband Internet of Things Market by Deployment Mode, 2022 - 2028, USD Million
- TABLE 462 Argentina Narrowband Internet of Things Market by Vertical, 2018 - 2021, USD Million
- TABLE 463 Argentina Narrowband Internet of Things Market by Vertical, 2022 - 2028, USD Million
- TABLE 464 UAE Narrowband Internet of Things Market, 2018 - 2021, USD Million
- TABLE 465 UAE Narrowband Internet of Things Market, 2022 - 2028, USD Million
- TABLE 466 UAE Narrowband Internet of Things Market by Component, 2018 - 2021, USD Million
- TABLE 467 UAE Narrowband Internet of Things Market by Component, 2022 - 2028, USD Million
- TABLE 468 UAE Narrowband Internet of Things Market by Application, 2018 - 2021, USD Million
- TABLE 469 UAE Narrowband Internet of Things Market by Application, 2022 - 2028, USD Million
- TABLE 470 UAE Narrowband Internet of Things Market by Deployment Mode, 2018 - 2021, USD Million
- TABLE 471 UAE Narrowband Internet of Things Market by Deployment Mode, 2022 - 2028, USD Million
- TABLE 472 UAE Narrowband Internet of Things Market by Vertical, 2018 - 2021, USD Million
- TABLE 473 UAE Narrowband Internet of Things Market by Vertical, 2022 - 2028, USD Million
- TABLE 474 Saudi Arabia Narrowband Internet of Things Market, 2018 - 2021, USD Million
- TABLE 475 Saudi Arabia Narrowband Internet of Things Market, 2022 - 2028, USD Million
- TABLE 476 Saudi Arabia Narrowband Internet of Things Market by Component, 2018 - 2021, USD Million
- TABLE 477 Saudi Arabia Narrowband Internet of Things Market by Component, 2022 - 2028, USD Million
- TABLE 478 Saudi Arabia Narrowband Internet of Things Market by Application, 2018 - 2021, USD Million
- TABLE 479 Saudi Arabia Narrowband Internet of Things Market by Application, 2022 - 2028, USD Million
- TABLE 480 Saudi Arabia Narrowband Internet of Things Market by Deployment Mode, 2018 - 2021, USD Million
- TABLE 481 Saudi Arabia Narrowband Internet of Things Market by Deployment Mode, 2022 - 2028, USD Million
- TABLE 482 Saudi Arabia Narrowband Internet of Things Market by Vertical, 2018 - 2021, USD Million
- TABLE 483 Saudi Arabia Narrowband Internet of Things Market by Vertical, 2022 - 2028, USD Million
- TABLE 484 South Africa Narrowband Internet of Things Market, 2018 - 2021, USD Million
- TABLE 485 South Africa Narrowband Internet of Things Market, 2022 - 2028, USD Million
- TABLE 486 South Africa Narrowband Internet of Things Market by Component, 2018 - 2021, USD Million
- TABLE 487 South Africa Narrowband Internet of Things Market by Component, 2022 - 2028, USD Million
- TABLE 488 South Africa Narrowband Internet of Things Market by Application, 2018 - 2021, USD Million
- TABLE 489 South Africa Narrowband Internet of Things Market by Application, 2022 - 2028, USD Million
- TABLE 490 South Africa Narrowband Internet of Things Market by Deployment Mode, 2018 - 2021, USD Million
- TABLE 491 South Africa Narrowband Internet of Things Market by Deployment Mode, 2022 - 2028, USD Million
- TABLE 492 South Africa Narrowband Internet of Things Market by Vertical, 2018 - 2021, USD Million
- TABLE 493 South Africa Narrowband Internet of Things Market by Vertical, 2022 - 2028, USD Million
- TABLE 494 Nigeria Narrowband Internet of Things Market, 2018 - 2021, USD Million
- TABLE 495 Nigeria Narrowband Internet of Things Market, 2022 - 2028, USD Million
- TABLE 496 Nigeria Narrowband Internet of Things Market by Component, 2018 - 2021, USD Million
- TABLE 497 Nigeria Narrowband Internet of Things Market by Component, 2022 - 2028, USD Million
- TABLE 498 Nigeria Narrowband Internet of Things Market by Application, 2018 - 2021, USD Million
- TABLE 499 Nigeria Narrowband Internet of Things Market by Application, 2022 - 2028, USD Million
- TABLE 500 Nigeria Narrowband Internet of Things Market by Deployment Mode, 2018 - 2021, USD Million
- TABLE 501 Nigeria Narrowband Internet of Things Market by Deployment Mode, 2022 - 2028, USD Million
- TABLE 502 Nigeria Narrowband Internet of Things Market by Vertical, 2018 - 2021, USD Million
- TABLE 503 Nigeria Narrowband Internet of Things Market by Vertical, 2022 - 2028, USD Million
- TABLE 504 Rest of LAMEA Narrowband Internet of Things Market, 2018 - 2021, USD Million
- TABLE 505 Rest of LAMEA Narrowband Internet of Things Market, 2022 - 2028, USD Million
- TABLE 506 Rest of LAMEA Narrowband Internet of Things Market by Component, 2018 - 2021, USD Million
- TABLE 507 Rest of LAMEA Narrowband Internet of Things Market by Component, 2022 - 2028, USD Million
- TABLE 508 Rest of LAMEA Narrowband Internet of Things Market by Application, 2018 - 2021, USD Million
- TABLE 509 Rest of LAMEA Narrowband Internet of Things Market by Application, 2022 - 2028, USD Million
- TABLE 510 Rest of LAMEA Narrowband Internet of Things Market by Deployment Mode, 2018 - 2021, USD Million
- TABLE 511 Rest of LAMEA Narrowband Internet of Things Market by Deployment Mode, 2022 - 2028, USD Million
- TABLE 512 Rest of LAMEA Narrowband Internet of Things Market by Vertical, 2018 - 2021, USD Million
- TABLE 513 Rest of LAMEA Narrowband Internet of Things Market by Vertical, 2022 - 2028, USD Million
- TABLE 514 Key Information - Intel Corporation
- TABLE 515 Key Information - Qualcomm, Inc.
- TABLE 516 key information - Huawei Technologies Co., Ltd.
- TABLE 517 Key Information - MediaTek, Inc.
- TABLE 518 Key Information - Nokia Corporation
- TABLE 519 key information - Verizon Communications, Inc.
- TABLE 520 Key Information - AT&T, Inc.
- TABLE 521 Key information - Vodafone Group Plc
- TABLE 522 Key Information - Orange S.A.
- TABLE 523 key information - Ericsson AB
List of Figures
- FIG 1 Methodology for the research
- FIG 2 KBV Cardinal Matrix
- FIG 3 Key Leading Strategies: Percentage Distribution (2018-2022)
- FIG 4 Key Strategic Move: (Partnerships, Collaborations & Agreements: 2018, Mar - 2022, Sep) Leading Players
- FIG 5 Global Narrowband Internet of Things Market share by Component, 2021
- FIG 6 Global Narrowband Internet of Things Market share by Component, 2028
- FIG 7 Global Narrowband Internet of Things Market by Component, 2018 - 2028, USD Million
- FIG 8 Global Narrowband Internet of Things Market share by Application, 2021
- FIG 9 Global Narrowband Internet of Things Market share by Application, 2028
- FIG 10 Global Narrowband Internet of Things Market by Application, 2018 - 2028, USD Million
- FIG 11 Global Narrowband Internet of Things Market share by Deployment Mode, 2021
- FIG 12 Global Narrowband Internet of Things Market share by Deployment Mode, 2028
- FIG 13 Global Narrowband Internet of Things Market by Deployment Mode, 2018 - 2028, USD Million
- FIG 14 Global Narrowband Internet of Things Market share by Vertical, 2021
- FIG 15 Global Narrowband Internet of Things Market share by Vertical, 2028
- FIG 16 Global Narrowband Internet of Things Market by Vertical, 2018 - 2028, USD Million
- FIG 17 Global Narrowband Internet of Things Market share by Region, 2021
- FIG 18 Global Narrowband Internet of Things Market share by Region, 2028
- FIG 19 Global Narrowband Internet of Things Market by Region, 2018 - 2028, USD Million
- FIG 20 SWOT analysis: Intel corporation
- FIG 21 SWOT Analysis: Qualcomm, Inc.
- FIG 22 Recent strategies and developments: Huawei technologies Co., Ltd
- FIG 23 Recent strategies and developments: MediaTek, Inc.
- FIG 24 SWOT Analysis: Orange S.A.
The Global Narrowband Internet of Things Market size is expected to reach $9.6 billion by 2028, rising at a market growth of 51.5% CAGR during the forecast period.
Narrowband IoT refers to a LPWA (low power wide space) technology that was designed to transform a good range of latest IoT services and devices. The technology dependably and firmly manages less amount of relatively seldom two-way knowledge. Narrowband IoT remarkably betters operators' device spectrum potency, system capability, and power consumption. The technology enables various devices and solutions such as utilities, wearables, good parking, and industrial solutions.
In general, LPWA technologies bridges the gap between mobiles, such as 3G and LTE, and short-range wireless, such as ZigBee networks, Wi-Fi, and Bluetooth. Narrowband IoT is supported by all major module makers, mobile instrumentality, and chipsets. NB-IoT would co-exist with 4G, 3G, and 2G mobile networks and collaborative profits from the privacy and safety choices of mobile networks, such as entity authentication, support for user identity confidentiality, knowledge integrity, confidentiality, and mobile instrumentality identification.
The application of narrowband IoT leads to various benefits such as price savings, power potency, wider preparation, and dependability. Narrowband IoT allows the cost-effective powering of IoT devices. Because technologies such as NB-IoT have a few complex waveforms, they tend to use less power. NB-IoT chips are cheaper as they are less complex to make. Narrowband IoT application also leads to enhanced dependability for operators because of the bonded resource allotment needed for controlled quality of service.
NB-IoT is set to directly connect the narrowband IoT usage and might be perceived as extra wide-enforced with the growing urbanization worldwide. NB-IoT devices are employed within the commissioned spectrum and ensure reliable and secure property to consumers.
COVID-19 Impact Analysis
Major corporations have evolved towards use of automation technologies as a result of the COVID-19 pandemic, particularly in the area of drones for monitoring and drug delivery. Robotics and automation could boost productivity in a circumstances created by pandemic by reducing the need for human labour and decreasing the likelihood of future plant closures. IoT, AI, and digitalization will also become increasingly important in the future and define the new way of working. Owing to all these factors, the market for narrowband internet of things has significantly benefited from the spread of novel coronavirus and also will witness growth prospects after the pandemic period.
Market Growth Factors
Growing adoption of IoT technologies and better battery life of other connected devices
Battery life is a significant feature in the current scenario of IoT devices and various connected devices. Smartphone manufacturers are constantly attempting to enhance devices with massive battery life as the latest smartphones are so distinct from their previous versions that were available a few years back. Additionally, technologies are developing and turning out to be more sophisticated and advanced every year. As a result, the market demand for connected devices is growing, especially in the industrial sector, as M2M communications got more frequent. The growth of M2M or IoT devices involving livestock monitoring equipment, smart meters, smart parking solutions, and smart streetlights is expected to be propelled by the rising necessity for connected devices for long-range connectivity.
Low Initial and Maintenance Prices Together With Rising Reliability
Businesses will not make remarkable investments in the latsest technology if it doesn't expand their bottom line for prolonged period. With the quickly growing information infrastructure and the economy being so interconnected, this consideration has become more appropriate than before. NB-IoT and other technologies utilize a very simple waveform, which operates on low power. Nevertheless, it is not just about saving power. As NB-IoT is gaining more popularity, creating NB-IoT devices would become cheaper. This would provide with a positive feedback cycle that would further benefit both customers and companies. These factors are predicted to increase the adoption of narrowband internet of things, thereby supporting the market expansion.
Market Restraining Factors
Restricted To Low-Speed Data Transmission Applications
Data transfer speeds are restricted in NB-IoT devices, which limits their cellular abilities in apps that demand remarkable bandwidth, like video surveillance and voice communication. It is unsuitable for mobile handsets utilizing GSM, high-speed data transmission, messaging, 3G, and LTE (long-term evolution) for voice. Emerging technologies like LTE-M (long-term evolution for machines) have quicker data speeds, which enables them to offer the most inclusive scale of cellular capabilities. LTE-M has the highest bandwidth compared to other LPWA technologies, making it accurate for mobile networks and stationary usage. Therefore, this obstructs the growth of the narrowband internet of things market in the upcoming years.
Component Outlook
Based on components, the narrowband internet of things market is segmented into solutions and services. In 2021, the service segment garnered a significant revenue share in the narrowband internet of things. This is due to decreased power consumption of linked devices while expanding bandwidth efficiency and system capacity. In addition, the market is expanding in this segment due to the increased adoption of internet of things (IoT) in various industry verticals.
Application Outlook
By application, the narrowband internet of things market is divided into smart meter, smart packaging, alarm & detector, smart lightning, tracker, wearable and others. In 2021, the tracker segment recorded a prominent revenue share in the narrowband internet of things market. This is because of the expanding consumer and industrial usage comprising monitoring & tracking of people and assets. In addition, the growing demand for navigation, telematics, and in-car infotainment facilities from the automotive sector is expected to contribute to the development of the tracker segment throughout the predicted period.
Deployment Mode Outlook
On the basis of deployment, the narrowband internet of things market is fragmented into in-band, guard band, and standalone. In 2021, the standalone segment registered a substantial revenue share in the narrowband internet of things. In the standalone category, workers use NB-IoT to take advantage of idle spectrum resources. These resources may consist of the employee's non-standard bandwidth spectrum pieces or be exempt from other RATs (radio access technologies) through refarming.
Vertical Outlook
Based on vertical, the narrowband internet of things market is classified into infrastructure, agriculture, automotive, healthcare, energy & utilities, manufacturing, consumer electronics and others. In 2021, the automotive segment procured a considerable growth rate in the narrowband internet of things market. The automotive companies are trying to overcome the safety related issues faced by passengers by using advanced technologies that could provide more convenient and safer transportation. As such, the implementation of narrowband-IoT in the automotive industry is rapidly growing because of the ability of NB-IoT to avoid and determine main road congestions, track vehicles, and contribute in efficient traffic control.
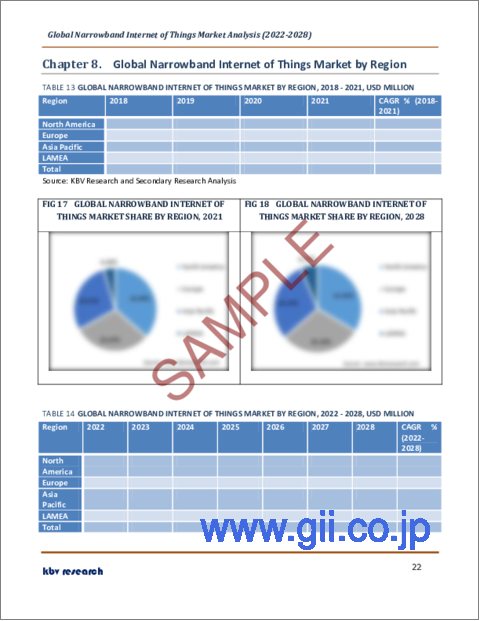
Regional Outlook
Region-wise, the narrowband internet of things market, is analysed across North America, Europe, Asia Pacific and LAMEA. In 2021, the North America region dominated the narrowband internet of things market with the maximum revenue share. North America is the hub of various dominating device producer businesses and network service suppliers concentrating on examining & commercializing solutions for industrial and consumer applications. The growing tech-savvy population, increasing disposable income, and continuous acceptance of developing technologies for business and personal applications are some of the prime factors propelling the regional market development.
The major strategies followed by the market participants are Partnerships. Based on the Analysis presented in the Cardinal matrix; Huawei Technologies Co., Ltd., AT&T, Inc., Intel Corporation, Verizon Communications, Inc. are the forerunners in the Narrowband Internet of Things Market. Companies such as Qualcomm, Inc., MediaTek, Inc., and Ericsson AB are some of the key innovators in Narrowband Internet of Things Market.
The market research report covers the analysis of key stake holders of the market. Key companies profiled in the report include Intel Corporation, Qualcomm, Inc., Huawei Technologies Co., Ltd. MediaTek, Inc., Nokia Corporation, Verizon Communications, Inc., AT&T, Inc., Vodafone Group Plc, Orange S.A., and Ericsson AB.
Recent Strategies Deployed in Narrowband Internet of Things Market
Partnerships, Collaborations & Agreements
Sep-2022: Vodafone signed an agreement with Topcon Positioning Group, a global designer and manufacturer of precision positioning systems. Under this agreement, both companies would advance the latest mass-market precise positioning system that would determine the place of Internet of Things (IoT) devices, vehicles, and machinery with higher accuracy than utilizing only specific global navigation satellite systems.
Jun-2022: Huawei Technologies signed an Agreement with Nordic Semiconductor, a semiconductor company engaged in designing and producing connectivity and SoC solutions. This agreement would allow and support large-scale deployment of this low-power cellular IoT technology by different sectors.
Jun-2022: MediaTek came into partnership with Proscend, a provider of Industrial IoT solutions. This partnership would aim to allow seamless 5G deployment and propel the path for better-connected experiences.
Mar-2021: Nokia announced an expanded partnership with Mobility, a telecommunications services company based in Saudi Arabia. This partnership would address the requirements of modern businesses by allowing a vast spectrum of commercial uses including industrial appliances, smart city infrastructure, powering connected health, and smart metering for utilities. Moreover, Nokia's new NB-IoT technology would enable Mobily's customers to use IoT services regardless of their region, location, or area.
Sep-2020: MediaTek entered into a partnership with Tuya Smart, a leader in providing AI+IoT platforms. Following this partnership, the companies aimed to unveil their novel Narrow Band-Internet of Things modules viz. NM1, NM1-GL, and NM1-CT. Moreover, the solutions are built on 3GPP Release 14 standard MT2625 of MediaTek and powered by the cloud platform of Tuya to allow devices to provide advantages to smart city applications, including fire hydrant inspections, street light controllers, and municipal manhole covers.
Aug-2020: MediaTek joined hands with Inmarsat, a satellite telecoms company. This collaboration aimed to propel market efforts and initiatives to converge satellite and cellular networks in the 5G era.
Product Launches and Product Expansions
Jan-2023: MediaTek launched the octa-core Genio 700, the chipset in the Genio platform for IoT devices built for industrial IoT products, smart retail, and smart home. The product enables designers to customize products using Android, Ubuntu, and Yocto Linux. Moreover, with this launch customers can simply advance their products with the least amount of effort.
Dec-2022: Qualcomm Technologies, Inc. unveiled Qualcomm QCX216 LTE IoT Modem, the new Internet of Things (IoT) mode. The product is a comprehensive solution that delivers better computing abilities, location-based technologies, and connectivity to allow the latest generation of powerful, fast, and high-performing IoT Solutions.
Apr-2020: Qualcomm unveiled the Qualcomm 212 LTE IoT Modem, a robust power-efficient single-mode NB-IoT chipset. The new product aimed to propel the expansion of cellular IoT through its advanced power-efficient chipset architecture allowing extremely low average power consumption.
Scope of the Study
Market Segments covered in the Report:
By Component
- Solution
- Services
By Application
- Alarms & Detectors
- Smart Meters
- Trackers
- Wearable Devices
- Smart Parking
- Smart Lighting
- Others
By Deployment Mode
- Guard
- Stand-alone
- In-band
By Vertical
- Infrastructure
- Energy & Utilities
- Automotive & Transportation
- Agriculture
- Healthcare
- Consumer Electronics
- Manufacturing
- Others
By Geography
- North America
- US
- Canada
- Mexico
- Rest of North America
- Europe
- Germany
- UK
- France
- Russia
- Spain
- Italy
- Rest of Europe
- Asia Pacific
- China
- Japan
- India
- South Korea
- Singapore
- Malaysia
- Rest of Asia Pacific
- LAMEA
- Brazil
- Argentina
- UAE
- Saudi Arabia
- South Africa
- Nigeria
- Rest of LAMEA
Companies Profiled
- Intel Corporation
- Qualcomm, Inc.
- Huawei Technologies Co., Ltd.
- MediaTek, Inc.
- Nokia Corporation
- Verizon Communications, Inc.
- AT&T, Inc.
- Vodafone Group Plc
- Orange S.A.
- Ericsson AB
Unique Offerings from KBV Research
- Exhaustive coverage
- Highest number of market tables and figures
- Subscription based model available
- Guaranteed best price
- Assured post sales research support with 10% customization free
Table of Contents
Chapter 1. Market Scope & Methodology
- 1.1 Market Definition
- 1.2 Objectives
- 1.3 Market Scope
- 1.4 Segmentation
- 1.4.1 Global Narrowband Internet of Things Market, by Component
- 1.4.2 Global Narrowband Internet of Things Market, by Application
- 1.4.3 Global Narrowband Internet of Things Market, by Deployment Mode
- 1.4.4 Global Narrowband Internet of Things Market, by Vertical
- 1.4.5 Global Narrowband Internet of Things Market, by Geography
- 1.5 Methodology for the research
Chapter 2. Market Overview
- 2.1 Introduction
- 2.1.1 Overview
- 2.1.1.1 Market Composition & Scenario
- 2.1.1 Overview
- 2.2 Key Factors Impacting the Market
- 2.2.1 Market Drivers
- 2.2.2 Market Restraints
Chapter 3. Competition Analysis - Global
- 3.1 KBV Cardinal Matrix
- 3.2 Recent Industry Wide Strategic Developments
- 3.2.1 Partnerships, Collaborations and Agreements
- 3.2.2 Product Launches and Product Expansions
- 3.2.3 Geographical Expansions
- 3.3 Top Winning Strategies
- 3.3.1 Key Leading Strategies: Percentage Distribution (2018-2022)
- 3.3.2 Key Strategic Move: (Partnerships, Collaborations & Agreements : 2018, Mar - 2022, Sep) Leading Players
Chapter 4. Global Narrowband Internet of Things Market by Component
- 4.1 Global Solution Market by Region
- 4.2 Global Services Market by Region
Chapter 5. Global Narrowband Internet of Things Market by Application
- 5.1 Global Alarms & Detectors Market by Region
- 5.2 Global Smart Meters Market by Region
- 5.3 Global Trackers Market by Region
- 5.4 Global Wearable Devices Market by Region
- 5.5 Global Smart Parking Market by Region
- 5.6 Global Smart Lighting Market by Region
- 5.7 Global Others Market by Region
Chapter 6. Global Narrowband Internet of Things Market by Deployment Mode
- 6.1 Global Guard Market by Region
- 6.2 Global Stand-alone Market by Region
- 6.3 Global In-band Market by Region
Chapter 7. Global Narrowband Internet of Things Market by Vertical
- 7.1 Global Infrastructure Market by Region
- 7.2 Global Energy & Utilities Market by Region
- 7.3 Global Automotive & Transportation Market by Region
- 7.4 Global Agriculture Market by Region
- 7.5 Global Healthcare Market by Region
- 7.6 Global Consumer Electronics Market by Region
- 7.7 Global Manufacturing Market by Region
- 7.8 Global Others Market by Region
Chapter 8. Global Narrowband Internet of Things Market by Region
- 8.1 North America Narrowband Internet of Things Market
- 8.1.1 North America Narrowband Internet of Things Market by Component
- 8.1.1.1 North America Solution Market by Country
- 8.1.1.2 North America Services Market by Country
- 8.1.2 North America Narrowband Internet of Things Market by Application
- 8.1.2.1 North America Alarms & Detectors Market by Country
- 8.1.2.2 North America Smart Meters Market by Country
- 8.1.2.3 North America Trackers Market by Country
- 8.1.2.4 North America Wearable Devices Market by Country
- 8.1.2.5 North America Smart Parking Market by Country
- 8.1.2.6 North America Smart Lighting Market by Country
- 8.1.2.7 North America Others Market by Country
- 8.1.3 North America Narrowband Internet of Things Market by Deployment Mode
- 8.1.3.1 North America Guard Market by Country
- 8.1.3.2 North America Stand-alone Market by Country
- 8.1.3.3 North America In-band Market by Country
- 8.1.4 North America Narrowband Internet of Things Market by Vertical
- 8.1.4.1 North America Infrastructure Market by Country
- 8.1.4.2 North America Energy & Utilities Market by Country
- 8.1.4.3 North America Automotive & Transportation Market by Country
- 8.1.4.4 North America Agriculture Market by Country
- 8.1.4.5 North America Healthcare Market by Country
- 8.1.4.6 North America Consumer Electronics Market by Country
- 8.1.4.7 North America Manufacturing Market by Country
- 8.1.4.8 North America Others Market by Country
- 8.1.5 North America Narrowband Internet of Things Market by Country
- 8.1.5.1 US Narrowband Internet of Things Market
- 8.1.5.1.1 US Narrowband Internet of Things Market by Component
- 8.1.5.1.2 US Narrowband Internet of Things Market by Application
- 8.1.5.1.3 US Narrowband Internet of Things Market by Deployment Mode
- 8.1.5.1.4 US Narrowband Internet of Things Market by Vertical
- 8.1.5.2 Canada Narrowband Internet of Things Market
- 8.1.5.2.1 Canada Narrowband Internet of Things Market by Component
- 8.1.5.2.2 Canada Narrowband Internet of Things Market by Application
- 8.1.5.2.3 Canada Narrowband Internet of Things Market by Deployment Mode
- 8.1.5.2.4 Canada Narrowband Internet of Things Market by Vertical
- 8.1.5.3 Mexico Narrowband Internet of Things Market
- 8.1.5.3.1 Mexico Narrowband Internet of Things Market by Component
- 8.1.5.3.2 Mexico Narrowband Internet of Things Market by Application
- 8.1.5.3.3 Mexico Narrowband Internet of Things Market by Deployment Mode
- 8.1.5.3.4 Mexico Narrowband Internet of Things Market by Vertical
- 8.1.5.4 Rest of North America Narrowband Internet of Things Market
- 8.1.5.4.1 Rest of North America Narrowband Internet of Things Market by Component
- 8.1.5.4.2 Rest of North America Narrowband Internet of Things Market by Application
- 8.1.5.4.3 Rest of North America Narrowband Internet of Things Market by Deployment Mode
- 8.1.5.4.4 Rest of North America Narrowband Internet of Things Market by Vertical
- 8.1.5.1 US Narrowband Internet of Things Market
- 8.1.1 North America Narrowband Internet of Things Market by Component
- 8.2 Europe Narrowband Internet of Things Market
- 8.2.1 Europe Narrowband Internet of Things Market by Component
- 8.2.1.1 Europe Solution Market by Country
- 8.2.1.2 Europe Services Market by Country
- 8.2.2 Europe Narrowband Internet of Things Market by Application
- 8.2.2.1 Europe Alarms & Detectors Market by Country
- 8.2.2.2 Europe Smart Meters Market by Country
- 8.2.2.3 Europe Trackers Market by Country
- 8.2.2.4 Europe Wearable Devices Market by Country
- 8.2.2.5 Europe Smart Parking Market by Country
- 8.2.2.6 Europe Smart Lighting Market by Country
- 8.2.2.7 Europe Others Market by Country
- 8.2.3 Europe Narrowband Internet of Things Market by Deployment Mode
- 8.2.3.1 Europe Guard Market by Country
- 8.2.3.2 Europe Stand-alone Market by Country
- 8.2.3.3 Europe In-band Market by Country
- 8.2.4 Europe Narrowband Internet of Things Market by Vertical
- 8.2.4.1 Europe Infrastructure Market by Country
- 8.2.4.2 Europe Energy & Utilities Market by Country
- 8.2.4.3 Europe Automotive & Transportation Market by Country
- 8.2.4.4 Europe Agriculture Market by Country
- 8.2.4.5 Europe Healthcare Market by Country
- 8.2.4.6 Europe Consumer Electronics Market by Country
- 8.2.4.7 Europe Manufacturing Market by Country
- 8.2.4.8 Europe Others Market by Country
- 8.2.5 Europe Narrowband Internet of Things Market by Country
- 8.2.5.1 Germany Narrowband Internet of Things Market
- 8.2.5.1.1 Germany Narrowband Internet of Things Market by Component
- 8.2.5.1.2 Germany Narrowband Internet of Things Market by Application
- 8.2.5.1.3 Germany Narrowband Internet of Things Market by Deployment Mode
- 8.2.5.1.4 Germany Narrowband Internet of Things Market by Vertical
- 8.2.5.2 UK Narrowband Internet of Things Market
- 8.2.5.2.1 UK Narrowband Internet of Things Market by Component
- 8.2.5.2.2 UK Narrowband Internet of Things Market by Application
- 8.2.5.2.3 UK Narrowband Internet of Things Market by Deployment Mode
- 8.2.5.2.4 UK Narrowband Internet of Things Market by Vertical
- 8.2.5.3 France Narrowband Internet of Things Market
- 8.2.5.3.1 France Narrowband Internet of Things Market by Component
- 8.2.5.3.2 France Narrowband Internet of Things Market by Application
- 8.2.5.3.3 France Narrowband Internet of Things Market by Deployment Mode
- 8.2.5.3.4 France Narrowband Internet of Things Market by Vertical
- 8.2.5.4 Russia Narrowband Internet of Things Market
- 8.2.5.4.1 Russia Narrowband Internet of Things Market by Component
- 8.2.5.4.2 Russia Narrowband Internet of Things Market by Application
- 8.2.5.4.3 Russia Narrowband Internet of Things Market by Deployment Mode
- 8.2.5.4.4 Russia Narrowband Internet of Things Market by Vertical
- 8.2.5.5 Spain Narrowband Internet of Things Market
- 8.2.5.5.1 Spain Narrowband Internet of Things Market by Component
- 8.2.5.5.2 Spain Narrowband Internet of Things Market by Application
- 8.2.5.5.3 Spain Narrowband Internet of Things Market by Deployment Mode
- 8.2.5.5.4 Spain Narrowband Internet of Things Market by Vertical
- 8.2.5.6 Italy Narrowband Internet of Things Market
- 8.2.5.6.1 Italy Narrowband Internet of Things Market by Component
- 8.2.5.6.2 Italy Narrowband Internet of Things Market by Application
- 8.2.5.6.3 Italy Narrowband Internet of Things Market by Deployment Mode
- 8.2.5.6.4 Italy Narrowband Internet of Things Market by Vertical
- 8.2.5.7 Rest of Europe Narrowband Internet of Things Market
- 8.2.5.7.1 Rest of Europe Narrowband Internet of Things Market by Component
- 8.2.5.7.2 Rest of Europe Narrowband Internet of Things Market by Application
- 8.2.5.7.3 Rest of Europe Narrowband Internet of Things Market by Deployment Mode
- 8.2.5.7.4 Rest of Europe Narrowband Internet of Things Market by Vertical
- 8.2.5.1 Germany Narrowband Internet of Things Market
- 8.2.1 Europe Narrowband Internet of Things Market by Component
- 8.3 Asia Pacific Narrowband Internet of Things Market
- 8.3.1 Asia Pacific Narrowband Internet of Things Market by Component
- 8.3.1.1 Asia Pacific Solution Market by Country
- 8.3.1.2 Asia Pacific Services Market by Country
- 8.3.2 Asia Pacific Narrowband Internet of Things Market by Application
- 8.3.2.1 Asia Pacific Alarms & Detectors Market by Country
- 8.3.2.2 Asia Pacific Smart Meters Market by Country
- 8.3.2.3 Asia Pacific Trackers Market by Country
- 8.3.2.4 Asia Pacific Wearable Devices Market by Country
- 8.3.2.5 Asia Pacific Smart Parking Market by Country
- 8.3.2.6 Asia Pacific Smart Lighting Market by Country
- 8.3.2.7 Asia Pacific Others Market by Country
- 8.3.3 Asia Pacific Narrowband Internet of Things Market by Deployment Mode
- 8.3.3.1 Asia Pacific Guard Market by Country
- 8.3.3.2 Asia Pacific Stand-alone Market by Country
- 8.3.3.3 Asia Pacific In-band Market by Country
- 8.3.4 Asia Pacific Narrowband Internet of Things Market by Vertical
- 8.3.4.1 Asia Pacific Infrastructure Market by Country
- 8.3.4.2 Asia Pacific Energy & Utilities Market by Country
- 8.3.4.3 Asia Pacific Automotive & Transportation Market by Country
- 8.3.4.4 Asia Pacific Agriculture Market by Country
- 8.3.4.5 Asia Pacific Healthcare Market by Country
- 8.3.4.6 Asia Pacific Consumer Electronics Market by Country
- 8.3.4.7 Asia Pacific Manufacturing Market by Country
- 8.3.4.8 Asia Pacific Others Market by Country
- 8.3.5 Asia Pacific Narrowband Internet of Things Market by Country
- 8.3.5.1 China Narrowband Internet of Things Market
- 8.3.5.1.1 China Narrowband Internet of Things Market by Component
- 8.3.5.1.2 China Narrowband Internet of Things Market by Application
- 8.3.5.1.3 China Narrowband Internet of Things Market by Deployment Mode
- 8.3.5.1.4 China Narrowband Internet of Things Market by Vertical
- 8.3.5.2 Japan Narrowband Internet of Things Market
- 8.3.5.2.1 Japan Narrowband Internet of Things Market by Component
- 8.3.5.2.2 Japan Narrowband Internet of Things Market by Application
- 8.3.5.2.3 Japan Narrowband Internet of Things Market by Deployment Mode
- 8.3.5.2.4 Japan Narrowband Internet of Things Market by Vertical
- 8.3.5.3 India Narrowband Internet of Things Market
- 8.3.5.3.1 India Narrowband Internet of Things Market by Component
- 8.3.5.3.2 India Narrowband Internet of Things Market by Application
- 8.3.5.3.3 India Narrowband Internet of Things Market by Deployment Mode
- 8.3.5.3.4 India Narrowband Internet of Things Market by Vertical
- 8.3.5.4 South Korea Narrowband Internet of Things Market
- 8.3.5.4.1 South Korea Narrowband Internet of Things Market by Component
- 8.3.5.4.2 South Korea Narrowband Internet of Things Market by Application
- 8.3.5.4.3 South Korea Narrowband Internet of Things Market by Deployment Mode
- 8.3.5.4.4 South Korea Narrowband Internet of Things Market by Vertical
- 8.3.5.5 Singapore Narrowband Internet of Things Market
- 8.3.5.5.1 Singapore Narrowband Internet of Things Market by Component
- 8.3.5.5.2 Singapore Narrowband Internet of Things Market by Application
- 8.3.5.5.3 Singapore Narrowband Internet of Things Market by Deployment Mode
- 8.3.5.5.4 Singapore Narrowband Internet of Things Market by Vertical
- 8.3.5.6 Malaysia Narrowband Internet of Things Market
- 8.3.5.6.1 Malaysia Narrowband Internet of Things Market by Component
- 8.3.5.6.2 Malaysia Narrowband Internet of Things Market by Application
- 8.3.5.6.3 Malaysia Narrowband Internet of Things Market by Deployment Mode
- 8.3.5.6.4 Malaysia Narrowband Internet of Things Market by Vertical
- 8.3.5.7 Rest of Asia Pacific Narrowband Internet of Things Market
- 8.3.5.7.1 Rest of Asia Pacific Narrowband Internet of Things Market by Component
- 8.3.5.7.2 Rest of Asia Pacific Narrowband Internet of Things Market by Application
- 8.3.5.7.3 Rest of Asia Pacific Narrowband Internet of Things Market by Deployment Mode
- 8.3.5.7.4 Rest of Asia Pacific Narrowband Internet of Things Market by Vertical
- 8.3.5.1 China Narrowband Internet of Things Market
- 8.3.1 Asia Pacific Narrowband Internet of Things Market by Component
- 8.4 LAMEA Narrowband Internet of Things Market
- 8.4.1 LAMEA Narrowband Internet of Things Market by Component
- 8.4.1.1 LAMEA Solution Market by Country
- 8.4.1.2 LAMEA Services Market by Country
- 8.4.2 LAMEA Narrowband Internet of Things Market by Application
- 8.4.2.1 LAMEA Alarms & Detectors Market by Country
- 8.4.2.2 LAMEA Smart Meters Market by Country
- 8.4.2.3 LAMEA Trackers Market by Country
- 8.4.2.4 LAMEA Wearable Devices Market by Country
- 8.4.2.5 LAMEA Smart Parking Market by Country
- 8.4.2.6 LAMEA Smart Lighting Market by Country
- 8.4.2.7 LAMEA Others Market by Country
- 8.4.3 LAMEA Narrowband Internet of Things Market by Deployment Mode
- 8.4.3.1 LAMEA Guard Market by Country
- 8.4.3.2 LAMEA Stand-alone Market by Country
- 8.4.3.3 LAMEA In-band Market by Country
- 8.4.4 LAMEA Narrowband Internet of Things Market by Vertical
- 8.4.4.1 LAMEA Infrastructure Market by Country
- 8.4.4.2 LAMEA Energy & Utilities Market by Country
- 8.4.4.3 LAMEA Automotive & Transportation Market by Country
- 8.4.4.4 LAMEA Agriculture Market by Country
- 8.4.4.5 LAMEA Healthcare Market by Country
- 8.4.4.6 LAMEA Consumer Electronics Market by Country
- 8.4.4.7 LAMEA Manufacturing Market by Country
- 8.4.4.8 LAMEA Others Market by Country
- 8.4.5 LAMEA Narrowband Internet of Things Market by Country
- 8.4.5.1 Brazil Narrowband Internet of Things Market
- 8.4.5.1.1 Brazil Narrowband Internet of Things Market by Component
- 8.4.5.1.2 Brazil Narrowband Internet of Things Market by Application
- 8.4.5.1.3 Brazil Narrowband Internet of Things Market by Deployment Mode
- 8.4.5.1.4 Brazil Narrowband Internet of Things Market by Vertical
- 8.4.5.2 Argentina Narrowband Internet of Things Market
- 8.4.5.2.1 Argentina Narrowband Internet of Things Market by Component
- 8.4.5.2.2 Argentina Narrowband Internet of Things Market by Application
- 8.4.5.2.3 Argentina Narrowband Internet of Things Market by Deployment Mode
- 8.4.5.2.4 Argentina Narrowband Internet of Things Market by Vertical
- 8.4.5.3 UAE Narrowband Internet of Things Market
- 8.4.5.3.1 UAE Narrowband Internet of Things Market by Component
- 8.4.5.3.2 UAE Narrowband Internet of Things Market by Application
- 8.4.5.3.3 UAE Narrowband Internet of Things Market by Deployment Mode
- 8.4.5.3.4 UAE Narrowband Internet of Things Market by Vertical
- 8.4.5.4 Saudi Arabia Narrowband Internet of Things Market
- 8.4.5.4.1 Saudi Arabia Narrowband Internet of Things Market by Component
- 8.4.5.4.2 Saudi Arabia Narrowband Internet of Things Market by Application
- 8.4.5.4.3 Saudi Arabia Narrowband Internet of Things Market by Deployment Mode
- 8.4.5.4.4 Saudi Arabia Narrowband Internet of Things Market by Vertical
- 8.4.5.5 South Africa Narrowband Internet of Things Market
- 8.4.5.5.1 South Africa Narrowband Internet of Things Market by Component
- 8.4.5.5.2 South Africa Narrowband Internet of Things Market by Application
- 8.4.5.5.3 South Africa Narrowband Internet of Things Market by Deployment Mode
- 8.4.5.5.4 South Africa Narrowband Internet of Things Market by Vertical
- 8.4.5.6 Nigeria Narrowband Internet of Things Market
- 8.4.5.6.1 Nigeria Narrowband Internet of Things Market by Component
- 8.4.5.6.2 Nigeria Narrowband Internet of Things Market by Application
- 8.4.5.6.3 Nigeria Narrowband Internet of Things Market by Deployment Mode
- 8.4.5.6.4 Nigeria Narrowband Internet of Things Market by Vertical
- 8.4.5.7 Rest of LAMEA Narrowband Internet of Things Market
- 8.4.5.7.1 Rest of LAMEA Narrowband Internet of Things Market by Component
- 8.4.5.7.2 Rest of LAMEA Narrowband Internet of Things Market by Application
- 8.4.5.7.3 Rest of LAMEA Narrowband Internet of Things Market by Deployment Mode
- 8.4.5.7.4 Rest of LAMEA Narrowband Internet of Things Market by Vertical
- 8.4.5.1 Brazil Narrowband Internet of Things Market
- 8.4.1 LAMEA Narrowband Internet of Things Market by Component
Chapter 9. Company Profiles
- 9.1 Intel Corporation
- 9.1.1 Company Overview
- 9.1.2 Financial Analysis
- 9.1.3 Segmental and Regional Analysis
- 9.1.4 Research & Development Expenses
- 9.1.5 SWOT Analysis
- 9.2 Qualcomm, Inc.
- 9.2.1 Company Overview
- 9.2.2 Financial Analysis
- 9.2.3 Segmental and Regional Analysis
- 9.2.4 Research & Development Expense
- 9.2.5 Recent strategies and developments:
- 9.2.5.1 Product Launches and Product Expansions:
- 9.2.6 SWOT Analysis
- 9.3 Huawei Technologies Co., Ltd. (Huawei Investment & Holding Co., Ltd.)
- 9.3.1 Company Overview
- 9.3.2 Financial Analysis
- 9.3.3 Segmental and Regional Analysis
- 9.3.4 Research & Development Expense
- 9.3.5 Recent strategies and developments:
- 9.3.5.1 Partnerships, Collaborations, and Agreements:
- 9.3.5.2 Product Launches and Product Expansions:
- 9.4 MediaTek, Inc.
- 9.4.1 Company Overview
- 9.4.2 Financial Analysis
- 9.4.3 Regional Analysis
- 9.4.4 Research & Development Expenses
- 9.4.5 Recent strategies and developments:
- 9.4.5.1 Partnerships, Collaborations, and Agreements:
- 9.4.5.2 Product Launches and Product Expansions:
- 9.5 Nokia Corporation
- 9.5.1 Company Overview
- 9.5.2 Financial Analysis
- 9.5.3 Segmental and Regional Analysis
- 9.5.4 Research & Development Expense
- 9.5.5 Recent strategies and developments:
- 9.5.5.1 Partnerships, Collaborations, and Agreements:
- 9.6 Verizon Communications, Inc.
- 9.6.1 Company Overview
- 9.6.2 Financial Analysis
- 9.6.3 Segmental Analysis
- 9.7 AT&T, Inc.
- 9.7.1 Company Overview
- 9.7.2 Financial Analysis
- 9.7.3 Segmental and Regional Analysis
- 9.7.4 Research & Development Expense
- 9.7.5 Recent strategies and developments:
- 9.7.5.1 Partnerships, Collaborations, and Agreements:
- 9.7.5.2 Product Launches and Product Expansions:
- 9.8 Vodafone Group Plc
- 9.8.1 Company Overview
- 9.8.2 Financial Analysis
- 9.8.3 Segmental Analysis
- 9.8.4 Recent strategies and developments:
- 9.8.4.1 Partnerships, Collaborations, and Agreements:
- 9.9 Orange S.A.
- 9.9.1 Company Overview
- 9.9.2 Financial Analysis
- 9.9.3 Segmental Analysis
- 9.9.4 SWOT Analysis
- 9.10. Ericsson AB
- 9.10.1 Company Overview
- 9.10.2 Financial Analysis
- 9.10.3 Segmental and Regional Analysis
- 9.10.4 Research & Development Expense
- 9.10.5 Recent strategies and developments:
- 9.10.5.1 Partnerships, Collaborations, and Agreements: