|
|
市場調査レポート
商品コード
1150576
バーチャルカードの世界市場規模、シェア、産業動向分析レポート製品タイプ別(B2B、B2C、C2B)、カードタイプ別(クレジット、デビット)、用途別(ビジネスユース、コンシューマーユース)、地域別展望と予測、2022年~2028年Global Virtual Cards Market Size, Share & Industry Trends Analysis Report By Product Type (B2B, B2C and C2B), By Card Type (Credit and Debit), By Application (Business Use and Consumer Use), By Regional Outlook and Forecast, 2022 - 2028 |
||||||
|
|
|||||||


| バーチャルカードの世界市場規模、シェア、産業動向分析レポート製品タイプ別(B2B、B2C、C2B)、カードタイプ別(クレジット、デビット)、用途別(ビジネスユース、コンシューマーユース)、地域別展望と予測、2022年~2028年 |
|
出版日: 2022年09月30日
発行: KBV Research
ページ情報: 英文 187 Pages
納期: 即納可能
|
- 全表示
- 概要
- 図表
- 目次
バーチャルカードの世界市場規模は、2028年までに375億米ドルに達し、予測期間中にCAGR19.1%の市場成長率で上昇すると予想されています。
バーチャルバンクの顧客にとって必要な手数料は通常はるかに少ないため、バーチャルカードはリアルカードよりも安価です。また、バーチャルバンクは、すべてをオンラインで管理するため、運営経費を抑えることができ、顧客に発行するバーチャルカードの手数料を引き下げることが可能です。また、実際のカードに比べ、セキュリティ面でも有利です。さらに、バーチャルカードでは、利用限度額を自分で設定できるため、貯蓄性を高めることができます。
このように、バーチャルカードは、ビジネス拡大の原動力となっています。スマートフォンを持ち去られると、バーチャルカードにアクセスできるユーザーのバーチャルカードが不正に利用される可能性があります。さらに、従来の決済よりもタッチレスな取引を好む顧客や、決済技術の急速な進歩により、今後数年間はバーチャルカードの有利な市場拡大が予測されています。
COVID-19の影響分析
COVID-19の大流行が市場拡大に大きく貢献しました。パンデミック後、非接触型決済手段の需要が増加し、バーチャルカード市場に新たな展望が開けつつあります。バーチャルカードは有形でないため、病気が蔓延する危険性がありません。そのため、COVID-19が大流行した当初は、バーチャルカード市場の成長の足かせとなっています。しかし、パンデミックの期間中は、市場の成長が飛躍的に加速しました。
市場成長要因
世界のオンライン決済の増加傾向
デジタル革命により、世界中で金融サービスへのアクセスと利用が拡大し、人々の送受金や借入、貯蓄の方法が変化しています。世界銀行によると、2017年には68%、2011年には51%だったのが、現在では世界中の成人の76%が銀行、他の金融機関、またはモバイルマネー・プロバイダーに口座を持っています。口座所有の拡大が、より多くの国で均等に行われたことは大きな意味があります。デジタル決済やオンライン決済の動向の高まりは、バーチャルカード市場の成長を後押しする大きな要因の一つです。
世界のデジタル化の進展
人類の歴史上、他のどの技術革新よりも早く、デジタル技術は文明を変革し、現在では発展途上国の人口のほぼ50%に到達しています。テクノロジーは、接続、金融包摂、商業へのアクセス、公共サービスを改善することで、巨大なイコライザーとなる可能性があります。例えば、AIを活用したフロンティアテクノロジーは、ヘルスケア産業において、病気の診断や治療、寿命の延長を支援しています。また、遠隔教育やバーチャルラーニングの導入により、従来ならプログラムから切り離されていた学生も参加できるようになりました。デジタル化の足場が世界中で強化されるにつれて、バーチャルカードの採用も推進されるでしょう。このような要因が、バーチャルカード市場の成長を加速させています。
市場抑制要因
バーチャルカードに関する知識・認知度の不足
顧客がオンラインで買い物をするときなど、カードを提示しない買い物の場合、バーチャル・クレジットカードが作られます。利用するサービスによっては、ベンダーに商品を返品することが困難な場合があります。小売業者の大半は、取引に使用されたのと同じカード番号を使用して顧客に返金することを希望しています。返金に代わる方法として、ストアクレジットがあります。ユーザーが予約のために仮想のカード番号を使用する場合、事態は複雑になる可能性があります。レンタカー事業者は、お客様がレンタカーを予約する際に、予約に使用した口座番号と支払いに使用したクレジットカードをリアルタイムで照合することを目的としています。このような課題が、バーチャルカード市場の成長を阻害しています。
カードタイプの展望
カードタイプによって、バーチャルカード市場はクレジットカードとデビットカードに二分されます。2021年、デビットカード部門はバーチャルカード市場で大きな収益シェアを獲得しました。世界中でネットバンキングの利用が拡大していることが、バーチャルデビットカードの需要を高め、同セグメントの成長を促進すると予想されます。例えば、グーグルは2022年5月、バーチャルカードとデジタルウォレットを含む2つの新しい決済の取り組みの創設を発表しました。この取り組みは、世界中の人々にセキュリティと利便性の向上を提供することを目的としています。
製品タイプの展望
製品タイプ別では、バーチャルカード市場は、B2Bバーチャルカード、B2Cリモート決済バーチャルカード、C2B POSバーチャルカードに区分されます。2021年のバーチャルカード市場では、B2Bバーチャルカードセグメントが最も高い収益シェアを示しています。B2B決済や企業間取引の需要は、世界の製品やサービスの輸出入の増加により高まっており、B2Bバーチャルカードの需要を促進すると予測されます。
アプリケーションの展望
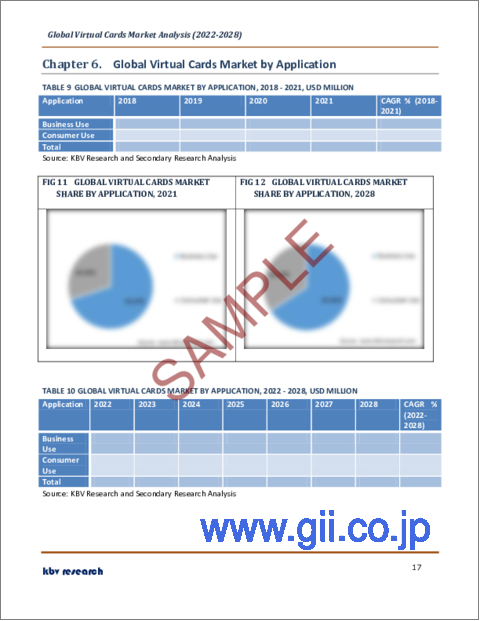
バーチャルカード市場は、アプリケーション別に、ビジネスユースとコンシューマーユースに分けられます。2021年、ビジネスユース分野は、バーチャルカード市場の最大の収益シェアを調達しました。バーチャルカードは、企業がサプライヤーやマーチャントへのオンライン決済に使用されます。従来のクレジットカードやデビットカードと異なり、紛失や盗難に遭うことがないため、安全性が高いです。
地域別の展望
地域別では、バーチャルカード市場は、北米、欧州、アジア太平洋、LAMEAで分析されています。2021年、欧州はバーチャルカード市場の最大の収益シェアを占めました。キャッシュレス取引への傾倒が高まっている英国、ドイツ、その他の欧州諸国が、この地域の産業拡大に拍車をかけると予測されます。さらに、多くの市場参加者が、消費者にバーチャルカードの導入を促すために、欧州市場で最先端のソリューションを導入しています。例えば、Stripeは欧州各国でStripe Issuingを導入しています。
市場参入企業がとっている主な戦略は、パートナーシップです。カーディナルマトリックスで提示された分析によると、JPMorgan Chase &Co.がバーチャルカード市場における主要な先駆者です。American Express Kabbage Inc.、Mastercard, Inc.、Marqeta Inc.などの企業は、バーチャルカード市場における主要な革新者です。
目次
第1章 市場の範囲と調査手法
- 市場の定義
- 目的
- 市場規模
- セグメンテーション
- バーチャルカードの世界市場、製品タイプ別
- バーチャルカードの世界市場、カードタイプ別
- バーチャルカードの世界市場、アプリケーション別
- バーチャルカードの世界市場、地域別
- 調査手法
第2章 市場概要
- イントロダクション
- 概要説明
- 市場の構成とシナリオ
- 概要説明
- 市場に影響を与える主な要因
- 市場促進要因
- 市場の抑制要因
第3章 競合分析-世界
- KBVカーディナルマトリックス
- 最近の業界全体の戦略的展開
- パートナーシップ、コラボレーション、契約
- 製品上市と製品拡張
- 買収と合併
- 地理的拡大
- 主要成功戦略
- 主要なリーディング戦略:割合の分布(2018-2022)
- 主要な戦略的動き:(パートナーシップ、コラボレーション&アグリーメント:2019年、10月~2022年、6月)主要なプレーヤーたち
第4章 バーチャルカードの世界市場。製品タイプ別
- B2Bの世界市場:地域別
- B2Cの世界市場:地域別
- C2Bの世界市場:地域別
第5章 バーチャルカードの世界市場:カードタイプ別
- クレジットの世界市場:地域別
- デビットの世界市場:地域別
第6章 バーチャルカードの世界市場:アプリケーション別
- ビジネスユースの世界市場:地域別
- コンシューマーユースの世界市場:地域別
第7章 バーチャルカードの世界市場地域別
- 北米
- 北米のバーチャルカード国別市場
- 米国
- カナダ
- メキシコ
- 北米以外の地域
- 北米のバーチャルカード国別市場
- 欧州
- 欧州バーチャルカード市場:国別
- ドイツ
- 英国
- フランス
- ロシア
- スペイン
- イタリア
- その他欧州
- 欧州バーチャルカード市場:国別
- アジア太平洋地域
- アジア太平洋地域のバーチャルカード市場:国別一覧
- 中国
- 日本
- インド
- 韓国
- シンガポール
- マレーシア
- その他アジア太平洋地域
- アジア太平洋地域のバーチャルカード市場:国別一覧
- LAMEA
- LAMEAバーチャルカード市場:国別
- ブラジル
- アルゼンチン
- UAE
- サウジアラビア
- 南アフリカ
- ナイジェリア
- LAMEAの残りの地域
- LAMEAバーチャルカード市場:国別
第8章 企業プロファイル
- Mastercard, Inc.
- American Express Kabbage Inc.(American Express Company)
- JPMorgan Chase & Co.(Wepay, Inc.)
- Stripe, Inc.
- Adyen N.V
- BTRS Holdings Inc.(Billtrust)
- Wise Payments Limited
- Marqeta, Inc.
- Skrill USA, Inc.(PaySafe Ltd.)
- WEX, Inc.
LIST OF TABLES
- TABLE 1 Global Virtual Cards Market, 2018 - 2021, USD Million
- TABLE 2 Global Virtual Cards Market, 2022 - 2028, USD Million
- TABLE 3 Partnerships, Collaborations and Agreements - Virtual Cards Market
- TABLE 4 Product Launches And Product Expansions - Virtual Cards Market
- TABLE 5 Acquisition and Mergers - Virtual Cards Market
- TABLE 6 Geographical Expansions - Virtual Cards Market
- TABLE 7 Global Virtual Cards Market by Product Type, 2018 - 2021, USD Million
- TABLE 8 Global Virtual Cards Market by Product Type, 2022 - 2028, USD Million
- TABLE 9 Global B2B Market by Region, 2018 - 2021, USD Million
- TABLE 10 Global B2B Market by Region, 2022 - 2028, USD Million
- TABLE 11 Global B2C Market by Region, 2018 - 2021, USD Million
- TABLE 12 Global B2C Market by Region, 2022 - 2028, USD Million
- TABLE 13 Global C2B Market by Region, 2018 - 2021, USD Million
- TABLE 14 Global C2B Market by Region, 2022 - 2028, USD Million
- TABLE 15 Global Virtual Cards Market by Card Type, 2018 - 2021, USD Million
- TABLE 16 Global Virtual Cards Market by Card Type, 2022 - 2028, USD Million
- TABLE 17 Global Credit Market by Region, 2018 - 2021, USD Million
- TABLE 18 Global Credit Market by Region, 2022 - 2028, USD Million
- TABLE 19 Global Debit Market by Region, 2018 - 2021, USD Million
- TABLE 20 Global Debit Market by Region, 2022 - 2028, USD Million
- TABLE 21 Global Virtual Cards Market by Application, 2018 - 2021, USD Million
- TABLE 22 Global Virtual Cards Market by Application, 2022 - 2028, USD Million
- TABLE 23 Global Business Use Market by Region, 2018 - 2021, USD Million
- TABLE 24 Global Business Use Market by Region, 2022 - 2028, USD Million
- TABLE 25 Global Consumer Use Market by Region, 2018 - 2021, USD Million
- TABLE 26 Global Consumer Use Market by Region, 2022 - 2028, USD Million
- TABLE 27 Global Virtual Cards Market by Region, 2018 - 2021, USD Million
- TABLE 28 Global Virtual Cards Market by Region, 2022 - 2028, USD Million
- TABLE 29 North America Virtual Cards Market, 2018 - 2021, USD Million
- TABLE 30 North America Virtual Cards Market, 2022 - 2028, USD Million
- TABLE 31 North America Virtual Cards Market by Product Type, 2018 - 2021, USD Million
- TABLE 32 North America Virtual Cards Market by Product Type, 2022 - 2028, USD Million
- TABLE 33 North America B2B Market by Country, 2018 - 2021, USD Million
- TABLE 34 North America B2B Market by Country, 2022 - 2028, USD Million
- TABLE 35 North America B2C Market by Country, 2018 - 2021, USD Million
- TABLE 36 North America B2C Market by Country, 2022 - 2028, USD Million
- TABLE 37 North America C2B Market by Country, 2018 - 2021, USD Million
- TABLE 38 North America C2B Market by Country, 2022 - 2028, USD Million
- TABLE 39 North America Virtual Cards Market by Card Type, 2018 - 2021, USD Million
- TABLE 40 North America Virtual Cards Market by Card Type, 2022 - 2028, USD Million
- TABLE 41 North America Credit Market by Country, 2018 - 2021, USD Million
- TABLE 42 North America Credit Market by Country, 2022 - 2028, USD Million
- TABLE 43 North America Debit Market by Country, 2018 - 2021, USD Million
- TABLE 44 North America Debit Market by Country, 2022 - 2028, USD Million
- TABLE 45 North America Virtual Cards Market by Application, 2018 - 2021, USD Million
- TABLE 46 North America Virtual Cards Market by Application, 2022 - 2028, USD Million
- TABLE 47 North America Business Use Market by Country, 2018 - 2021, USD Million
- TABLE 48 North America Business Use Market by Country, 2022 - 2028, USD Million
- TABLE 49 North America Consumer Use Market by Country, 2018 - 2021, USD Million
- TABLE 50 North America Consumer Use Market by Country, 2022 - 2028, USD Million
- TABLE 51 North America Virtual Cards Market by Country, 2018 - 2021, USD Million
- TABLE 52 North America Virtual Cards Market by Country, 2022 - 2028, USD Million
- TABLE 53 US Virtual Cards Market, 2018 - 2021, USD Million
- TABLE 54 US Virtual Cards Market, 2022 - 2028, USD Million
- TABLE 55 US Virtual Cards Market by Product Type, 2018 - 2021, USD Million
- TABLE 56 US Virtual Cards Market by Product Type, 2022 - 2028, USD Million
- TABLE 57 US Virtual Cards Market by Card Type, 2018 - 2021, USD Million
- TABLE 58 US Virtual Cards Market by Card Type, 2022 - 2028, USD Million
- TABLE 59 US Virtual Cards Market by Application, 2018 - 2021, USD Million
- TABLE 60 US Virtual Cards Market by Application, 2022 - 2028, USD Million
- TABLE 61 Canada Virtual Cards Market, 2018 - 2021, USD Million
- TABLE 62 Canada Virtual Cards Market, 2022 - 2028, USD Million
- TABLE 63 Canada Virtual Cards Market by Product Type, 2018 - 2021, USD Million
- TABLE 64 Canada Virtual Cards Market by Product Type, 2022 - 2028, USD Million
- TABLE 65 Canada Virtual Cards Market by Card Type, 2018 - 2021, USD Million
- TABLE 66 Canada Virtual Cards Market by Card Type, 2022 - 2028, USD Million
- TABLE 67 Canada Virtual Cards Market by Application, 2018 - 2021, USD Million
- TABLE 68 Canada Virtual Cards Market by Application, 2022 - 2028, USD Million
- TABLE 69 Mexico Virtual Cards Market, 2018 - 2021, USD Million
- TABLE 70 Mexico Virtual Cards Market, 2022 - 2028, USD Million
- TABLE 71 Mexico Virtual Cards Market by Product Type, 2018 - 2021, USD Million
- TABLE 72 Mexico Virtual Cards Market by Product Type, 2022 - 2028, USD Million
- TABLE 73 Mexico Virtual Cards Market by Card Type, 2018 - 2021, USD Million
- TABLE 74 Mexico Virtual Cards Market by Card Type, 2022 - 2028, USD Million
- TABLE 75 Mexico Virtual Cards Market by Application, 2018 - 2021, USD Million
- TABLE 76 Mexico Virtual Cards Market by Application, 2022 - 2028, USD Million
- TABLE 77 Rest of North America Virtual Cards Market, 2018 - 2021, USD Million
- TABLE 78 Rest of North America Virtual Cards Market, 2022 - 2028, USD Million
- TABLE 79 Rest of North America Virtual Cards Market by Product Type, 2018 - 2021, USD Million
- TABLE 80 Rest of North America Virtual Cards Market by Product Type, 2022 - 2028, USD Million
- TABLE 81 Rest of North America Virtual Cards Market by Card Type, 2018 - 2021, USD Million
- TABLE 82 Rest of North America Virtual Cards Market by Card Type, 2022 - 2028, USD Million
- TABLE 83 Rest of North America Virtual Cards Market by Application, 2018 - 2021, USD Million
- TABLE 84 Rest of North America Virtual Cards Market by Application, 2022 - 2028, USD Million
- TABLE 85 Europe Virtual Cards Market, 2018 - 2021, USD Million
- TABLE 86 Europe Virtual Cards Market, 2022 - 2028, USD Million
- TABLE 87 Europe Virtual Cards Market by Product Type, 2018 - 2021, USD Million
- TABLE 88 Europe Virtual Cards Market by Product Type, 2022 - 2028, USD Million
- TABLE 89 Europe B2B Market by Country, 2018 - 2021, USD Million
- TABLE 90 Europe B2B Market by Country, 2022 - 2028, USD Million
- TABLE 91 Europe B2C Market by Country, 2018 - 2021, USD Million
- TABLE 92 Europe B2C Market by Country, 2022 - 2028, USD Million
- TABLE 93 Europe C2B Market by Country, 2018 - 2021, USD Million
- TABLE 94 Europe C2B Market by Country, 2022 - 2028, USD Million
- TABLE 95 Europe Virtual Cards Market by Card Type, 2018 - 2021, USD Million
- TABLE 96 Europe Virtual Cards Market by Card Type, 2022 - 2028, USD Million
- TABLE 97 Europe Credit Market by Country, 2018 - 2021, USD Million
- TABLE 98 Europe Credit Market by Country, 2022 - 2028, USD Million
- TABLE 99 Europe Debit Market by Country, 2018 - 2021, USD Million
- TABLE 100 Europe Debit Market by Country, 2022 - 2028, USD Million
- TABLE 101 Europe Virtual Cards Market by Application, 2018 - 2021, USD Million
- TABLE 102 Europe Virtual Cards Market by Application, 2022 - 2028, USD Million
- TABLE 103 Europe Business Use Market by Country, 2018 - 2021, USD Million
- TABLE 104 Europe Business Use Market by Country, 2022 - 2028, USD Million
- TABLE 105 Europe Consumer Use Market by Country, 2018 - 2021, USD Million
- TABLE 106 Europe Consumer Use Market by Country, 2022 - 2028, USD Million
- TABLE 107 Europe Virtual Cards Market by Country, 2018 - 2021, USD Million
- TABLE 108 Europe Virtual Cards Market by Country, 2022 - 2028, USD Million
- TABLE 109 Germany Virtual Cards Market, 2018 - 2021, USD Million
- TABLE 110 Germany Virtual Cards Market, 2022 - 2028, USD Million
- TABLE 111 Germany Virtual Cards Market by Product Type, 2018 - 2021, USD Million
- TABLE 112 Germany Virtual Cards Market by Product Type, 2022 - 2028, USD Million
- TABLE 113 Germany Virtual Cards Market by Card Type, 2018 - 2021, USD Million
- TABLE 114 Germany Virtual Cards Market by Card Type, 2022 - 2028, USD Million
- TABLE 115 Germany Virtual Cards Market by Application, 2018 - 2021, USD Million
- TABLE 116 Germany Virtual Cards Market by Application, 2022 - 2028, USD Million
- TABLE 117 UK Virtual Cards Market, 2018 - 2021, USD Million
- TABLE 118 UK Virtual Cards Market, 2022 - 2028, USD Million
- TABLE 119 UK Virtual Cards Market by Product Type, 2018 - 2021, USD Million
- TABLE 120 UK Virtual Cards Market by Product Type, 2022 - 2028, USD Million
- TABLE 121 UK Virtual Cards Market by Card Type, 2018 - 2021, USD Million
- TABLE 122 UK Virtual Cards Market by Card Type, 2022 - 2028, USD Million
- TABLE 123 UK Virtual Cards Market by Application, 2018 - 2021, USD Million
- TABLE 124 UK Virtual Cards Market by Application, 2022 - 2028, USD Million
- TABLE 125 France Virtual Cards Market, 2018 - 2021, USD Million
- TABLE 126 France Virtual Cards Market, 2022 - 2028, USD Million
- TABLE 127 France Virtual Cards Market by Product Type, 2018 - 2021, USD Million
- TABLE 128 France Virtual Cards Market by Product Type, 2022 - 2028, USD Million
- TABLE 129 France Virtual Cards Market by Card Type, 2018 - 2021, USD Million
- TABLE 130 France Virtual Cards Market by Card Type, 2022 - 2028, USD Million
- TABLE 131 France Virtual Cards Market by Application, 2018 - 2021, USD Million
- TABLE 132 France Virtual Cards Market by Application, 2022 - 2028, USD Million
- TABLE 133 Russia Virtual Cards Market, 2018 - 2021, USD Million
- TABLE 134 Russia Virtual Cards Market, 2022 - 2028, USD Million
- TABLE 135 Russia Virtual Cards Market by Product Type, 2018 - 2021, USD Million
- TABLE 136 Russia Virtual Cards Market by Product Type, 2022 - 2028, USD Million
- TABLE 137 Russia Virtual Cards Market by Card Type, 2018 - 2021, USD Million
- TABLE 138 Russia Virtual Cards Market by Card Type, 2022 - 2028, USD Million
- TABLE 139 Russia Virtual Cards Market by Application, 2018 - 2021, USD Million
- TABLE 140 Russia Virtual Cards Market by Application, 2022 - 2028, USD Million
- TABLE 141 Spain Virtual Cards Market, 2018 - 2021, USD Million
- TABLE 142 Spain Virtual Cards Market, 2022 - 2028, USD Million
- TABLE 143 Spain Virtual Cards Market by Product Type, 2018 - 2021, USD Million
- TABLE 144 Spain Virtual Cards Market by Product Type, 2022 - 2028, USD Million
- TABLE 145 Spain Virtual Cards Market by Card Type, 2018 - 2021, USD Million
- TABLE 146 Spain Virtual Cards Market by Card Type, 2022 - 2028, USD Million
- TABLE 147 Spain Virtual Cards Market by Application, 2018 - 2021, USD Million
- TABLE 148 Spain Virtual Cards Market by Application, 2022 - 2028, USD Million
- TABLE 149 Italy Virtual Cards Market, 2018 - 2021, USD Million
- TABLE 150 Italy Virtual Cards Market, 2022 - 2028, USD Million
- TABLE 151 Italy Virtual Cards Market by Product Type, 2018 - 2021, USD Million
- TABLE 152 Italy Virtual Cards Market by Product Type, 2022 - 2028, USD Million
- TABLE 153 Italy Virtual Cards Market by Card Type, 2018 - 2021, USD Million
- TABLE 154 Italy Virtual Cards Market by Card Type, 2022 - 2028, USD Million
- TABLE 155 Italy Virtual Cards Market by Application, 2018 - 2021, USD Million
- TABLE 156 Italy Virtual Cards Market by Application, 2022 - 2028, USD Million
- TABLE 157 Rest of Europe Virtual Cards Market, 2018 - 2021, USD Million
- TABLE 158 Rest of Europe Virtual Cards Market, 2022 - 2028, USD Million
- TABLE 159 Rest of Europe Virtual Cards Market by Product Type, 2018 - 2021, USD Million
- TABLE 160 Rest of Europe Virtual Cards Market by Product Type, 2022 - 2028, USD Million
- TABLE 161 Rest of Europe Virtual Cards Market by Card Type, 2018 - 2021, USD Million
- TABLE 162 Rest of Europe Virtual Cards Market by Card Type, 2022 - 2028, USD Million
- TABLE 163 Rest of Europe Virtual Cards Market by Application, 2018 - 2021, USD Million
- TABLE 164 Rest of Europe Virtual Cards Market by Application, 2022 - 2028, USD Million
- TABLE 165 Asia Pacific Virtual Cards Market, 2018 - 2021, USD Million
- TABLE 166 Asia Pacific Virtual Cards Market, 2022 - 2028, USD Million
- TABLE 167 Asia Pacific Virtual Cards Market by Product Type, 2018 - 2021, USD Million
- TABLE 168 Asia Pacific Virtual Cards Market by Product Type, 2022 - 2028, USD Million
- TABLE 169 Asia Pacific B2B Market by Country, 2018 - 2021, USD Million
- TABLE 170 Asia Pacific B2B Market by Country, 2022 - 2028, USD Million
- TABLE 171 Asia Pacific B2C Market by Country, 2018 - 2021, USD Million
- TABLE 172 Asia Pacific B2C Market by Country, 2022 - 2028, USD Million
- TABLE 173 Asia Pacific C2B Market by Country, 2018 - 2021, USD Million
- TABLE 174 Asia Pacific C2B Market by Country, 2022 - 2028, USD Million
- TABLE 175 Asia Pacific Virtual Cards Market by Card Type, 2018 - 2021, USD Million
- TABLE 176 Asia Pacific Virtual Cards Market by Card Type, 2022 - 2028, USD Million
- TABLE 177 Asia Pacific Credit Market by Country, 2018 - 2021, USD Million
- TABLE 178 Asia Pacific Credit Market by Country, 2022 - 2028, USD Million
- TABLE 179 Asia Pacific Debit Market by Country, 2018 - 2021, USD Million
- TABLE 180 Asia Pacific Debit Market by Country, 2022 - 2028, USD Million
- TABLE 181 Asia Pacific Virtual Cards Market by Application, 2018 - 2021, USD Million
- TABLE 182 Asia Pacific Virtual Cards Market by Application, 2022 - 2028, USD Million
- TABLE 183 Asia Pacific Business Use Market by Country, 2018 - 2021, USD Million
- TABLE 184 Asia Pacific Business Use Market by Country, 2022 - 2028, USD Million
- TABLE 185 Asia Pacific Consumer Use Market by Country, 2018 - 2021, USD Million
- TABLE 186 Asia Pacific Consumer Use Market by Country, 2022 - 2028, USD Million
- TABLE 187 Asia Pacific Virtual Cards Market by Country, 2018 - 2021, USD Million
- TABLE 188 Asia Pacific Virtual Cards Market by Country, 2022 - 2028, USD Million
- TABLE 189 China Virtual Cards Market, 2018 - 2021, USD Million
- TABLE 190 China Virtual Cards Market, 2022 - 2028, USD Million
- TABLE 191 China Virtual Cards Market by Product Type, 2018 - 2021, USD Million
- TABLE 192 China Virtual Cards Market by Product Type, 2022 - 2028, USD Million
- TABLE 193 China Virtual Cards Market by Card Type, 2018 - 2021, USD Million
- TABLE 194 China Virtual Cards Market by Card Type, 2022 - 2028, USD Million
- TABLE 195 China Virtual Cards Market by Application, 2018 - 2021, USD Million
- TABLE 196 China Virtual Cards Market by Application, 2022 - 2028, USD Million
- TABLE 197 Japan Virtual Cards Market, 2018 - 2021, USD Million
- TABLE 198 Japan Virtual Cards Market, 2022 - 2028, USD Million
- TABLE 199 Japan Virtual Cards Market by Product Type, 2018 - 2021, USD Million
- TABLE 200 Japan Virtual Cards Market by Product Type, 2022 - 2028, USD Million
- TABLE 201 Japan Virtual Cards Market by Card Type, 2018 - 2021, USD Million
- TABLE 202 Japan Virtual Cards Market by Card Type, 2022 - 2028, USD Million
- TABLE 203 Japan Virtual Cards Market by Application, 2018 - 2021, USD Million
- TABLE 204 Japan Virtual Cards Market by Application, 2022 - 2028, USD Million
- TABLE 205 India Virtual Cards Market, 2018 - 2021, USD Million
- TABLE 206 India Virtual Cards Market, 2022 - 2028, USD Million
- TABLE 207 India Virtual Cards Market by Product Type, 2018 - 2021, USD Million
- TABLE 208 India Virtual Cards Market by Product Type, 2022 - 2028, USD Million
- TABLE 209 India Virtual Cards Market by Card Type, 2018 - 2021, USD Million
- TABLE 210 India Virtual Cards Market by Card Type, 2022 - 2028, USD Million
- TABLE 211 India Virtual Cards Market by Application, 2018 - 2021, USD Million
- TABLE 212 India Virtual Cards Market by Application, 2022 - 2028, USD Million
- TABLE 213 South Korea Virtual Cards Market, 2018 - 2021, USD Million
- TABLE 214 South Korea Virtual Cards Market, 2022 - 2028, USD Million
- TABLE 215 South Korea Virtual Cards Market by Product Type, 2018 - 2021, USD Million
- TABLE 216 South Korea Virtual Cards Market by Product Type, 2022 - 2028, USD Million
- TABLE 217 South Korea Virtual Cards Market by Card Type, 2018 - 2021, USD Million
- TABLE 218 South Korea Virtual Cards Market by Card Type, 2022 - 2028, USD Million
- TABLE 219 South Korea Virtual Cards Market by Application, 2018 - 2021, USD Million
- TABLE 220 South Korea Virtual Cards Market by Application, 2022 - 2028, USD Million
- TABLE 221 Singapore Virtual Cards Market, 2018 - 2021, USD Million
- TABLE 222 Singapore Virtual Cards Market, 2022 - 2028, USD Million
- TABLE 223 Singapore Virtual Cards Market by Product Type, 2018 - 2021, USD Million
- TABLE 224 Singapore Virtual Cards Market by Product Type, 2022 - 2028, USD Million
- TABLE 225 Singapore Virtual Cards Market by Card Type, 2018 - 2021, USD Million
- TABLE 226 Singapore Virtual Cards Market by Card Type, 2022 - 2028, USD Million
- TABLE 227 Singapore Virtual Cards Market by Application, 2018 - 2021, USD Million
- TABLE 228 Singapore Virtual Cards Market by Application, 2022 - 2028, USD Million
- TABLE 229 Malaysia Virtual Cards Market, 2018 - 2021, USD Million
- TABLE 230 Malaysia Virtual Cards Market, 2022 - 2028, USD Million
- TABLE 231 Malaysia Virtual Cards Market by Product Type, 2018 - 2021, USD Million
- TABLE 232 Malaysia Virtual Cards Market by Product Type, 2022 - 2028, USD Million
- TABLE 233 Malaysia Virtual Cards Market by Card Type, 2018 - 2021, USD Million
- TABLE 234 Malaysia Virtual Cards Market by Card Type, 2022 - 2028, USD Million
- TABLE 235 Malaysia Virtual Cards Market by Application, 2018 - 2021, USD Million
- TABLE 236 Malaysia Virtual Cards Market by Application, 2022 - 2028, USD Million
- TABLE 237 Rest of Asia Pacific Virtual Cards Market, 2018 - 2021, USD Million
- TABLE 238 Rest of Asia Pacific Virtual Cards Market, 2022 - 2028, USD Million
- TABLE 239 Rest of Asia Pacific Virtual Cards Market by Product Type, 2018 - 2021, USD Million
- TABLE 240 Rest of Asia Pacific Virtual Cards Market by Product Type, 2022 - 2028, USD Million
- TABLE 241 Rest of Asia Pacific Virtual Cards Market by Card Type, 2018 - 2021, USD Million
- TABLE 242 Rest of Asia Pacific Virtual Cards Market by Card Type, 2022 - 2028, USD Million
- TABLE 243 Rest of Asia Pacific Virtual Cards Market by Application, 2018 - 2021, USD Million
- TABLE 244 Rest of Asia Pacific Virtual Cards Market by Application, 2022 - 2028, USD Million
- TABLE 245 LAMEA Virtual Cards Market, 2018 - 2021, USD Million
- TABLE 246 LAMEA Virtual Cards Market, 2022 - 2028, USD Million
- TABLE 247 LAMEA Virtual Cards Market by Product Type, 2018 - 2021, USD Million
- TABLE 248 LAMEA Virtual Cards Market by Product Type, 2022 - 2028, USD Million
- TABLE 249 LAMEA B2B Market by Country, 2018 - 2021, USD Million
- TABLE 250 LAMEA B2B Market by Country, 2022 - 2028, USD Million
- TABLE 251 LAMEA B2C Market by Country, 2018 - 2021, USD Million
- TABLE 252 LAMEA B2C Market by Country, 2022 - 2028, USD Million
- TABLE 253 LAMEA C2B Market by Country, 2018 - 2021, USD Million
- TABLE 254 LAMEA C2B Market by Country, 2022 - 2028, USD Million
- TABLE 255 LAMEA Virtual Cards Market by Card Type, 2018 - 2021, USD Million
- TABLE 256 LAMEA Virtual Cards Market by Card Type, 2022 - 2028, USD Million
- TABLE 257 LAMEA Credit Market by Country, 2018 - 2021, USD Million
- TABLE 258 LAMEA Credit Market by Country, 2022 - 2028, USD Million
- TABLE 259 LAMEA Debit Market by Country, 2018 - 2021, USD Million
- TABLE 260 LAMEA Debit Market by Country, 2022 - 2028, USD Million
- TABLE 261 LAMEA Virtual Cards Market by Application, 2018 - 2021, USD Million
- TABLE 262 LAMEA Virtual Cards Market by Application, 2022 - 2028, USD Million
- TABLE 263 LAMEA Business Use Market by Country, 2018 - 2021, USD Million
- TABLE 264 LAMEA Business Use Market by Country, 2022 - 2028, USD Million
- TABLE 265 LAMEA Consumer Use Market by Country, 2018 - 2021, USD Million
- TABLE 266 LAMEA Consumer Use Market by Country, 2022 - 2028, USD Million
- TABLE 267 LAMEA Virtual Cards Market by Country, 2018 - 2021, USD Million
- TABLE 268 LAMEA Virtual Cards Market by Country, 2022 - 2028, USD Million
- TABLE 269 Brazil Virtual Cards Market, 2018 - 2021, USD Million
- TABLE 270 Brazil Virtual Cards Market, 2022 - 2028, USD Million
- TABLE 271 Brazil Virtual Cards Market by Product Type, 2018 - 2021, USD Million
- TABLE 272 Brazil Virtual Cards Market by Product Type, 2022 - 2028, USD Million
- TABLE 273 Brazil Virtual Cards Market by Card Type, 2018 - 2021, USD Million
- TABLE 274 Brazil Virtual Cards Market by Card Type, 2022 - 2028, USD Million
- TABLE 275 Brazil Virtual Cards Market by Application, 2018 - 2021, USD Million
- TABLE 276 Brazil Virtual Cards Market by Application, 2022 - 2028, USD Million
- TABLE 277 Argentina Virtual Cards Market, 2018 - 2021, USD Million
- TABLE 278 Argentina Virtual Cards Market, 2022 - 2028, USD Million
- TABLE 279 Argentina Virtual Cards Market by Product Type, 2018 - 2021, USD Million
- TABLE 280 Argentina Virtual Cards Market by Product Type, 2022 - 2028, USD Million
- TABLE 281 Argentina Virtual Cards Market by Card Type, 2018 - 2021, USD Million
- TABLE 282 Argentina Virtual Cards Market by Card Type, 2022 - 2028, USD Million
- TABLE 283 Argentina Virtual Cards Market by Application, 2018 - 2021, USD Million
- TABLE 284 Argentina Virtual Cards Market by Application, 2022 - 2028, USD Million
- TABLE 285 UAE Virtual Cards Market, 2018 - 2021, USD Million
- TABLE 286 UAE Virtual Cards Market, 2022 - 2028, USD Million
- TABLE 287 UAE Virtual Cards Market by Product Type, 2018 - 2021, USD Million
- TABLE 288 UAE Virtual Cards Market by Product Type, 2022 - 2028, USD Million
- TABLE 289 UAE Virtual Cards Market by Card Type, 2018 - 2021, USD Million
- TABLE 290 UAE Virtual Cards Market by Card Type, 2022 - 2028, USD Million
- TABLE 291 UAE Virtual Cards Market by Application, 2018 - 2021, USD Million
- TABLE 292 UAE Virtual Cards Market by Application, 2022 - 2028, USD Million
- TABLE 293 Saudi Arabia Virtual Cards Market, 2018 - 2021, USD Million
- TABLE 294 Saudi Arabia Virtual Cards Market, 2022 - 2028, USD Million
- TABLE 295 Saudi Arabia Virtual Cards Market by Product Type, 2018 - 2021, USD Million
- TABLE 296 Saudi Arabia Virtual Cards Market by Product Type, 2022 - 2028, USD Million
- TABLE 297 Saudi Arabia Virtual Cards Market by Card Type, 2018 - 2021, USD Million
- TABLE 298 Saudi Arabia Virtual Cards Market by Card Type, 2022 - 2028, USD Million
- TABLE 299 Saudi Arabia Virtual Cards Market by Application, 2018 - 2021, USD Million
- TABLE 300 Saudi Arabia Virtual Cards Market by Application, 2022 - 2028, USD Million
- TABLE 301 South Africa Virtual Cards Market, 2018 - 2021, USD Million
- TABLE 302 South Africa Virtual Cards Market, 2022 - 2028, USD Million
- TABLE 303 South Africa Virtual Cards Market by Product Type, 2018 - 2021, USD Million
- TABLE 304 South Africa Virtual Cards Market by Product Type, 2022 - 2028, USD Million
- TABLE 305 South Africa Virtual Cards Market by Card Type, 2018 - 2021, USD Million
- TABLE 306 South Africa Virtual Cards Market by Card Type, 2022 - 2028, USD Million
- TABLE 307 South Africa Virtual Cards Market by Application, 2018 - 2021, USD Million
- TABLE 308 South Africa Virtual Cards Market by Application, 2022 - 2028, USD Million
- TABLE 309 Nigeria Virtual Cards Market, 2018 - 2021, USD Million
- TABLE 310 Nigeria Virtual Cards Market, 2022 - 2028, USD Million
- TABLE 311 Nigeria Virtual Cards Market by Product Type, 2018 - 2021, USD Million
- TABLE 312 Nigeria Virtual Cards Market by Product Type, 2022 - 2028, USD Million
- TABLE 313 Nigeria Virtual Cards Market by Card Type, 2018 - 2021, USD Million
- TABLE 314 Nigeria Virtual Cards Market by Card Type, 2022 - 2028, USD Million
- TABLE 315 Nigeria Virtual Cards Market by Application, 2018 - 2021, USD Million
- TABLE 316 Nigeria Virtual Cards Market by Application, 2022 - 2028, USD Million
- TABLE 317 Rest of LAMEA Virtual Cards Market, 2018 - 2021, USD Million
- TABLE 318 Rest of LAMEA Virtual Cards Market, 2022 - 2028, USD Million
- TABLE 319 Rest of LAMEA Virtual Cards Market by Product Type, 2018 - 2021, USD Million
- TABLE 320 Rest of LAMEA Virtual Cards Market by Product Type, 2022 - 2028, USD Million
- TABLE 321 Rest of LAMEA Virtual Cards Market by Card Type, 2018 - 2021, USD Million
- TABLE 322 Rest of LAMEA Virtual Cards Market by Card Type, 2022 - 2028, USD Million
- TABLE 323 Rest of LAMEA Virtual Cards Market by Application, 2018 - 2021, USD Million
- TABLE 324 Rest of LAMEA Virtual Cards Market by Application, 2022 - 2028, USD Million
- TABLE 325 key Information - Mastercard, Inc.
- TABLE 326 Key Information - American Express Kabbage Inc.
- TABLE 327 key information - JPMorgan Chase & Co.
- TABLE 328 Key information - Stripe, inc.
- TABLE 329 Key Information - Adyen N.V.
- TABLE 330 Key Information - BTRS Holdings Inc.
- TABLE 331 Key Information - Wise Payments Limited
- TABLE 332 Key Information - Marqeta, Inc.
- TABLE 333 Key Information - Skrill Usa, Inc.
- TABLE 334 Key Information - WEX, Inc.
List of Figures
- FIG 1 Methodology for the research
- FIG 2 KBV Cardinal Matrix
- FIG 3 Key Leading Strategies: Percentage Distribution (2018-2022)
- FIG 4 Key Strategic Move: (Partnerships, Collaborations & Agreements: 2019, Oct - 2022, Jun) Leading Players
- FIG 5 Global Virtual Cards Market Share by Product Type, 2021
- FIG 6 Global Virtual Cards Market Share by Product Type, 2028
- FIG 7 Global Virtual Cards Market by Product Type, 2018 - 2028, USD Million
- FIG 8 Global Virtual Cards Market Share by Card Type, 2021
- FIG 9 Global Virtual Cards Market Share by Card Type, 2028
- FIG 10 Global Virtual Cards Market by Card Type, 2018 - 2028, USD Million
- FIG 11 Global Virtual Cards Market Share by Application, 2021
- FIG 12 Global Virtual Cards Market Share by Application, 2028
- FIG 13 Global Virtual Cards Market by Application, 2018 - 2028, USD Million
- FIG 14 Global Virtual Cards Market Share by Region, 2021
- FIG 15 Global Virtual Cards Market Share by Region, 2028
- FIG 16 Global Virtual Cards Market by Region, 2018 - 2028, USD Million
- FIG 17 Recent strategies and developments: Mastercard, Inc.
- FIG 18 Recent strategies and developments: JPMorgan Chase & Co.
- FIG 19 Recent strategies and developments: Stripe, Inc.
- FIG 20 Recent strategies and developments: Wex, Inc.
The Global Virtual Cards Market size is expected to reach $37.5 billion by 2028, rising at a market growth of 19.1% CAGR during the forecast period.
For use with mobile ordering and electronic transactions, a virtual card is a type of digital payment system that serves as a token. A process known as tokenization creates credentials automatically, and cards have built-in financial restrictions to finance them for either single-use or multipurpose transactions. A virtual card enables secure online transactions because it lowers the possibility of disclosing to the merchant the actual credit/debit card information. There is very little likelihood of cloning or fraud because they are only visible to the user.
Additionally, each virtual card is only intended for one use. It is made specifically for a single online transaction and is only good for 48 hours. Depending on the bank, the credit validity and limit term may change. By entering one's debit or credit card information online through the bank's net banking service, a virtual credit card can be generated. There are no fees associated with this process and service. They need not be issued physically by card issuers, as the name implies.
Since there are typically far fewer fees necessary for customers of virtual banks, virtual cards are less expensive than real cards. Additionally, since everything is managed online, the virtual bank may lower operating expenses, which allows them to lower the fees for the virtual cards they issue to their clients. In addition, compared to actual cards, virtual cards give their users additional security advantages. Additionally, users can customize their own spending caps on a virtual card, which enables them to increase their savings.
These are thus a few of the driving forces behind the expansion of the virtual cards business. If the smartphone is taken, there is a potential that the user's virtual card, which has access to the virtual card, can be used fraudulently. Furthermore, customer preferences for touchless transactions over traditional payments and the rapid advancement of payment technology are predicted to lead to lucrative market expansion for virtual cards in the coming years.
COVID-19 Impact Analysis
The COVID-19 pandemic significantly contributed to the market's expansion. After the pandemic, there has been an increase in the demand for contactless payment methods, which is opening up new prospects for the market for virtual cards. The risk of a virtual card potentially spreading illnesses is eliminated because it is not a tangible item. Therefore, the COVID-19 pandemic steadily hampered the growth of the virtual cards market during the initial period of the pandemic. However, the growth of the market expedited exponentially during the pandemic.
Market Growth Factors
Rising trend of online payments all over the world
The digital revolution has increased access to and utilization of financial services all over the world, changing how people send and receive payments, borrow money, and save money. According to the World Bank, from 68% in 2017 and 51% in 2011, 76% of adults across the world now have an account with a bank, another financial institution, or a mobile money provider. It's significant that the expansion of account ownership was evenly divided among many more nations. The increase in the trend of digital or online payments is one of the major factors that is propelling the growth of the virtual card market.
Widespread digitalization across the world
More quickly than any other innovation in human history, digital technologies have transformed civilizations and have now reached almost 50% of the population in developing countries. Technology may be a huge equalizer by improving connection, financial inclusion, access to commerce, and public services. AI-enabled frontier technologies, for instance, are assisting in the diagnosis and treatment of diseases as well as the extension of life span in the healthcare industry. Distance learning and virtual learning settings have allowed students who would otherwise be cut off from programs to participate. As the foothold of digitalization strengthens all over the world, the adoption of virtual cards would also propel. Hence, this factor is accelerating the growth of the virtual card market.
Market Restraining Factors
Lack of knowledge and awareness about virtual cards
For card-not-present purchases, such as when customers shop online, virtual credit cards are made. Returning an item to the vendor may be challenging depending on the service they use. The majority of retailers prefer to pay customers back using the same card number that has been used to complete the transaction. An alternative to a refund can be store credit. When users employ a virtual card number to hold a reservation, things can get complicated. The rental business would aim to match the account number that is used to make the reservation with the credit card that is being used for payment in real-time when the customer makes a reservation for a rental automobile. Therefore, these challenges are majorly hampering the growth of the virtual card market.
Card Type Outlook
Based on Card Type, the Virtual Cards Market is bifurcated into Credit Card and Debit Card. In 2021, the debit card segment garnered a significant revenue share of the virtual cards market. Growing net banking usage around the world is anticipated to fuel the demand for virtual debit cards, which would drive the segment's growth. For instance, Google announced the creation of two new payment efforts in May 2022, including virtual cards and digital wallets. This initiative aims to provide people all over the world with improved security and convenience.
Product Type Outlook
By the Product Type, the Virtual Cards Market is segmented into B2B Virtual Cards, B2C Remote Payment Virtual Cards, and C2B POS Virtual Cards. In 2021, the B2B virtual cards segment witnessed the highest revenue share of the virtual cards market. The demand for B2B payments and transactions between businesses has risen as a result of the growing export and import of products and services across the world, which is anticipated to drive the demand for B2B virtual cards.
Application Outlook
On the basis of Application, the Virtual Cards Market is divided into Business Use and Consumer Use. In 2021, the business use segment procured the biggest revenue share of the virtual cards market. Virtual cards are used by businesses to make online payments to suppliers and merchants. Because they cannot be lost or stolen, unlike conventional credit and debit cards, these cards offer improved safety.
Regional Outlook
Region-Wise, the Virtual Cards Market is analyzed across North America, Europe, Asia-Pacific, and LAMEA. In 2021, Europe accounted for the largest revenue share of the virtual cards market. The UK, Germany, and other European nations with a rising inclination for cashless transactions are projected to fuel the expansion of the regional industry. Additionally, a number of market players are introducing cutting-edge solutions in the European market to entice consumers to adopt virtual cards. For instance, Stripe introduced Stripe Issuing in European countries
The major strategies followed by the market participants are Partnerships. Based on the Analysis presented in the Cardinal matrix; JPMorgan Chase & Co. is the major forerunner in the Virtual Cards Market. Companies such as American Express Kabbage Inc., Mastercard, Inc., Marqeta Inc. are some of the key innovators in Virtual Cards Market.
The market research report covers the analysis of key stake holders of the market. Key companies profiled in the report include Mastercard, Inc., American Express Kabbage Inc., JPMorgan Chase & Co., Stripe, Inc., Adyen N.V., BTRS Holdings Inc., Wise Payments Limited, Marqeta Inc., Skrill USA, Inc., and Wex, Inc.
Recent Strategies deployed in Virtual Cards Market
Partnerships, Collaborations and Agreements:
Jun-2022: Marqeta joined hands with Western Union, a leading fintech. Under this collaboration, Marqeta would integrate its solutions into the next-generation real-time multi-currency digital wallet and digital banking platform of Marqeta across Europe to offer the entire remittance service of Western Union online.
June-2022: Marqeta partnered with Klarna, a Swedish fintech company. Following this partnership, Marqeta would support the Klarna Card in order to bring the Pay in 4 services of the company to a physical Visa card with the aim to allow consumers to pay over time in four equal interest-free payments for any online or in-store purchase.
Apr-2022: American Express collaborated with Billtrust, a B2B accounts receivable automation and integrated payments company. Through this collaboration, the companies aimed to allow providers to accelerate the adoption of American Express virtual cards. Moreover, this collaboration would also enable suppliers to accelerate and automate virtual card payments.
Apr-2022: TransferWise partnered with Max, a fintech company. Through this partnership, the companies aimed to launch the Wise Platform throughout Israel, which would enable customers to send money abroad in 32 currencies along with complete transparency on fees.
Mar-2022: Marqeta entered into a partnership with Citi, an American multinational investment bank and financial services corporation. Under this partnership, Marqeta would offer its tokenization-as-a-service capabilities to Citi in order to streamline card provisioning into mobile wallets to allow Citi's cardholder base to transform their plastic cards into virtual cards.
Mar-2022: Mastercard partnered with Zeta, a Banking tech and credit card provider. Through this partnership, the companies aimed to offer modern credit card processing capabilities to fintech innovators and issuing banks at scale to optimize the security, safety, and convenience of e-commerce.
Nov-2021: Marqeta came into a partnership with Mastercard and Paycast. Through this partnership, the companies aimed to empower and unveil a digital card product in order to provide a more convenient as well as faster approach for sellers to receive payments.
Oct-2021: Marqeta entered into a partnership with Amount, a technology leader. With this partnership, the companies aimed to aid banks in rapidly leveraging the buy now, pay later space with the aim to alleviate the digital tools gap.
Sep-2021: American Express came into a partnership with Extend, a fintech specializing in virtual cards. This partnership aimed to expand virtual Card solutions for businesses throughout the US by providing them an eligible American Express Business Card in order to create tokens via the desktop and app of Extend.
Aug-2021: Stripe came into a partnership[ with UnionPay International, a subsidiary of China UnionPay. This partnership aimed to allow businesses throughout more than 30 countries in order to seamlessly and securely accept payments from a number of UnionPay cardholders.
Jul-2020: JP Morgan came into a partnership with Marqeta, a payment start-up. With this partnership, the companies aimed to release virtual credit cards for their commercial card clients. Furthermore, Marqeta would integrate its unique card tokenization capabilities into the virtual card program to facilitate payments.
Acquisition & Mergers:
Jan-2022: JP Morgan took over Viva Wallet, a leader in European cloud-based payments. Following this acquisition, the company aimed to expedite its growth with the addition of the large customer base of Viva Wallet.
Oct-2021: Stripe took over Recko, a provider of payments reconciliation software. Through this acquisition, the company aimed to expand its portfolio throughout India.
May-2021: Stripe acquired Bouncer, a startup in Oakland. With this acquisition, the company aimed to leverage Bouncer's technology in order to aid customers in authenticating themselves in case they are flagged mistakenly to operate the application legitimately.
Jan-2020: WEX completed its acquisition of eNett and Optal. With this acquisition, the company aimed to strengthen its position beyond the United States, bring a unique and complementary product range, and add a skilled team with expertise in operating throughout international markets.
Product Launches and Product Expansion:
Nov-2022: Mastercard launched a new mobile virtual card solution. The new solution aimed to address the rising demand for contactless, digital, and commercial payments, which was propelled owing to the COVID-19 pandemic.
Jan-2022: Mastercard rolled out Mastercard TrackTM Instant Pay, a cutting-edge virtual card solution. The new solution aimed to enable instant payment of supplier invoices in order to deliver enhanced automation and efficiency along with a wide choice for customers as well as providers.
Oct-2021: JP Morgan rolled out Digital Bill Payment. Through this launch, the company aimed to increase its efforts in order to aid customers in digitizing the entire receivables journey through the latest innovations, including the request to pay.
Aug-2021: JPMorgan unveiled request for pay, a real-time payments option. The new solution aimed to allow customers to send payment requests to their banks. Moreover, this solution would save a significant amount of time as well as cost for customers.
Geographical Expansions:
Jun-2021: Wise expanded its geographical footprint in India through its collaboration with the RBL Bank. This geographical expansion aimed to allow Indian customers to transfer money to 44 countries via the Liberalized Remittance Scheme.
Apr-2021: Stripe expanded its geographical footprint with the launch of Stripe Issuing in various countries across the world. Through this geographical expansion, the company aimed to allow customers to create, manage, and supply virtual and physical payment cards to offer more control to businesses over how they spend their money. Furthermore, the company launched the new solution throughout Austria, Belgium, Cyprus, Italy, Latvia, Lithuania, Estonia, Finland, France, Germany, Greece, Ireland, Luxembourg, Malta, Portugal, Slovakia, the Netherlands, the UK, Slovenia, and Spain.
Scope of the Study
Market Segments covered in the Report:
By Product Type
- B2B
- B2C
- C2B
By Card Type
- Credit
- Debit
By Application
- Business Use
- Consumer Use
By Geography
- North America
- US
- Canada
- Mexico
- Rest of North America
- Europe
- Germany
- UK
- France
- Russia
- Spain
- Italy
- Rest of Europe
- Asia Pacific
- China
- Japan
- India
- South Korea
- Singapore
- Malaysia
- Rest of Asia Pacific
- LAMEA
- Brazil
- Argentina
- UAE
- Saudi Arabia
- South Africa
- Nigeria
- Rest of LAMEA
Companies Profiled
- Mastercard, Inc.
- American Express Kabbage Inc.
- JPMorgan Chase & Co.
- Stripe, Inc.
- Adyen N.V.
- BTRS Holdings Inc.
- Wise Payments Limited
- Marqeta Inc.
- Skrill USA, Inc.
- Wex, Inc.
Unique Offerings from KBV Research
- Exhaustive coverage
- Highest number of market tables and figures
- Subscription based model available
- Guaranteed best price
- Assured post sales research support with 10% customization free
Table of Contents
Chapter 1. Market Scope & Methodology
- 1.1 Market Definition
- 1.2 Objectives
- 1.3 Market Scope
- 1.4 Segmentation
- 1.4.1 Global Virtual Cards Market, by Product Type
- 1.4.2 Global Virtual Cards Market, by Card Type
- 1.4.3 Global Virtual Cards Market, by Application
- 1.4.4 Global Virtual Cards Market, by Geography
- 1.5 Methodology for the research
Chapter 2. Market Overview
- 2.1 Introduction
- 2.1.1 Overview
- 2.1.1.1 Market composition and scenario
- 2.1.1 Overview
- 2.2 Key Factors Impacting the Market
- 2.2.1 Market Drivers
- 2.2.2 Market Restraints
Chapter 3. Competition Analysis - Global
- 3.1 KBV Cardinal Matrix
- 3.2 Recent Industry Wide Strategic Developments
- 3.2.1 Partnerships, Collaborations and Agreements
- 3.2.2 Product Launches and Product Expansions
- 3.2.3 Acquisition and Mergers
- 3.2.4 Geographical Expansions
- 3.3 Top Winning Strategies
- 3.3.1 Key Leading Strategies: Percentage Distribution (2018-2022)
- 3.3.2 Key Strategic Move: (Partnerships, Collaborations & Agreements: 2019, Oct - 2022, Jun) Leading Players
Chapter 4. Global Virtual Cards Market by Product Type
- 4.1 Global B2B Market by Region
- 4.2 Global B2C Market by Region
- 4.3 Global C2B Market by Region
Chapter 5. Global Virtual Cards Market by Card Type
- 5.1 Global Credit Market by Region
- 5.2 Global Debit Market by Region
Chapter 6. Global Virtual Cards Market by Application
- 6.1 Global Business Use Market by Region
- 6.2 Global Consumer Use Market by Region
Chapter 7. Global Virtual Cards Market by Region
- 7.1 North America Virtual Cards Market
- 7.1.1 North America Virtual Cards Market by Product Type
- 7.1.1.1 North America B2B Market by Country
- 7.1.1.2 North America B2C Market by Country
- 7.1.1.3 North America C2B Market by Country
- 7.1.2 North America Virtual Cards Market by Card Type
- 7.1.2.1 North America Credit Market by Country
- 7.1.2.2 North America Debit Market by Country
- 7.1.3 North America Virtual Cards Market by Application
- 7.1.3.1 North America Business Use Market by Country
- 7.1.3.2 North America Consumer Use Market by Country
- 7.1.4 North America Virtual Cards Market by Country
- 7.1.4.1 US Virtual Cards Market
- 7.1.4.1.1 US Virtual Cards Market by Product Type
- 7.1.4.1.2 US Virtual Cards Market by Card Type
- 7.1.4.1.3 US Virtual Cards Market by Application
- 7.1.4.2 Canada Virtual Cards Market
- 7.1.4.2.1 Canada Virtual Cards Market by Product Type
- 7.1.4.2.2 Canada Virtual Cards Market by Card Type
- 7.1.4.2.3 Canada Virtual Cards Market by Application
- 7.1.4.3 Mexico Virtual Cards Market
- 7.1.4.3.1 Mexico Virtual Cards Market by Product Type
- 7.1.4.3.2 Mexico Virtual Cards Market by Card Type
- 7.1.4.3.3 Mexico Virtual Cards Market by Application
- 7.1.4.4 Rest of North America Virtual Cards Market
- 7.1.4.4.1 Rest of North America Virtual Cards Market by Product Type
- 7.1.4.4.2 Rest of North America Virtual Cards Market by Card Type
- 7.1.4.4.3 Rest of North America Virtual Cards Market by Application
- 7.1.4.1 US Virtual Cards Market
- 7.1.1 North America Virtual Cards Market by Product Type
- 7.2 Europe Virtual Cards Market
- 7.2.1 Europe Virtual Cards Market by Product Type
- 7.2.1.1 Europe B2B Market by Country
- 7.2.1.2 Europe B2C Market by Country
- 7.2.1.3 Europe C2B Market by Country
- 7.2.2 Europe Virtual Cards Market by Card Type
- 7.2.2.1 Europe Credit Market by Country
- 7.2.2.2 Europe Debit Market by Country
- 7.2.3 Europe Virtual Cards Market by Application
- 7.2.3.1 Europe Business Use Market by Country
- 7.2.3.2 Europe Consumer Use Market by Country
- 7.2.4 Europe Virtual Cards Market by Country
- 7.2.4.1 Germany Virtual Cards Market
- 7.2.4.1.1 Germany Virtual Cards Market by Product Type
- 7.2.4.1.2 Germany Virtual Cards Market by Card Type
- 7.2.4.1.3 Germany Virtual Cards Market by Application
- 7.2.4.2 UK Virtual Cards Market
- 7.2.4.2.1 UK Virtual Cards Market by Product Type
- 7.2.4.2.2 UK Virtual Cards Market by Card Type
- 7.2.4.2.3 UK Virtual Cards Market by Application
- 7.2.4.3 France Virtual Cards Market
- 7.2.4.3.1 France Virtual Cards Market by Product Type
- 7.2.4.3.2 France Virtual Cards Market by Card Type
- 7.2.4.3.3 France Virtual Cards Market by Application
- 7.2.4.4 Russia Virtual Cards Market
- 7.2.4.4.1 Russia Virtual Cards Market by Product Type
- 7.2.4.4.2 Russia Virtual Cards Market by Card Type
- 7.2.4.4.3 Russia Virtual Cards Market by Application
- 7.2.4.5 Spain Virtual Cards Market
- 7.2.4.5.1 Spain Virtual Cards Market by Product Type
- 7.2.4.5.2 Spain Virtual Cards Market by Card Type
- 7.2.4.5.3 Spain Virtual Cards Market by Application
- 7.2.4.6 Italy Virtual Cards Market
- 7.2.4.6.1 Italy Virtual Cards Market by Product Type
- 7.2.4.6.2 Italy Virtual Cards Market by Card Type
- 7.2.4.6.3 Italy Virtual Cards Market by Application
- 7.2.4.7 Rest of Europe Virtual Cards Market
- 7.2.4.7.1 Rest of Europe Virtual Cards Market by Product Type
- 7.2.4.7.2 Rest of Europe Virtual Cards Market by Card Type
- 7.2.4.7.3 Rest of Europe Virtual Cards Market by Application
- 7.2.4.1 Germany Virtual Cards Market
- 7.2.1 Europe Virtual Cards Market by Product Type
- 7.3 Asia Pacific Virtual Cards Market
- 7.3.1 Asia Pacific Virtual Cards Market by Product Type
- 7.3.1.1 Asia Pacific B2B Market by Country
- 7.3.1.2 Asia Pacific B2C Market by Country
- 7.3.1.3 Asia Pacific C2B Market by Country
- 7.3.2 Asia Pacific Virtual Cards Market by Card Type
- 7.3.2.1 Asia Pacific Credit Market by Country
- 7.3.2.2 Asia Pacific Debit Market by Country
- 7.3.3 Asia Pacific Virtual Cards Market by Application
- 7.3.3.1 Asia Pacific Business Use Market by Country
- 7.3.3.2 Asia Pacific Consumer Use Market by Country
- 7.3.4 Asia Pacific Virtual Cards Market by Country
- 7.3.4.1 China Virtual Cards Market
- 7.3.4.1.1 China Virtual Cards Market by Product Type
- 7.3.4.1.2 China Virtual Cards Market by Card Type
- 7.3.4.1.3 China Virtual Cards Market by Application
- 7.3.4.2 Japan Virtual Cards Market
- 7.3.4.2.1 Japan Virtual Cards Market by Product Type
- 7.3.4.2.2 Japan Virtual Cards Market by Card Type
- 7.3.4.2.3 Japan Virtual Cards Market by Application
- 7.3.4.3 India Virtual Cards Market
- 7.3.4.3.1 India Virtual Cards Market by Product Type
- 7.3.4.3.2 India Virtual Cards Market by Card Type
- 7.3.4.3.3 India Virtual Cards Market by Application
- 7.3.4.4 South Korea Virtual Cards Market
- 7.3.4.4.1 South Korea Virtual Cards Market by Product Type
- 7.3.4.4.2 South Korea Virtual Cards Market by Card Type
- 7.3.4.4.3 South Korea Virtual Cards Market by Application
- 7.3.4.5 Singapore Virtual Cards Market
- 7.3.4.5.1 Singapore Virtual Cards Market by Product Type
- 7.3.4.5.2 Singapore Virtual Cards Market by Card Type
- 7.3.4.5.3 Singapore Virtual Cards Market by Application
- 7.3.4.6 Malaysia Virtual Cards Market
- 7.3.4.6.1 Malaysia Virtual Cards Market by Product Type
- 7.3.4.6.2 Malaysia Virtual Cards Market by Card Type
- 7.3.4.6.3 Malaysia Virtual Cards Market by Application
- 7.3.4.7 Rest of Asia Pacific Virtual Cards Market
- 7.3.4.7.1 Rest of Asia Pacific Virtual Cards Market by Product Type
- 7.3.4.7.2 Rest of Asia Pacific Virtual Cards Market by Card Type
- 7.3.4.7.3 Rest of Asia Pacific Virtual Cards Market by Application
- 7.3.4.1 China Virtual Cards Market
- 7.3.1 Asia Pacific Virtual Cards Market by Product Type
- 7.4 LAMEA Virtual Cards Market
- 7.4.1 LAMEA Virtual Cards Market by Product Type
- 7.4.1.1 LAMEA B2B Market by Country
- 7.4.1.2 LAMEA B2C Market by Country
- 7.4.1.3 LAMEA C2B Market by Country
- 7.4.2 LAMEA Virtual Cards Market by Card Type
- 7.4.2.1 LAMEA Credit Market by Country
- 7.4.2.2 LAMEA Debit Market by Country
- 7.4.3 LAMEA Virtual Cards Market by Application
- 7.4.3.1 LAMEA Business Use Market by Country
- 7.4.3.2 LAMEA Consumer Use Market by Country
- 7.4.4 LAMEA Virtual Cards Market by Country
- 7.4.4.1 Brazil Virtual Cards Market
- 7.4.4.1.1 Brazil Virtual Cards Market by Product Type
- 7.4.4.1.2 Brazil Virtual Cards Market by Card Type
- 7.4.4.1.3 Brazil Virtual Cards Market by Application
- 7.4.4.2 Argentina Virtual Cards Market
- 7.4.4.2.1 Argentina Virtual Cards Market by Product Type
- 7.4.4.2.2 Argentina Virtual Cards Market by Card Type
- 7.4.4.2.3 Argentina Virtual Cards Market by Application
- 7.4.4.3 UAE Virtual Cards Market
- 7.4.4.3.1 UAE Virtual Cards Market by Product Type
- 7.4.4.3.2 UAE Virtual Cards Market by Card Type
- 7.4.4.3.3 UAE Virtual Cards Market by Application
- 7.4.4.4 Saudi Arabia Virtual Cards Market
- 7.4.4.4.1 Saudi Arabia Virtual Cards Market by Product Type
- 7.4.4.4.2 Saudi Arabia Virtual Cards Market by Card Type
- 7.4.4.4.3 Saudi Arabia Virtual Cards Market by Application
- 7.4.4.5 South Africa Virtual Cards Market
- 7.4.4.5.1 South Africa Virtual Cards Market by Product Type
- 7.4.4.5.2 South Africa Virtual Cards Market by Card Type
- 7.4.4.5.3 South Africa Virtual Cards Market by Application
- 7.4.4.6 Nigeria Virtual Cards Market
- 7.4.4.6.1 Nigeria Virtual Cards Market by Product Type
- 7.4.4.6.2 Nigeria Virtual Cards Market by Card Type
- 7.4.4.6.3 Nigeria Virtual Cards Market by Application
- 7.4.4.7 Rest of LAMEA Virtual Cards Market
- 7.4.4.7.1 Rest of LAMEA Virtual Cards Market by Product Type
- 7.4.4.7.2 Rest of LAMEA Virtual Cards Market by Card Type
- 7.4.4.7.3 Rest of LAMEA Virtual Cards Market by Application
- 7.4.4.1 Brazil Virtual Cards Market
- 7.4.1 LAMEA Virtual Cards Market by Product Type
Chapter 8. Company Profiles
- 8.1 Mastercard, Inc.
- 8.1.1 Company Overview
- 8.1.2 Financial Analysis
- 8.1.3 Regional Analysis
- 8.1.4 Recent strategies and developments:
- 8.1.4.1 Partnerships, Collaborations, and Agreements:
- 8.1.4.2 Product Launches and Product Expansions:
- 8.1.4.3 Acquisition and Mergers:
- 8.2 American Express Kabbage Inc. (American Express Company)
- 8.2.1 Company Overview
- 8.2.2 Financial Analysis
- 8.2.3 Segmental and Regional Analysis
- 8.2.4 Recent strategies and developments:
- 8.2.4.1 Partnerships, Collaborations, and Agreements:
- 8.3 JPMorgan Chase & Co. (Wepay, Inc.)
- 8.3.1 Company Overview
- 8.3.2 Financial Analysis
- 8.3.3 Segmental and Regional Analysis
- 8.3.4 Recent strategies and developments:
- 8.3.4.1 Partnerships, Collaborations, and Agreements:
- 8.3.4.2 Product Launches and Product Expansions:
- 8.3.4.3 Acquisition and Mergers:
- 8.4 Stripe, Inc.
- 8.4.1 Company Overview
- 8.4.2 Recent strategies and developments:
- 8.4.2.1 Partnerships, Collaborations, and Agreements:
- 8.4.2.2 Acquisition and Mergers:
- 8.4.2.3 Geographical Expansions:
- 8.5 Adyen N.V.
- 8.5.1 Company Overview
- 8.5.2 Financial Analysis
- 8.5.3 Regional Analysis
- 8.5.4 Recent strategies and developments:
- 8.5.4.1 Product Launches and Product Expansions:
- 8.6 BTRS Holdings Inc. (Billtrust)
- 8.6.1 Company Overview
- 8.6.2 Financial Analysis
- 8.6.3 Segmental Analysis
- 8.6.4 Research & Development Expenses
- 8.7 Wise Payments Limited
- 8.7.1 Company Overview
- 8.7.2 Financial Analysis
- 8.7.3 Regional Analysis
- 8.7.4 Recent strategies and developments:
- 8.7.4.1 Partnerships, Collaborations, and Agreements:
- 8.7.4.2 Geographical Expansions:
- 8.8 Marqeta, Inc.
- 8.8.1 Company Overview
- 8.8.2 Financial Analysis
- 8.8.3 Research & Development Expenses
- 8.8.4 Recent strategies and developments:
- 8.8.4.1 Partnerships, Collaborations, and Agreements:
- 8.9 Skrill USA, Inc. (PaySafe Ltd.)
- 8.9.1 Company Overview
- 8.9.2 Financial Analysis
- 8.9.3 Segmental and Regional Analysis
- 8.10. WEX, Inc.
- 8.10.1 Company Overview
- 8.10.2 Financial Analysis
- 8.10.3 Segmental and Regional Analysis
- 8.10.4 Recent strategies and developments:
- 8.10.4.1 Partnerships, Collaborations, and Agreements:
- 8.10.4.2 Acquisition and Mergers:
- 8.10.4.3 Geographical Expansions: