
デジタルID市場:2025-2030年
Digital Identity Market: 2025-2030- 発行日
- ページ情報
- 英文
- 納期
- 即日から翌営業日
- 商品コード
- 1848179
- 翻訳ツール提供対象 PDF対応AI翻訳ツールの無料貸し出しサービスのご利用が可能です
- 通信/IT関連専門 通信/IT関連専門を専門とする市場調査会社です。
概要
関連レポート
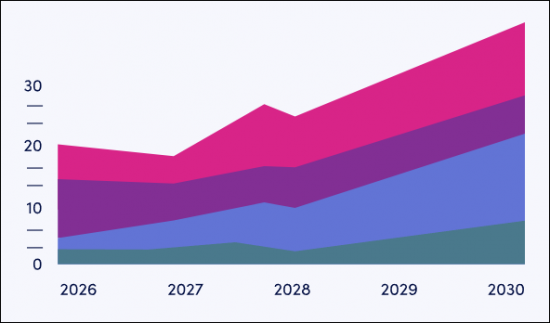
デジタルID市場、2030年までに世界で800億ドル超へ:規制強化とハイブリッド戦略が成長を加速
| 主要統計 | |
|---|---|
| 2025年の市場収益: | 515億米ドル |
| 2030年の市場収益: | 805億米ドル |
| 2025年から2030年の市場成長率 | 56% |
| 予測期間: | 2025-2030年 |
当調査パッケージは、デジタルID市場を包括的かつ洞察的に分析し、デジタルIDプラットフォームプロバイダー、デジタルID検証プロバイダー、政府機関、銀行などのステークホルダーが、今後の成長、主要動向、競合環境を把握できるようにします。
当調査スイートには、個別に購入できるいくつかのオプションが含まれています。市場動向・戦略では、デジタルIDの新たな規制や関連する産業セクターの動向をを取り上げており、国別準備指数では、61の異なる地域におけるデジタルIDの現在と将来の機会を国レベルで分析しています。
データ&予測には、今後5年間のデジタルID市場の採用と将来の成長をマッピングしたデータへのアクセスが含まれ、サードパーティおよび行政主導のデジタルIDアプリ、デジタルIDカード、デジタルIDアプリ別に分かれています。
さらに、競合リーダーボードでは、デジタルIDの市場リーダー20社の広範な分析が掲載されており、各ベンダーの提供する製品自体だけでなく、能力とキャパシティに基づいて各ベンダーを位置付け、各ベンダーの分析を提供しています。
レポート内容はすべて英語で記載されています。
主な特徴
- 主要な要点と戦略的提言:提供者、発行機関、認証機関、銀行向けに主な開発機会、主な調査結果、主な戦略的推提言を詳細に分析しています。
- 市場の展望:デジタルID市場の主要動向と市場拡大の課題について洞察し、関連する使用事例を含め、官民両部門の関心分野を特定します。さらに、教育分野でのデジタルIDなど、新たな動向の分析も含まれています。また、主要61カ国のデジタルID市場の現在の発展状況と成長セグメントに関する国別準備指数を掲載し、将来の展望も示しています。
- ベンチマーク業界予測:デジタルカードとアプリの両方で発行されるデジタルIDの総市場規模および発行数を幅広く予測し、サードパーティ発行者、行政発行者、ブロックチェーンベースのIDごとにさらに分類しています。
- Juniper Researchの競合リーダーボード:デジタルIDプラットフォーム主要20社の能力を評価します。
サンプルビュー
市場データ・予測レポート
サンプルレポート
市場動向と戦略レポート
市場データ&予測レポート
当調査スイートには、49の表と30,000を超えるデータポイントの予測データ一式へのアクセスが含まれています。調査スイートには以下の指標が含まれます:
- デジタルIDアプリの総インストール数
- デジタルIDの総収益
- 年間あたりのデジタルID認証チェック総数
- デジタルIDアプリからの総収益および平均収益:
- サードパーティIDアプリ
- 行政発行IDアプリ
Juniper Researchのインタラクティブ予測](Excel) には以下の機能があります:
- 統計分析:統計分析:データ期間中のすべての地域と国について表示され、ユーザーは特定の指標を検索できます。グラフは簡単に変更でき、クリップボードにエクスポートできます。
- 国別データツール:このツールでは、予測期間中のすべての地域と国の指標を見ることができます。検索バーで表示する指標を絞り込むことができます。
- 国別比較ツール:国を選択して比較することができます。このツールには、グラフをエクスポートする機能が含まれています。
- What-if分析:5つのインタラクティブなシナリオを通じて、ユーザーは予測の前提条件と比較することができます。
競合リーダーボードレポート
対象ベンダーは以下の20社です:
|
|
目次
市場動向・戦略
第1章 重要ポイントと戦略的提言
- 重要ポイント
- 戦略的提言
第2章 市場情勢
- デジタルIDの形態
- 中央集権型ID
- 連携型ID
- 分散型ID
- 主な動向
- eIDAS 2.0
- 近隣諸国のデジタルID制度
- シングルサインオン
- ゼロトラスト
- 自己主権型ID
- 量子対応暗号化
- 関連規格
第3章 セグメント分析
- オンボーディング
- デジタルトラベル認証
- 電子政府 (eGovernment)
- 電子署名 (eSigning)
- 医療分野
- 医療記録へのアクセス
- 医療サービスへのアクセス
- 健康証明書
- 教育
- 教育サービスへのアクセス
- 学歴・資格証明
第4章 国別準備指数
- 焦点市場
- 成長市場
- 飽和市場
- 新興国市場
競合リーダーボード
第1章 Juniper Researchの競合リーダーボード
第2章 企業プロファイル
- ベンダープロファイル
- Civic Technologies
- Digidentity
- Dock Labs
- Entrust
- IBM
- ID&Trust
- Indicio
- IN Groupe
- Midy
- OneID
- Ping Identity
- SICPA
- Signaturit Group
- TECH5
- Tessi
- Thales
- Tinexta InfoCert
- TOPPAN Security
- Veridos and G+D (Giesecke+Devrient)
- Yoti
- 評価手法
- 関連調査
データ・予測
第1章 イントロダクションと調査手法
第2章 予測サマリー
- デジタルIDアプリ
- デジタルID収益
- デジタルID収益 (収益分野別)
第3章 デジタルIDインフラの収益
- デジタルIDプラットフォームの総支出
- デジタルIDカードインフラ支出
- 行政IDアプリの収益
- サードパーティIDアプリの収益
第4章 サードパーティデジタルID
- サードパーティのデジタルIDアプリ
- ブロックチェーンベースのサードパーティIDアプリ
第5章 行政デジタルID
- デジタル身分証明書
- 行政デジタルIDカード
- 行政IDアプリ
デジタルID市場:2025-2030年
- 発行日
- 発行
- Juniper Research Ltd
- ページ情報
- 英文
- 納期
- 即日から翌営業日