
ネットワークAPI市場:2025-2030年
Network APIs Market: 2025-2030- 発行日
- ページ情報
- 英文
- 納期
- 即日から翌営業日
- 商品コード
- 1777932
- 翻訳ツール提供対象 PDF対応AI翻訳ツールの無料貸し出しサービスのご利用が可能です
- 通信/IT関連専門 通信/IT関連専門を専門とする市場調査会社です。
概要
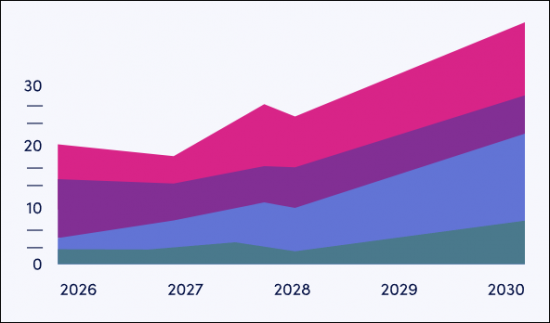
ネットワークAPIの収益は2030年には世界で80億米ドルを超え、KYCが次の主要な事業機会に
| 主要統計 | |
|---|---|
| 2025年のネットワークAPIによる通信事業者収益: | 2億8,300万米ドル |
| 2030年のネットワークAPIによる通信事業者収益: | 81億米ドル |
| 2030年の認証・不正防止ネットワークAPIによる通信事業者収益: | 49億米ドル |
| 予測期間: | 2025-2030年 |
当調査スイートは、通信事業者、CPaaSプロバイダー、その他のGSMAチャネルパートナー向けに、急成長中のネットワークAPI市場に関する広範な分析と実用的なインサイトを提供します。本リサーチには、ネットワークAPI市場において、製品開発やビジネス戦略に関する意思決定を支援するデータが含まれています。GSMAのOpen GatewayおよびCAMARAプロジェクトのネットワークAPIの導入以降、APIは通信事業者の将来的な収益戦略において重要な役割を担うようになっています。本レポートでは、認証・不正防止、通信品質、通信サービス、コンピューティングサービス、デバイス情報、位置情報サービス、決済・課金など、現在利用可能な安定したネットワークAPIの現状および将来的な影響を評価しています。
また、まだ安定段階にないネットワークAPIについても分析を行っており、本人確認 (KYC)、人口密度データ、Network-as-a-Service (NaaS) 関連APIなどの分野におけるAPIに関する戦略的提言を提示しています。さらに、現時点および将来的に通信事業者の収益をけん引するさまざまなネットワークAPIについても評価を行っています。AdunaのアグリゲーションプラットフォームおよびBridge AllianceのAPIエクスチェンジ (BAEx) に関するケーススタディも含まれています。
レポートでは、非安定型ネットワークAPIについても分析と戦略を提供しており、KYC (Know Your Customer)、人口密度データ、NaaS (Network-as-a-Service) 関連APIの各分野のネットワークAPIについて提言を行っています。これに加えて、現在と将来の事業者の収益を促進するさまざまなネットワークAPIの評価も行っています。本調査には、AdunaのアグリゲーションプラットフォームとBridge AllianceのAPIエクスチェンジ (BAEx) に関するケーススタディも含まれています。
本レポートでは、開発者や企業が現在どのようにネットワークAPIを活用しているか、また、AIアプリケーション、銀行・フィンテック、セルラーIoT、eコマース、ゲームなど、どの市場分野がマネタイズにおいて重要になるかについてのインサイトや分析も掲載しています。さらに、通信事業者がビジネスシステム、戦略整合性、データ保護・同意の仕組みをどのようにアップデートする必要があるかも考察しています。
また、国別成長準備指数を掲載し、今後5年間でどのネットワークAPI市場が最も成長する可能性が高いかについての洞察と分析を提供しています。これにより、60を超えるネットワークAPI市場の現在と将来の状況を、関係者が効果的に把握することが可能となります。
本レポートはすべて英語で作成されています。
主な特徴
- 主要な要点と戦略的提言:ネットワークAPI市場における主な開拓機会と知見を詳細に分析。また、ネットワークAPIからの収益拡大を目指す事業者やその他のステークホルダーに対する戦略的提言も掲載しています。
- 市場力学:主要APIの分析を含む、ネットワークAPI市場の主要動向と機会に関する洞察、また、事業者がネットワークAPIを収益化するために活用できるさまざまなビジネスモデルの戦略的分析も含まれています。
- ベンチマーク業界予測:ネットワークAPIコールの総数とネットワークAPIからの事業者収益を含む5年間の予測を提供しています。さらに、認証・不正防止、ロケーションサービス、通信サービス、通信品質、デバイス情報、コンピューティングサービス、決済と課金のカテゴリ別に分類しています。
- Juniper Researchの競合リーダーボード:ネットワークAPI市場の主要ベンダー11社の能力を評価し、市場規模と各ベンダーの提供サービスの詳細な分析結果を掲載しています。
サンプルビュー
市場データ・予測レポート
サンプル
市場動向・戦略レポート
市場データ&予測レポート
当レポートには、23,000のデータポイントと50以上の表からなる予測データ一式へのアクセスが含まれています。
調査対象には以下の指標が含まれます:
- ネットワークAPIコールの総数
- ネットワークAPIによる通信事業者収益
- 加入者あたりの平均ネットワークAPI収益
インタラクティブ予測 (Excel) には、以下の機能が含まれています:
- 統計分析:統計分析:データ期間中のすべての地域と国について表示され、特定の指標を検索できます。グラフは簡単に変更でき、クリップボードにエクスポートできます。
- 国別データツール:このツールでは、予測期間中のすべての地域と国の指標を見ることができます。検索バーで表示する指標を絞り込むことができます。
- 国別比較ツール:特定の国を選択して比較することができます。このツールには、グラフをエクスポートする機能が含まれています。
- What-if分析:3つのインタラクティブなシナリオを通じて、ユーザーは予測の前提条件と比較することができます。
|
|
|
目次
市場動向と戦略
第1章 重要ポイントと戦略的提言
- 重要ポイント
- 主要な戦略的提言
第2章 市場情勢
- イントロダクション
- GSMA Open Gateway Initiative
- CAMARAプロジェクト
- TM ForumとGSMA Partnership
- 現在の市場状況
- ネットワークAPIの主要流通チャネル
- 通信事業者
- マルチ通信事業者プラットフォーム
- ハイパースケーラー
- CPaaSプロバイダー
- システムインテグレーター
- ネットワークインフラベンダー
- 開発者の理解
- 開発者が構築している主なアプリケーション
- i.セルラーIoT
- ii.銀行とフィンテック
- iii.ゲーム
- iv.eコマース
- v. AIアプリケーション
- マーケティングと教育戦略
- 開発者が構築している主なアプリケーション
- ビジネスモデルと収益化戦略
- カニバリゼーションとビジネス構造の変化
- ビジネスシステム
- 通信事業者はネットワークAPI戦略を整合させる必要がある
- データ保護、データプライバシー、同意
- 戦略は短期でなく長期で考えるべき
第3章 将来の機会と市場戦略
- CAMARAのScope
- Meta-release Spring25
- 安定稼働中のAPI
- デバイス到達可能性ステータス
- デバイスローミングステータス
- 位置情報確認
- 電話番号認証
- ワンタイムパスワードSMS送信
- サービス品質プロファイル
- オンデマンド品質制御
- SIMスワップ検出
- シンプル・エッジ検出
- 将来のAPIの機会
- KYC (顧客確認) API
- 人口密度データ
- NaaS API
第4章 国別準備指数
- 国別準備指数:イントロダクション
- 焦点市場
- 中国
- 米国
- 成長市場
- シンガポール
- 新興市場
競合リーダーボード
第1章 競合リーダーボード
第2章 ベンダープロファイル
- ベンダープロファイル
- BTS Group
- Comviva
- Glide Identity
- Infobip
- Microsoft
- Nokia
- Sekura.id
- Sinch
- Symphonica
- Syniverse
- Vonage
- 評価手法
- 制限と解釈
第3章 データ&予測:目次
- 地理的広がり
- 主要顧客と戦略的パートナーシップ
- 提供内容の概要
- Juniper Researchの見解:主な強みと戦略的開発機会
- Sekura.id
- Sinch
- Symphonica
- Syniverse
- Vonage
- 評価手法
- 制限と解釈
データ&予測
第1章 イントロダクション・調査手法
第2章 市場サマリーと今後の市場展望
- ネットワークAPI呼び出しの総数
- ネットワークAPIによる通信事業者の総収益
- 認証・不正防止API呼び出しの総数
- 認証・不正防止APIによる通信事業者の総収益
- 位置情報サービスAPI呼び出しの総数
- 位置情報サービスAPIによる通信事業者の総収益
- 通信サービスAPI呼び出しの総数
- 通信サービスAPIによる通信事業者の総収益
- 通信品質API呼び出しの総数
- 通信品質APIによる通信事業者の総収益
- デバイス情報API呼び出しの総数
- デバイス情報APIによる通信事業者の総収益
- コンピューティングサービスAPI呼び出しの総数
- コンピューティングサービスAPIによる通信事業者の総収益
- 決済・課金API呼び出しの総数
- 決済・課金APIによる通信事業者の総収益
目次
'Network API Revenue to Exceed $8 Billion by 2030 Globally, as KYC Identified as the Next Major Opportunity'
| KEY STATISTICS | |
|---|---|
| Total operator revenue from network APIs in 2025: | $283mn |
| Total operator revenue from network APIs in 2030: | $8.1bn |
| Total operator revenue from authentication and fraud prevention network APIs in 2030: | $4.9bn |
| Forecast period: | 2025-2030 |
Overview
Our "Network API" research suite provides operators, CPaaS providers, and other GSMA channel partners with extensive analysis and actionable insights into the rapidly growing network API market. It contains data that allows stakeholders in the market to make informed decisions on their product development and business strategies in the network API market. Since the launch of the GSMA Open Gateway and the CAMARA Project networks, APIs have become a key part of operators' future revenue strategies. The report assesses the present-day and future impact of current stable network APIs including Authentication and Fraud, Communication Quality, Communication Services, Computing Services, Device Information, Location Services, and Payments and Charging.
The report also analyses and provides strategy for non-stable network APIs, with recommendations being provided for network APIs in the areas of Know Your Customer (KYC), Population Density Data, and Network-as-a-Service (NaaS)-related APIs. This is in addition to assessing the different network APIs driving operator revenue both at present and in the future. The study includes case studies on Aduna's aggregation platform and the Bridge Alliance API Exchange (BAEx).
The report also features insights and analysis on how developers and enterprises are currently using network APIs, and which market verticals will be important to monetisation, including AI applications, banks and fintechs, cellular IoT, eCommerce, and gaming. It also looks at how operators need to update business systems, strategy alignment, and data protection and consent.
The report includes a Country Readiness Index; providing insight and analysis into which network API markets will experience the greatest growth over the next five years. This enables stakeholders to effectively understand the current and future status of more than 60 different network API markets.
The market forecast comprises of several different options that can be purchased separately, including access to data mapping and a forecast document, a strategy and trends document detailing critical trends in the market, and strategic recommendations for monetising and innovating services in the network API market.
The research suite includes a Competitor Leaderboard, which can be purchased separately; containing analysis and market sizing for 11 leading network API vendors, who are each working with operators to monetise network APIs.
Collectively, the suite provides a critical tool for understanding the network API market, allowing operators and other stakeholders to optimise their future business strategies and product or service development; providing them with a competitive advantage over their rivals.
All report content is delivered in the English language.
Key Features
- Key Takeaways & Strategic Recommendations: In-depth analysis of key development opportunities and findings within the network API market. This is accompanied by strategic recommendations for operators, and other stakeholders in the market seeking to increase their revenue from network APIs.
- Market Dynamics: Insights into key trends and opportunities in the network API market, including analysis of key APIs. It also includes a strategic analysis of the different business models that operators can leverage to monetise their network APIs.
- Benchmark Industry Forecast: The suite provides five-year forecasts for the global network API market, including for the total number of network API calls and total operator revenue from network APIs. It is further split by the categories of authentication and fraud prevention, location services, communication services, communication quality, device information, computing services, and payments and charging.
- Juniper Research Competitor Leaderboard: Key player capability and capacity assessment for 11 key vendors in the network API market, with market sizing and detailed analysis of each vendor's offering.
SAMPLE VIEW
Market Data & Forecasting Report
The numbers tell you what's happening, but our written report details why, alongside the methodologies.
SAMPLE VIEW
Market Trends & Strategies Report
A comprehensive analysis of the current market landscape, alongside strategic recommendations.
Market Data & Forecasting Report
The market-leading research for the "Network API" market includes access to the full set of forecast data; of 23,000 datapoints and over 50 tables.
Metrics in the research suite include:
- Total Number of Network API Calls
- Total Operator Revenue from Network APIs
- Average Operator Network API Revenue Per Mobile Subscriber
Splits are provided for each of these metrics for Authentication and Fraud, Communication Quality, Communication Services, Computing Services, Device Information, Location Services, and Payments and Charging.
Juniper Research's Interactive Forecast Excel contains the following functionality:
- Statistics Analysis: Users benefit from the ability to search for specific metrics; displayed for all regions and countries across the data period. Graphs are easily modified and can be exported to the clipboard.
- Country Data Tool: This tool enables users to look at metrics for all regions and countries in the forecast period. Users can refine the metrics displayed via a search bar.
- Country Comparison Tool: Users can select and compare specific countries. The ability to export graphs is included in this tool.
- What-if Analysis: Here, users can compare forecast metrics against their own assumptions, via three interactive scenarios.
Market Trends & Strategies Report
This report thoroughly examines the global Network API market; assessing market trends, challenges to monetisation, and the different business models available to operators. Alongside this analysis, the report provides comprehensive evaluation of the different stable APIs which will drive revenue in the future, and explores how operators can best convert the development of APIs into future revenue streams.
Competitor Leaderboard Report
The Competitor Leaderboard included in this report provides detailed evaluation and market positioning for 11 network API vendors. These companies are positioned as established leaders, leading challengers, or disruptors and challengers; based on a capacity, capability, and product assessment. This includes analysis of their key advantages in the market, future development plans, and key partnerships.
The network API Competitor Leaderboard includes the following key vendors:
|
|
|
Table of Contents
Market Trends & Strategies
1. Key Takeaways and Strategic Recommendations
- 1.1. Key Takeaways
- 1.2. Key Strategic Recommendations
2. Market Landscape
- 2.1. Introduction
- 2.1.1. The GSMA Open Gateway Initiative
- Figure 2.1: Examples of Operators Who Have Joined the GSMA Open Gateway
- 2.1.2. The CAMARA Project
- Figure 2.2: Select CAMARA Members
- 2.1.1. The GSMA Open Gateway Initiative
- 2.2. TM Forum and the GSMA Partnership
- 2.3. Current Market Status
- Figure 2.3: Total Operator Revenue from Network APIs ($m), Split by 8 Key Regions, 2025-2030
- Table 2.4: Total Operator Revenue from Network APIs ($m), Split by API Category, 2025-2030
- 2.4. Key Distribution Channels for Network APIs
- 2.4.1. Operators
- i. Multi-operator Platforms
- 2.4.2. Hyperscalers
- 2.4.3. CPaaS Providers
- 2.4.4. System Integrators
- 2.4.5. Network Infrastructure Vendors
- 2.5. Understanding Developers
- 2.5.1. Which Applications Are Developers Building?
- i. Cellular IoT
- Figure 2.5: Total Number of Cellular IoT Connections in 2030 (%), Split by 8 Key Regions
- ii. Banks and Fintechs
- Table 2.6: Examples of Moves Away from A2P SMS (June 2025)
- iii. Gaming
- iv. eCommerce
- v. AI Applications
- i. Cellular IoT
- 2.5.2. Marketing and Education Strategies
- 2.5.1. Which Applications Are Developers Building?
- 2.6. Business Model and Monetisation Strategies
- i. When Is Charging a Premium Effective?
- 2.7. Cannibalisation Business Structure Changes
- 2.8. Business Systems
- 2.9. Operators Must Align Network API Strategies
- 2.10. Data Protections, Data Privacy, and Consent
- 2.11. Strategies Need to be Long-term, Not Short-term
- Figure 2.7: Total Operator Revenue from Network APIs ($m), Split by 8 Key Regions, 2025-2030
3. Future Opportunities and Market Strategies
- 3.1. CAMARA's Scope
- Figure 3.1: Types of CAMARA API
- 3.2. Meta-release Spring25
- Figure 3.2: Total Operator Revenue from Network APIs ($m), Split by 8 Key Regions, 2025-2030
- Figure 3.3: Meta-release Spring25
- 3.3. Stable APIs
- 3.3.1. Device Reachability Status
- 3.3.2. Device Roaming Status
- 3.3.3. Location Verification
- 3.3.4. Number Verification
- Figure 3.4: Without Number Verification
- 3.3.5. One-time Password SMS
- 3.3.6. Quality of Service Profiles
- 3.3.7. Quality on Demand
- Figure 3.5: Overview of Quality on Demand API
- 3.3.8. SIM Swap
- 3.3.9. Simple Edge Discovery
- 3.4. Future API Opportunities
- 3.4.1. KYC APIs
- Figure 3.6: Total Spend on KYC and KYB Systems per annum ($m), Split by 8 Key Regions, 2024-2029
- Figure 3.7: Total Spend on KYC/KYB Systems per annum ($m), Split by Select Key Industries, 2024-2029
- 3.4.2. Population Density Data
- 3.4.3. NaaS APIs
- 3.4.1. KYC APIs
4. Country Readiness Index
- 4.1. Introduction to the Country Readiness Index
- Figure 4.1: Juniper Research Country Readiness Index: Network API Market - Regional Definitions
- Table 4.2: Juniper Research Country Readiness Index: Network API Market - Scoring Criteria
- Figure 4.3: Juniper Research Country Readiness Index: Network API Market
- Table 4.4: Network API Market Country Readiness Index: Market Segments
- 4.2. Focus Markets
- 4.2.2. China
- Figure 4.5: Total Operator Revenue from Network APIs in China, 2024-2030
- Table 4.6: GSMA-certified Network APIs in China, in June 2025
- 4.2.3. The US
- Figure 4.7: Total Operator Revenue from Network APIs in the US ($m), Split by Network API Type, 2024-2030
- Figure 4.8: US Operator Network API Deployments
- 4.2.2. China
- 4.3. Growth Markets
- Figure 4.9: Network API High-growth Countries
- 4.3.1. Singapore
- Table 4.10: Total Number of Network APIs in Singapore
- Figure 4.11: Total Operator Revenue from Network APIs ($m) in Singapore, Split by Network API Category, 2024-2030
- 4.4. Developing Markets
- Figure 4.12: Total Operator Revenue from Select Developing Markets ($m), 2025-2030
- Table 4.13: Juniper Research Country Readiness Index Heatmap: North America
- Table 4.14: Juniper Research Country Readiness Index Heatmap: Latin America
- Table 4.15: Juniper Research Country Readiness Index Heatmap: West Europe
- Table 4.16: Juniper Research Country Readiness Index Heatmap: Central & East Europe
- Table 4.17: Juniper Research Country Readiness Index Heatmap: Far East & China
- Table 4.18: Juniper Research Country Readiness Index Heatmap: Indian Subcontinent
- Table 4.19: Juniper Research Country Readiness Index Heatmap: Rest of Asia Pacific
- Table 4.20: Juniper Research Country Readiness Index Heatmap: Africa & Middle East
Competitor Leaderboard
1. Competitor Leaderboard
- 1.1. Why Read This Report
- Table 1.1: Juniper Research Competitor Leaderboard: Network API Market - Vendors and Product Portfolios
- Figure 1.2: Juniper Research Competitor Leaderboard: Network API Market - 11 Vendors
- Table 1.3: Juniper Research Competitor Leaderboard: Network API Market - 11 Vendors & Positioning
- Table 1.4: Juniper Research Competitor Leaderboard Heatmap: Network API Market - 11 Vendors
2. Vendor Profiles
- 2.1. Vendor Profiles
- 2.1.1. BTS Group
- i. Corporate Information
- ii. Geographical Spread
- iii. Key Clients & Strategic Partnerships
- iv. High-level View of Offerings
- Figure 2.1: BTS' S1 Platform
- v. Juniper Research's View: Key Strengths & Strategic Development Opportunities
- 2.1.2. Comviva
- i. Corporate Information
- ii. Geographical Spread
- iii. Key Clients & Strategic Partnerships
- iv. High-level View of Offerings
- v. Juniper Research's View: Key Strengths & Strategic Development Opportunities
- 2.1.3. Glide Identity
- i. Corporate Information
- ii. Geographical Spread
- iii. Key Clients & Strategic Partnerships
- iv. High-level View of Offerings
- v. Juniper Research's View: Key Strengths & Strategic Development Opportunities
- 2.1.4. Infobip
- i. Corporate Information
- Table 2.2: Infobip's Acquisitions - April 2021 to Present
- ii. Geographical Spread
- iii. Key Clients & Strategic Partnerships
- iv. High-level View of Offerings
- v. Juniper Research's View: Key Strengths & Strategic Development Opportunities
- i. Corporate Information
- 2.1.5. Microsoft
- i. Corporate Information
- ii. Geographical Spread
- iii. Key Clients & Strategic Partnerships
- iv. High-level View of Offerings
- Figure 2.3: Azure Programmable Connectivity
- v. Juniper Research's View: Key Strengths & Strategic Development Opportunities
- 2.1.6. Nokia
- i. Corporate Information
- Table 2.4: Nokia's Select Financial Information (Euro), 2021-2024
- ii. Geographical Spread
- iii. Key Clients & Strategic Partnerships
- iv. High-level View of Offerings
- v. Juniper Research's View: Key Strengths & Strategic Development Opportunities
- i. Corporate Information
- 2.1.7. Sekura.id
- i. Corporate Information
- ii. Geographical Spread
- iii. Key Clients & Strategic Partnerships
- iv. High-level View of Offerings
- v. Juniper Research's View: Key Strengths & Strategic Development Opportunities
- 2.1.8. Sinch
- i. Corporate Information
- Table 2.5: Sinch's Most Recent Acquisitions, 2020-2021
- Table 2.6: Sinch's Select Financial Information (SEKm), 2022-2024
- ii. Geographical Spread
- iii. Key Clients & Strategic Partnerships
- iv. High-level View of Offerings
- Figure 2.7: Sinch's Offerings
- v. Juniper Research's View: Key Strengths & Strategic Development Opportunities
- i. Corporate Information
- 2.1.9. Symphonica
- i. Corporate Information
- ii. Geographical Spread
- iii. Key Clients & Strategic Partnerships
- iv. High-level View of Offerings
- Figure 2.8: Symphonica Platform
- v. Juniper Research's View: Key Strengths & Strategic Development Opportunities
- 2.1.10. Syniverse
- i. Corporate Information
- ii. Geographical Spread
- iii. Key Clients & Strategic Partnerships
- iv. High-level View of Offerings
- v. Juniper Research's View: Key Strengths & Strategic Development Opportunities
- 2.1.11. Vonage
- i. Corporate Information
- ii. Geographical Spread
- iii. Key Clients & Strategic Partnerships
- iv. High-level View of Offerings.
- v. Juniper Research's View: Key Strengths & Strategic Development Opportunities
- 2.1.1. BTS Group
- 2.2. Juniper Research Leaderboard Assessment Methodology
- 2.3. Limitations & Interpretations
- Table 2.9: Juniper Research Competitor Leaderboard: Network API Market
3. Data & Forecasting Table of Contents
- ii. Geographical Spread
- iii. Key Clients & Strategic Partnerships
- iv. High-level View of Offerings
- v. Juniper Research's View: Key Strengths & Strategic Development Opportunities
- 2.1.7. Sekura.id
- i. Corporate Information
- ii. Geographical Spread
- iii. Key Clients & Strategic Partnerships
- iv. High-level View of Offerings
- v. Juniper Research's View: Key Strengths & Strategic Development Opportunities
- 2.1.8. Sinch
- i. Corporate Information
- Table 2.5: Sinch's Most Recent Acquisitions, 2020-2021
- Table 2.6: Sinch's Select Financial Information (SEKm), 2022-2024
- ii. Geographical Spread
- iii. Key Clients & Strategic Partnerships
- iv. High-level View of Offerings
- Figure 2.7: Sinch's Offerings
- v. Juniper Research's View: Key Strengths & Strategic Development Opportunities
- i. Corporate Information
- 2.1.9. Symphonica
- i. Corporate Information
- ii. Geographical Spread
- iii. Key Clients & Strategic Partnerships
- iv. High-level View of Offerings
- Figure 2.8: Symphonica Platform
- v. Juniper Research's View: Key Strengths & Strategic Development Opportunities
- 2.1.10. Syniverse
- i. Corporate Information
- ii. Geographical Spread
- iii. Key Clients & Strategic Partnerships
- iv. High-level View of Offerings
- v. Juniper Research's View: Key Strengths & Strategic Development Opportunities
- 2.1.11. Vonage
- i. Corporate Information
- ii. Geographical Spread
- iii. Key Clients & Strategic Partnerships
- iv. High-level View of Offerings.
- v. Juniper Research's View: Key Strengths & Strategic Development Opportunities
- 2.1.7. Sekura.id
- 2.2. Juniper Research Leaderboard Assessment Methodology
- 2.3. Limitations & Interpretations
- Table 2.9: Juniper Research Competitor Leaderboard: Network API Market
Data & Forecasting
1. Introduction and Methodology
- 1.1. Introduction To Network APIs
- Figure 1.1: Total Operator Revenue from Network APIs ($m), Split by Network API Type, 2025-2030
- 1.2. Forecast Methodology
- Figure 1.2: Juniper Research Network API Market: Methodology Model
2. Market Summary and Future Market Outlook
- 2.1. Total Number of Network API Calls
- Figure & Table 2.1: Total Number of Network API Calls (m), Split by 8 Key Regions, 2025-2030
- 2.2. Total Operator Revenue from Network APIs
- Figure & Table 2.2: Total Operator Revenue from Network APIs ($m), Split By 8 Key Regions, 2025-2030
- 2.3. Total Number of Authentication and Fraud Prevention API Calls
- Figure & Table 2.3: Total Number of Authentication and Fraud Prevention API Calls (m), Split by 8 Key Regions, 2025-2030
- 2.4. Total Operator Revenue from Authentication and Fraud Prevention APIs
- Figure & Table 2.4: Total Operator Revenue ($m) from Authentication and Fraud APIs
- 2.5. Total Number of Location Services API Calls
- Figure & Table 2.5: Total Number of Location Services API Calls (m), Split by 8 Key Regions, 2025-2030
- 2.6. Total Operator Revenue from Location Services APIs
- Figure & Table 2.6: Total Operator Revenue from Location Services APIs ($m), Split by 8 Key Regions, 2025-2030
- 2.7. Total Number of Communication Services API Calls
- Figure & Table 2.7: Total Number of Location Services API Calls (m), Split by 8 Key Regions, 2025-2030
- 2.8. Total Operator Revenue from Communication Services APIs
- Figure & Table 2.8: Total Operator Revenue from Communication Services APIs ($m), Split by 8 Key Regions, 2025-2030
- 2.9. Total Number of Communication Quality API Calls
- Figure & Table 2.9: Total Number of Communication Quality API Calls (m), Split by 8 Key Regions, 2025-2030
- 2.10. Total Operator Revenue from Communication Quality APIs
- Figure & Table 2.10: Total Operator Revenue from Communication Quality APIs ($m), Split by 8 Key Regions, 2025-2030
- 2.11. Total Number of Device Information API Calls
- Figure & Table 2.11: Total Number of Device Information API Calls (m), Split by Key Regions, 2025-2030
- 2.12. Total Operator Revenue from Device Information APIs
- Figure & Table 2.12: Total Operator Revenue from Device Information APIs ($m), Split by 8 Key Regions, 2025-2030
- 2.13. Total Number of Computing Services API Calls
- Figure & Table 2.13: Total Number of Computing Services API Calls (m), Split by Key Regions, 2025-2030
- 2.14. Total Operator Revenue from Computing Services APIs
- Figure & Table 2.14: Total Operator Revenue from Computing Services APIs ($m), Split by 8 Key Regions, 2025-2030
- 2.15. Total Number of Payments and Charging API Calls
- Figure & Table 2.15: Total Number of Payments and Charging API Calls (m), Split by 8 Key Regions, 2025-2030
- 2.16. Total Operator Revenue from Payments and Charging API Calls
- Figure & Table 2.16: Total Operator Revenue from Payments and Charging APIs ($m), Split by 8 Key Regions, 2025-2030
- 発行日
- 発行
- Juniper Research Ltd
- ページ情報
- 英文
- 納期
- 即日から翌営業日


