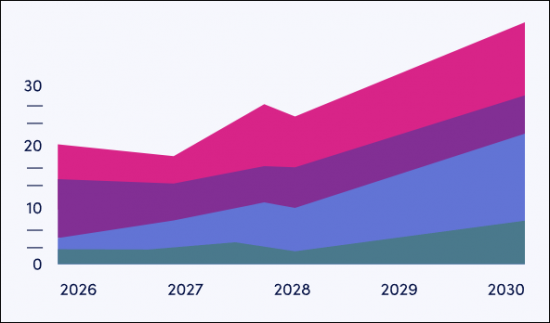
市場調査レポート
商品コード
1125625

非接触型決済の世界市場:主な機会、新興動向、市場予測(2022年~2027年)

Contactless Payments: Key Opportunities, Emerging Trends & Market Forecasts 2022-2027

出版日: | 発行: Juniper Research Ltd | ページ情報: 英文 | 納期: 即日から翌営業日

価格
価格表記: GBPを日本円(税抜)に換算
本日の銀行送金レート: 1GBP=195.22円
非接触型決済の世界市場:主な機会、新興動向、市場予測(2022年~2027年)
出版日: 2022年09月12日
発行: Juniper Research Ltd
ページ情報: 英文
納期: 即日から翌営業日
  • 全表示
  • 概要
  • 目次
概要

世界の非接触型決済トランザクション金額は、2022年の4兆6,000億米ドルから、2027年までに10兆米ドルに達すると予測されています。

当レポートでは、世界の非接触型決済市場について調査分析し、ベンダー15社の評価のほか、現在の市場機会、主な提言、将来の見通しなど、最新の情報を提供しています。

レポート構成:

  • 市場動向・戦略(PDF)
  • 競合企業リーダーボード(PDF)
  • データ・予測(PDF・Excel)
  • オンラインデータプラットフォームの利用 (12ヶ月間)

主な市場統計

2021年の市場規模 6,410億米ドル
2026年の市場規模 2兆7,000億米ドル
2021年~2026年のCAGR: 33.10%

目次

市場動向・戦略

第1章 要点・戦略的提言

第2章 非接触型決済:市場状況

  • イントロダクション
  • 非接触型市場インフラ
    • 非接触型POS
    • ソフトPOS
    • 非接触型ATM
  • 非接触型市場の促進要因
    • ニューノーマルとしての非接触型
    • 利便性のニーズ
  • 非接触型カード
  • 生体認証カード
  • カードスキームと非接触型決済

第3章 モバイル決済・ウェアラブル決済

  • モバイル決済
    • モバイルウォレット
    • 市場の見通し
  • NFC vs. QRコード決済
    • NFCモバイル決済
    • QRコード決済
  • ウェアラブル決済
  • 発券

第4章 地域分析

  • 北米
    • 米国
    • カナダ
  • 西欧
    • フィンランド
    • ドイツ
    • 英国
  • 中欧・東欧
    • チェコ共和国
    • ポーランド
  • ラテンアメリカ
    • ブラジル
    • メキシコ
  • 極東・中国
    • 中国
    • 日本
  • インド亜大陸
    • インド
    • パキスタン
  • その他のアジア太平洋地域
    • オーストラリア
    • ニュージーランド
  • アフリカ・中東
    • 南アフリカ
    • アラブ首長国連邦
  • 注釈

競合企業リーダーボード

第1章 競合情勢・リーダーボード

  • レポートを読む理由
  • ベンダープロファイル
    • CPI Card Group
    • DIGISEQ
    • FIDESMO
    • Giesecke+Devrient
    • Goldpac
    • HID Global
    • IDEMIA
    • Kona I
    • MATICA
    • Netcetera
    • Payair
    • Pri-Num
    • Thales
    • Toppan Gravity
    • Zwipe

Juniper Researchリーダーボードの評価手法

  • 制限・解釈

データ・予測

第1章 調査手法と前提条件

第2章 予測のサマリー

  • 非接触型決済利用予測
    • 非接触型メカニズム:カード、モバイル、ウェアラブル
    • モバイルウォレット非接触型サービス:Apple Pay、Samsung Pay、Google Pay、など
  • 非接触型トランザクション予測
    • 非接触型トランザクション合計件数:小売決済・発券
    • 非接触型トランザクション合計金額:小売決済・発券

第3章 非接触型カード決済

  • 非接触型カード利用予測
    • 使用中の非接触型決済カード
  • 非接触型カードトランザクション予測
    • トランザクション合計件数
    • トランザクション合計金額

第4章 モバイル非接触型決済

  • 非接触型モバイル利用予測
    • 非接触型決済に使用されるNFC対応ハンドセット
    • OEM-Pay非接触型ユーザー数
    • 非接触型モバイル小売決済トランザクション件数
    • 非接触型モバイル小売決済トランザクション金額

第5章 ウェアラブル非接触型決済

  • スマートウェアラブル非接触型決済利用予測
    • ウェアラブルによる非接触型決済
  • スマートウェアラブル非接触型決済トランザクション予測
    • スマートウェアラブル非接触型決済トランザクション件数
    • スマートウェアラブル非接触型決済トランザクション金額

第6章 NFC発券

  • NFC発券利用予測
    • NFC発券ユーザー
    • NFC発券トランザクション件数
    • NFC発券トランザクション金額

第7章 非接触型トークン化

  • 非接触型トークン化の予測
    • 非接触型トークン化の件数
    • 非接触型トークン化の収益
目次

Juniper Research's latest “Contactless Payments research” provides a detailed analysis of this evolving market. This includes an assessment of how mobile and wearable payments solutions are changing the contactless payments landscape. Additionally, the research includes an extensive evaluation of 15 contactless payments vendors via the Juniper Research Competitor Leaderboard.

The report covers current market opportunities, key recommendations and future prospects. It also includes a comprehensive dataset for key contactless payments metrics, featuring total transaction volume and total transaction value for different forms of contactless payment methods, such as contactless cards, mobile payments, and wearables.

This research suite comprises:

  • Market Trends & Strategies (PDF)
  • Competitor Leaderboard (PDF)
  • Data & Forecasts (PDF & Excel)
  • 12 Months' Access to harvest Online Data Platform

Key Market Statistics

Market size in 2021:$641.0bn
Market size in 2026:$2.7tn
2021 to 2026 CAGR:33.10%

KEY FEATURES

  • Market Dynamics: Insights into key trends and challenges within the contactless payments market; addressing challenges posed by mobile payments, changes in usage trends, and technological developments in the payments market.
  • Regional Analysis: A regional-level analysis of 17 countries, spanning 8 key regions; covering the current deployment level and future outlook of contactless payments in each market.
  • Key Takeaways & Strategic Recommendations: Analysis of key development opportunities within contactless payments, accompanied by key strategic recommendations for stakeholders including contactless card issuers and mobile payment solution providers.
  • Benchmark Industry Forecasts: Includes forecasts for total transaction value and volume for the various forms of contactless payments. This data is split by our 8 key forecast regions and 60 countries:
    • North America:
      • Canada, US
    • Latin America:
      • Argentina, Brazil, Chile, Colombia, Ecuador, Mexico, Peru, Uruguay.
    • West Europe:
      • Austria, Belgium, Denmark, Finland, France, Germany, Greece, Ireland, Italy, Netherlands, Norway, Portugal, Spain, Sweden, Switzerland, UK.
    • Central & East Europe:
      • Croatia, Czech Republic, Hungary, Poland, Romania, Russia, Turkey, Ukraine.
    • Far East & China:
      • China, Hong Kong, Japan, South Korea.
    • Indian Subcontinent:
      • Bangladesh, India, Nepal, Pakistan.
    • Rest of Asia Pacific:
      • Australia, Indonesia, Malaysia, New Zealand, Philippines, Singapore, Thailand, Vietnam.
    • Africa & Middle East:
      • Algeria, Egypt, Israel, Kenya, Kuwait, Nigeria, Qatar, Saudi Arabia, South Africa, United Arab Emirates.
  • Juniper Research Competitor Leaderboard: Key player capability and capacity assessment for 15 contactless payment vendors, via the Juniper Research Competitor Leaderboard:
    • CPI Card Group
    • DIGISEQ
    • FIDESMO
    • Giesecke+Devrient
    • Goldpac
    • HID Global
    • IDEMIA
    • KONA I
    • MATICA
    • Netcetera
    • Payair
    • Pri-Num
    • Thales
    • Toppan Gravity
    • Zwipe

KEY QUESTIONS ANSWERED

  • 1. What is the state of the contactless payment acceptance infrastructure?
  • 2. What are the key drivers of contactless payments?
  • 3. Who are the leading vendors in the contactless payments market?
  • 4. Which markets will have the greatest adoption of contactless payments over the next five years?
  • 5. How will mobile payments and wearables compare against contactless cards over the next five years?

COMPANIES REFERENCED

  • Included in Juniper Research Competitor Leaderboard: CPI Card Group, DIGISEQ, Fidesmo, G+D, Goldpac, HID Global, IDEMIA, Kona I, Matica, Netcetera, Payair, Pri-Num, Thales, Toppan Gravity, Zwipe.
  • Mentioned: ABN Amro, American Express, Apple, Arjo Systems, ASSA ABLOY Group , Bai Tushum Bank, Bank of China, Bank of Cyprus, Barclays, BCP (Banco de Crédito del Perú), BPS-Sberbank, China Construction Bank, China Merchants Bank , China Mobile, China UnionPay, Citi, Clearhaus, Clemson University, Covalent, Credorax, De La Rue's Citizen Identity Business, Deutsche Kreditbank AG, Device Authority, Diners, Dresscode Shirts, dz card, EnterCard, Face Technologies, Fingerprint Cards, First Mile, Fitbit, Garmin, Halbank, HSBC, HydrantID, HypoVereinsbank , ICBC, IdenTrust, IDEXa Biometrics, Inecobank, InvoTech Systems, JCB, K Wearables, KL HI-TECH, Laks, LHV Pank, Mastercard, MeaWallet, Mondaine, Mountain America Credit Union, NBS Technologies , Netcetera, Nexperts, Nextwave, Nova Bank, NXP Semiconductors, Olympic, Oxygen, Payair, PBOC, Ping an Bank, Placard, PNB (Philippine National Bank), Raiffeisen Bank, Resurs Bank, Samsung, SHVA, Sodexo, Soft Space, Standard Chartered Bank, Swatch, TBC Bank, UBank, UbiQ Software, Unibank, Visa, Wallster, WLA (White Label Alliance).

DATA & INTERACTIVE FORECAST

Data Splits for:

  • Contactless Cards
  • NFC Mobile Payments
  • Wearable Payments
  • Contactless Ticketing
  • Contactless Tokenisation

Metrics include user base, average transaction volumes per user, total transaction volumes, average transaction values and total transaction values.

  • Geographical splits: 60 countries
  • Number of tables: Over 128 tables
  • Number of datapoints: Over 58,000 datapoints

Harvest: Our online data platform, harvest, contains the very latest market data and is updated throughout the year. This is a fully featured platform enabling clients to better understand key data trends and manipulate charts and tables; overlaying different forecasts within the one chart - using the comparison tool. Empower your business with our market intelligence centre, and receive alerts whenever your data is updated.

Interactive Excels (IFxl): Our IFxl tool enables clients to manipulate both forecast data and charts, within an Excel environment, to test their own assumptions using the interactive scenario tool and compare selected markets side by side in customised charts and tables. IFxls greatly increase a client's ability to both understand a particular market and to integrate their own views into the model.

FORECAST SUMMARY

The value of contactless payment transactions will reach $10 trillion globally by 2027; from $4.6 trillion in 2022. The investment in the underlying contactless payments ecosystem, such as contactless-enabled POS terminals and device-level support will be the key driver of contactless transaction value growth over the next five years.

  • The push towards cashless societies will drive growth as countries look to decrease their reliance upon cash. Mobile and wearable contactless payments are anticipated to grow by 221% between 2022 and 2027. This growth owes to the convenience that mobile and wearable payments offer consumers, eliminating the need to carry and produce a contactless card, easing the burden of transitioning away from cash. In comparison, contactless card payments are anticipated to grow by only 119% during the same period.
  • The high growth of POS (point-of-sale) terminals that are capable of accepting contactless payments are also fuelling this growth. Accordingly, POS vendors must prioritise convenience when designing NFC solutions for the market that can cater to the growing number of devices that offer NFC payment capabilities.
  • Global contactless ticketing spend is set to grow by over 440% between 2022 and 2027. NFC ticketing has recovered strongly following the easing of pandemic-related restrictions and is forecast to continue rising rapidly over the next five years.
  • This growth will be further accelerated by the rapid deployment of NFC ticketing solutions across public transport networks with the aim of reducing payment friction for customers. In turn, vendors must foster adoption of their NFC ticketing solutions, targeting the public transport sector in developed regions that are increasingly seeking out ways to improve ticketing efficiencies.

Table of Contents

Market Trends & Strategies

1. Key Takeaways & Strategic Recommendations

  • 1.1 Key Takeaways
  • 1.2 Strategic Recommendations

2. Contactless Payments: Market Status

  • 2.1 Introduction
    • Figure 2.1: Mobile Wallets, Payment Cards and Wearables as a Proportion of the Total Number of Devices in Use for Payments (%), 2022 & 2027
  • 2.2 Contactless Market Infrastructure
    • Figure 2.2: Types of Contactless Market Infrastructure
    • 2.2.1 Contactless POS
      • Figure 2.3: Proportion of POS Terminals in Use that are Contactless Enabled (%), 2022 and 2027, Split by 8 Key Regions
      • Figure 2.4: Number of Contactless-enabled POS Terminals Globally (m), 2022-2027
    • 2.2.2 Soft POS
      • Figure 2.5: Number of Soft POS Terminals Globally (m), 2022-2027
    • 2.2.3 Contactless ATMs
      • Figure 2.6: Number of Contactless ATMs, (m), 2022-2027, Split by 8 Key Regions
  • 2.3 Drivers of the Contactless Market
    • Figure 2.7: Drivers of Contactless Payments
    • 2.3.1 Contactless as the New 'Normal'
    • 2.3.2 The Need for Convenience
  • 2.4 Contactless Cards
    • Figure 2.8: Number of Contactless Payment Cards in Issue (m), Global, 2019-2027
    • i. Computer Chip Shortage
  • 2.5 Biometric Cards
    • Figure 2.9: Biometric Payment Card Payment Process
    • Figure 2.10: Thales and G+D Biometric Payment Cards
  • 2.6 Card Schemes and Contactless Payments

3. Mobile & Wearable Payments

  • 3.1 Mobile Payments
    • 3.1.1 Mobile Wallets
    • 3.1.2 Market Outlook
      • i. Linking to Loyalty Schemes
      • ii. BNPL
      • iii. Expansion of Offerings
      • iv. Juniper Research's View:
  • 3.2 NFC vs QR Code Payments
    • Figure 3.1: QR vs Contactless - Strengths & Weaknesses
    • 3.2.1 NFC Mobile Payments
    • 3.2.2 QR Code Payments
  • 3.3 Wearable Payments
    • Figure 3.2: Types of Smart Wearables Capable of Making Contactless Payments
    • Figure 3.3: Wearable Devices Capable of Making Contactless Payments - Installed Base (m), Global,
    • i. Key Developments
    • ii. Juniper Research's View
  • 3.4 Ticketing
    • i. Key Developments
    • 3.4.2 Future Outlook: Contactless Ticketing

4. Regional Analysis

  • 4.1 North America
    • 4.1.1 US
      • i. Current Deployment Level
      • ii. Future Outlook
        • Figure 4.1: US Contactless Payments Transaction Volume (m), 2022-2027
    • 4.1.2 Canada
    • i. Current Deployment Level
    • ii. Future Outlook
  • 4.2 West Europe
    • 4.2.1 Finland
      • i. Current Deployment Level
        • Figure 4.2: Contactless Payments Amongst Total Card Payments in Finland, 2014-2021
      • ii. Future Outlook
    • 4.2.2 Germany
      • i. Current Deployment Level
      • ii. Future Outlook
        • Figure 4.3: Germany's Contactless Payments Transaction Volume (2022-2027
    • 4.2.3 UK
      • i. Current Deployment Level
      • ii. Future Outlook
  • 4.3 Central & East Europe
    • 4.3.1 Czech Republic
      • i. Current Deployment Level
      • ii. Future Outlook
    • 4.3.2 Poland
      • i. Current Deployment Level
      • ii. Future Outlook
        • Figure 4.4: Poland's Contactless Payment Transaction Volume (m), 2022-2027
  • 4.4 Latin America
    • 4.4.1 Brazil
      • i. Current Deployment Level
      • ii. Future Outlook
        • Figure 4.5: Brazil's Contactless Payment Transaction Volume (m), 2022-2027
    • 4.4.2 Mexico
      • i. Current Deployment Level
      • ii. Future Outlook
  • 4.5 Far East & China
    • 4.5.1 China
      • i. Current Deployment Level
      • ii. Future Outlook
    • 4.5.2 Japan
      • i. Current Deployment Level
      • ii. Future Outlook
        • Figure 4.6: Japan's Contactless Payment Transaction Volume (m), 2022-2027
  • 4.6 Indian Subcontinent
    • 4.6.1 India
      • i. Current Deployment Level
      • ii. Future Outlook
    • 4.6.2 Pakistan
      • i. Current Deployment Level
      • ii. Regulatory Considerations
      • iii. Future Outlook
        • Figure 4.7: Pakistan's Contactless Payment Transaction Volume (m), 2022-2027
  • 4.7 Rest of Asia Pacific
    • 4.7.1 Australia
      • i. Current Deployment Level
      • ii. Future Outlook
    • 4.7.2 New Zealand
      • i. Current Deployment Level
      • ii. Future Outlook
        • Figure 4.8: New Zealand's Contactless Payments Transaction Volume (m), 2022-2027
  • 4.8 Africa & Middle East
    • 4.8.1 South Africa
      • i. Current Deployment Level
      • ii. Future Outlook
        • Figure 4.9: South Africa's Contactless Payment Transaction Volume (m), 2022-2027
    • 4.8.2 United Arab Emirates
      • i. Current Deployment Level
      • ii. Future Outlook
  • Endnotes

Competitor Leaderboard

1. Competitive Landscape & Leaderboard

  • 1.1 Why Read This Report
    • Table 1.1: Juniper Research Competitor Leaderboard: Contactless Payment Vendors Included & Product Portfolio
    • Figure 1.2: Juniper Research Contactless Payments Vendors Competitor Leaderboard
    • Table 1.3: Juniper Research Leaderboard: Contactless Payments Vendors & Positioning
    • Table 1.4: Juniper Research Competitor Leaderboard Heatmap: Contactless Payments Vendors
  • 1.2 Vendor Profiles
    • 1.2.1 CPI Card Group
      • i. Corporate
        • Table 1.5: CPI Card Group's Financial Snapshot, $m, FY 2020-2021
      • ii. Geographic Spread
      • iii. Key Clients & Strategic Partnerships
      • iv. High-level View of Offerings
      • v. Juniper Research's View: Key Strengths & Strategic Development Opportunities
    • 1.2.2 DIGISEQ
      • i. Corporate
      • ii. Geographic Spread
      • iii. Key Clients & Strategic Partnerships
      • iv. High-level View of Offerings
      • v. Juniper Research's View: Key Strengths & Strategic Development Opportunities
    • 1.2.3 FIDESMO
      • i. Corporate
      • ii. Geographic Spread
      • iii. Key Clients & Strategic Partnerships
      • iv. High-level View of Offerings
      • v. Juniper Research's View: Key Strengths & Strategic Development Opportunities
    • 1.2.4 Giesecke+Devrient
      • i. Corporate
        • Table 1.6: G+D's Financial Snapshot ($m), FY 2020-2021
      • ii. Geographic Spread
      • iii. Key Clients & Strategic Partnerships
      • iv. High-level View of Offerings
      • v. Juniper Research's View: Key Strengths & Strategic Development Opportunities
    • 1.2.5 Goldpac
      • i. Corporate
        • Table 1.7: Goldpac's Financial Snapshot, $m, FY 2020-2021
      • ii. Geographic Spread
      • iii. Key Clients & Strategic Partnerships
      • iv. High-level View of Offerings
      • v. Juniper Research's View: Key Strengths & Strategic Development Opportunities
    • 1.2.6 HID Global
      • i. Corporate
      • ii. Geographic Spread
      • iii. Key Clients & Strategic Partnerships
      • iv. High-level View of Offerings
      • v. Juniper Research's View: Key Strengths & Strategic Development Opportunities
    • 1.2.7 IDEMIA
      • i. Corporate
      • ii. Geographic Spread
      • iii. Key Clients & Strategic Partnerships
      • iv. High-level View of Offerings
      • v. Juniper Research's View: Key Strengths & Strategic Development Opportunities
    • 1.2.8 Kona I
      • i. Corporate
        • Table 1.8: Kona I's Financial Snapshot, $m, FY 2020-2021
      • ii. Geographic Spread
      • iii. Key Clients & Strategic Partnerships
      • iv. High-level View of Offerings
      • v. Juniper Research's View: Key Strengths & Strategic Development Opportunities
    • 1.2.9 MATICA
      • i. Corporate
      • ii. Geographic Spread
      • iii. Key Clients & Strategic Partnerships
      • iv. High-level View of Offerings
      • v. Juniper Research's View: Key Strengths & Strategic Development Opportunities
    • 1.2.10 Netcetera
      • i. Corporate
      • ii. Geographic Spread
      • iii. Key Clients & Strategic Partnerships
      • iv. High-level View of Offerings
      • v. Juniper Research's View: Key Strengths & Strategic Development Opportunities
    • 1.2.11 Payair
      • i. Corporate
      • ii. Geographic Spread
      • iii. Key Clients & Strategic Partnerships
      • iv. High-level View of Offerings
      • v. Juniper Research's View: Key Strengths & Strategic Development Opportunities
    • 1.2.12 Pri-Num
      • i. Corporate
      • ii. Geographic Spread
      • iii. Key Clients & Strategic Partnerships
      • iv. High-level View of Offerings
      • v. Juniper Research's View: Key Strengths & Strategic Development Opportunities
    • 1.2.13 Thales
      • i. Corporate
        • Table 1.9: Thales' Financial Snapshot, $m, FY 2020-2021
      • ii. Geographic Spread
      • iii. Key Clients & Strategic Partnerships
      • iv. High-level View of Offerings
      • v. Juniper Research's View: Key Strengths & Strategic Development Opportunities
    • 1.2.14 Toppan Gravity
      • i. Corporate
        • Table 1.10: Toppan Group's Consolidated Financial Snapshot, $m, FY 2020-2021
      • ii. Geographic Spread
      • iii. Key Clients & Strategic Partnerships
      • iv. High-level View of Offerings
      • v. Juniper Research's View: Key Strengths & Strategic Development Opportunities
    • 1.2.15 Zwipe
      • i. Corporate
        • Table 1.11: Zwipe Group's Financial Snapshot, $m, FY 2020-2021
      • ii. Geographic Spread
      • iii. Key Clients & Strategic Partnerships
      • iv. High-level View of Offerings
      • v. Juniper Research's View: Key Strengths & Strategic Development Opportunities

Juniper Research Leaderboard Assessment Methodology

  • Limitations & Interpretations
    • Table 1.12: Juniper Research Competitor Leaderboard Assessment Criteria

Data & Forecasting

1. Methodology and Assumptions

  • 1.1 Methodology & Assumptions
    • Figure 1.1: Contactless Card Forecast Methodology
    • Figure 1.2: NFC Mobile & Wearable Retail Payments Market Forecast Methodology
    • Figure 1.3: NFC Mobile Ticketing Forecast Methodology
    • Figure 1.4: Contactless Mobile Payment Tokenisation Methodology

2. Forecast Summary

  • 2.1 Contactless Payments Usage Forecasts
    • 2.1.1 Contactless Mechanism: Cards, Mobiles and Wearables
      • Figure & Table 2.1: Number of Contactless Devices or Cards in Use for Payments (m), Split by Payment Mechanism, 2022-2027
    • 2.1.2 Mobile Wallet Contactless Service: Apple Pay, Samsung Pay, Google Pay, Operator-controlled SE, Other-HCE & FeliCa
      • Figure & Table 2.2: Number of Mobile Devices Used for Contactless Payments (m), Split by Payment Provider, 2022-2027
  • 2.2 Contactless Transaction Forecasts
    • 2.2.1 Total Contactless Transaction Volume: Retail Payments & Ticketing
      • Figure & Table 2.3: Total Number of Contactless Transactions (m), Split by Retail Payments & Ticketing, 2022-2027
    • 2.2.2 Total Contactless Transaction Value: Retail Payments & Ticketing
      • Figure & Table 2.4: Total Contactless Transaction Value ($m), Split by Retail Payments & Ticketing, 2022-2027

3. Contactless Card Payments

  • 3.1 Contactless Cards Usage Forecasts
    • 3.1.1 Contactless Payment Cards in Use
      • Figure & Table 3.1: Number of Contactless Payment Cards Used for Contactless Payment (m), Split by 8 Key Regions, 2022-2027
  • 3.2 Contactless Cards Transaction Forecasts
    • 3.2.1 Total Transaction Volume
      • Figure & Table 3.2: Total Number of Contactless Card Transactions per annum (m), Split by 8 Key Regions, 2022-2027
    • 3.2.2 Total Transaction Value
      • Figure & Table 3.3: Total Value of Contactless Card Transactions per annum ($m), Split by 8 Key Regions, 2022-2027

4. Mobile Contactless Payments

  • 4.1 Contactless Mobile Usage Forecast
    • 4.1.1 NFC-enabled Handsets in Use for Contactless Payments
      • Figure & Table 4.1: Number of NFC-enabled Handsets (including FeliCa) Using Contactless Payments (m), Split by 8 Key Regions, 2022-2027
    • 4.1.2 Number of OEM-Pay Contactless Users
      • Figure & Table 4.2: Number of OEM-Pay Contactless Users (m), Split by Apple Pay, Samsung Pay, Google Pay & Other OEM-Pay, 2022-2027
    • 4.1.3 Contactless Mobile Retail Payment Transaction Volume
      • Figure & Table 4.3: Total Number of Contactless Mobile Retail Payments Transaction Volume per annum (m), Split by 8 Key Regions, 2022-2027
    • 4.1.4 Contactless Mobile Retail Payment Transaction Value
      • Figure & Table 4.4: Total Value of NFC Retail Payments Transactions ($m), Split by 8 Key Regions, 2022-2027

5. Wearable Contactless Payments

  • 5.1 Smart Wearables Contactless Payment Usage Forecasts
    • 5.1.1 Wearables Making Contactless Payments
      • Figure & Table 5.1: Number of Active Smart Wearable Devices Making Contactless Payments per annum (m), Split by 8 Key Regions, 2022-2027
  • 5.2 Smart Wearables Contactless Payment Transaction Forecasts
    • 5.2.1 Smart Wearables Contactless Payment Transaction Volume
      • Figure & Table 5.2: Smart Wearable Contactless Payment Transaction Volume per annum (m), Split by 8 Key Regions, 2022-2027
    • 5.2.2 Smart Wearable Contactless Payment Transaction Value
      • Figure & Table 5.3: Total Smart Wearable Contactless Payment Transaction Values ($m), Split by 8 Key Regions, 2022-2027

6. NFC Ticketing

  • 6.1 NFC Ticketing Usage Forecasts
    • 6.1.1 NFC Ticketing Users
      • Figure & Table 6.1: Mobile Phone Users Who Use NFC Ticketing (m), Split by 8 Key Regions, 2022-2027
    • 6.1.2 NFC Ticketing Transaction Volume
      • Figure & Table 6.2: Number of NFC Tickets Delivered or Validated Transaction Volume (m), Split by 8 Key Regions, 2022-2027
    • 6.1.3 NFC Ticketing Transaction Value
      • Figure & Table 6.3: Total Transaction Value for NFC Tickets Purchased or Validated per annum ($m), Split by 8 Key Regions, 2022-2027

7. Contactless Tokenisation

  • 7.1 Contactless Tokenisation Forecasts
    • 7.1.1 Contactless Tokenisation Volume
      • Figure & Table 7.1: Number of Contactless Payments That Are Tokenised per annum (m), Split by 8 Key Regions, 2022-2027
    • 7.1.2 Contactless Tokenisation Revenue
      • Figure & Table 7.2: Contactless Tokenisation Revenue per annum ($m), Split by Key Regions, 2022-2027