
eコマース決済市場:2025-2030年
eCommerce Payments Market: 2025-2030- 発行日
- ページ情報
- 英文
- 納期
- 即日から翌営業日
- 商品コード
- 1802910
- 翻訳ツール提供対象 PDF対応AI翻訳ツールの無料貸し出しサービスのご利用が可能です
- 通信/IT関連専門 通信/IT関連専門を専門とする市場調査会社です。
概要
関連レポート
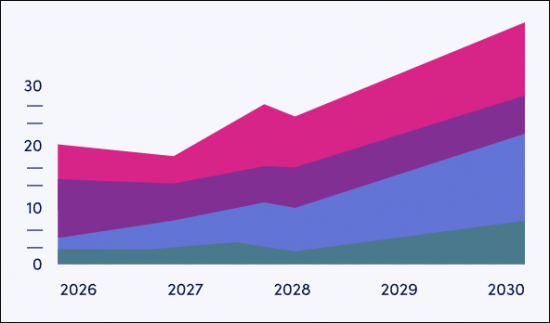
"世界のeコマース市場は2030年までに13兆ドルを突破、Stripe、Visa、PayPalが牽引"
| 主要統計 | |
|---|---|
| 2025年の総取引額: | 83億米ドル |
| 2030年の総取引額 | 130億米ドル |
| 2025年から2030年の市場成長率 | 57% |
| 予測期間 | 2025-2030年 |
概要
当調査スイートは、eコマース決済市場に関する包括的かつ洞察に富んだ分析を提供し、eコマース決済プラットフォーム事業者から商業者、決済サービスプロバイダーに至るまで、ステークホルダーが将来の成長、主要動向、競争環境を理解できるよう構成されています。
本調査スイートには、個別に購入可能ないくつかのオプションが含まれています。「市場動向と戦」では、新しい決済手段やeコマースモデルを含む、eコマース決済における主要な変革とイノベーションの分野についての洞察ある分析を提供しています。さらに、Juniper Researchの国別準備指数も収録されており、61の国・地域におけるeコマース決済の現在および将来の機会を国別に分析しています。「データ&予測」では、今後5年間のeコマース決済市場の普及と今後の成長を、デジタル商品取引と物理的商品取引、8つの主要決済手段別にマッピングしたデータにアクセスできます。また、競合リーダーボードでは、マーケットリーダー20社を幅広く分析し、その能力と製品内容に基づいて各ベンダーを位置づけています。
本レポートはすべて英語で作成されています。
主な特徴
- 主要な要点と戦略的提言:eコマース決済プラットフォーム、加盟店、決済サービスプロバイダー、銀行向けに、主要な成長機会、重要な調査結果、戦略的提言についての詳細な分析を提供します。
- 市場の展望:eコマース決済市場における主要動向や市場拡大に伴う課題についての洞察を提示し、人気のある決済手段における消費者動向、取引手数料に関する課題、決済手段の変化傾向、決済プロセッサーが相互運用性をどのように促進できるか、オンライン決済プロセッサーが直面する課題と機会を明らかにします。さらに、エージェンティックコマースなどの新しい動向分析も含みます。本調査には、61カ国にわたるeコマース決済市場の現状の発展状況やセグメント別成長を分析した国別準備指数と、将来の市場見通しも収録されています。また、主要61カ国のeコマースペイメント市場の現在の開拓状況と成長セグメントに関する国別準備指数を掲載し、将来の展望も示しています。
- ベンチマーク業界予測:デジタル商品および物理的商品の両チャネルにおけるeコマース取引の総額および取引件数に関する広範な予測を提示します。この予測は、決済タイプ別 (A2A決済、BNPL〔後払い〕、現金、クレジットカード、デビットカード、デジタルウォレット、キャリア課金、その他) に細分化されています。
- Juniper Researchの競合リーダーボード:eコマース決済プラットフォーム主要20社の能力とキャパシティを評価します。
サンプルビュー
市場データ&予測レポート
サンプル
市場動向&戦略レポート
市場データ&予測レポート
本調査スイートには、152の表と54,000を超えるデータポイントの予測データ一式へのアクセスが含まれています。
- eコマース市場の総取引量および総取引額
- 物理的商品およびデジタル商品の各チャネルにおける総取引量と取引額
- オンラインおよびモバイル経由で購入された商品
- eコマース取引の総取引量および総取引額
- さまざまな決済手段による購入内訳
- アカウント間 (A2A) 決済
- BNPL (Buy Now, Pay Later/後払い)
- 現金代理人&同等手段
- クレジットカード
- デビットカード
- デジタルウォレット
- キャリア課金 (Direct Carrier Billing)
- その他
Juniper Researchのインタラクティブ予測 (Excel) には以下の機能があります:
- 統計分析:データ期間中のすべての地域と国について表示されます。グラフは簡単に変更でき、クリップボードにエクスポートできます。
- 国別データツール:予測期間中のすべての地域と国の指標を見ることができます。検索バーで表示する指標を絞り込むことができます。
- 国別比較ツール:国を選択して比較することができます。グラフをエクスポートする機能が含まれています。
- What-if分析:5つのインタラクティブシナリオを通じて、ユーザーは予測の前提条件と比較することができます。
競合リーダーボードレポート
対象ベンダー20社:
|
|
目次
市場動向&戦略
第1章 重要ポイントと戦略的提言
- 重要ポイント
- 戦略的提言
第2章 市場情勢
- イントロダクションと定義
- eコマース決済とeコマース決済の歴史
- eコマース決済市場の主要企業
- 決済スタックの理解:ゲートウェイ、アクワイアラー、プロセッサー、PSP
- アクワイアラーとPayFac:インフラ、エネーブルメント、埋め込み型モデルへのシフト
- 決済オーケストレーションプラットフォーム:コネクターから戦略的制御レイヤーへ
- eコマース業界
- B2B eコマース:プラットフォーム変革における決済の隠れた役割
- 顧客間 (CC) リコマース:決済が支える新たなプラットフォーム動向
- ソーシャルコマース:決済が支える新興プラットフォームの動向
- 主な動向と促進要因
第3章 セグメント分析
- 支払い方法の情勢
- 概要
- アカウント間 (A2A) 決済
- カード決済
- クレジットカード
- デビットカード
- プリペイドカード
- eコマース決済におけるカード決済の展望
- デジタルウォレット
- カード連携ウォレット
- カード非連携ウォレット
- 今後の展望
- キャリア決済 (DCB)
- BNPL
- 現金ベースのeコマース決済
- デジタル資産とトークンベースの決済:暗号通貨、ステーブルコイン、CBDC
- 暗号通貨:まだニッチだが、特定の分野では有用
- ステーブルコイン:越境商取引で勢いを増す
- 中央銀行デジタル通貨 (CBDC) :まだ実験段階だが有望
- 展望:eコマース決済におけるデジタル資産はイデオロギー的ではなく実用的
- eコマース決済市場セグメンテーション
- 大手多国籍eコマース企業
- 全国的なeコマースブランド
- 小規模eコマース企業
- 業種別eコマース決済
- i.展望:戦略的成長のてことしての決済
第4章 国別準備指数
- 国別準備指数:イントロダクション
- インデックス分析
競合リーダーボード
第1章 重要ポイントと戦略的提言
- 重要ポイント
- 戦略的提言
第2章 市場情勢
- イントロダクションと定義
- eコマース決済とeコマース決済の歴史
- eコマース決済市場における主要企業
- 決済スタックの理解:ゲートウェイ、アクワイアラー、プロセッサー、PSP
- アクワイアラーとPayFac:インフラ、エネーブルメント、埋め込み型モデルへのシフト
- 決済オーケストレーションプラットフォーム:コネクターから戦略的制御レイヤーへ
- eコマース業界
- B2B eコマース:プラットフォーム変革における決済の隠れた役割
- 顧客間 (CC) リコマース:決済が支える新たなプラットフォーム動向
- ソーシャルコマース:決済が支える新興プラットフォームの動向
- 主な動向と促進要因
- グローバル決済における戦略的手段としてのローカルアクワイアリング
- サブスクリプション経済における継続課金:インフラによって可能となる大規模かつ高信頼性の実現
- 規制の変更
- 2025年のeコマース決済における成長機会
- 2025年のeコマース決済の課題
第3章 セグメント分析
- 決済方法の情勢
- 概要
- アカウント間 (A2A) 決済
- カード決済
- デジタルウォレット
- キャリア課金 (DCB)
- BNPL (後払い)
- 現金ベースのeコマース決済
- デジタル資産とトークンベースの決済:暗号通貨、ステーブルコイン、CBDC
- eコマース決済市場セグメンテーション
- 大手多国籍eコマース企業
- 国内eコマースブランド
- 中小規模eコマース事業者
- 業種特化型eコマース決済
第4章 国別準備指数
- 国別準備指数:イントロダクション
- インデックス分析
データ&予測
第1章 市場概要・予測
第2章 市場予測のサマリー
- eコマース市場の総取引量:地域別
- eコマース市場の総取引額
- eコマース市場の総取引額:決済方法別
- モバイルコマースの取引総額
- eコマース決済のゲートウェイ総収益
第3章 市場予測:物理的商品のリモート決済
- 物理的商品のリモート購入者数 (ユニーク購入者数)
- 物理的商品のリモート取引総量
- 物理的商品のリモート取引総額
- オンライン物理的商品販売による年間ゲートウェイ収益
- 物理的商品のリモート取引件数:決済方法別
- 物理的商品のリモート取引総額:決済タイプ別
第4章 市場予測:デジタル商品のリモート決済
- デジタル商品のリモート購入者数 (ユニーク購入者数)
- デジタル商品販売のリモート取引総量
- デジタル商品販売のリモート取引総額
- デジタル商品のリモート取引件数:決済方法別
- デジタル商品のリモート販売によるゲートウェイ収益
eコマース決済市場:2025-2030年
- 発行日
- 発行
- Juniper Research Ltd
- ページ情報
- 英文
- 納期
- 即日から翌営業日