|
|
市場調査レポート
商品コード
1988225
エピタキシャルウエハー市場:素材別、ウエハーサイズ別、用途別、業界別―2026年~2032年の世界市場予測Epitaxial Wafer Market by Material Type, Wafer Size, Application, Industry Vertical - Global Forecast 2026-2032 |
||||||

|
|||||||
カスタマイズ可能
適宜更新あり
|
|||||||

| エピタキシャルウエハー市場:素材別、ウエハーサイズ別、用途別、業界別―2026年~2032年の世界市場予測 |
|
出版日: 2026年03月17日
発行: 360iResearch
ページ情報: 英文 192 Pages
納期: 即日から翌営業日
|

概要
エピタキシャルウエハー市場は、2025年に44億9,000万米ドルと評価され、2026年には49億8,000万米ドルに成長し、CAGR11.35%で推移し、2032年までに95億4,000万米ドルに達すると予測されています。
| 主な市場の統計 | |
|---|---|
| 基準年2025 | 44億9,000万米ドル |
| 推定年2026 | 49億8,000万米ドル |
| 予測年2032 | 95億4,000万米ドル |
| CAGR(%) | 11.35% |
エピタキシャルウエハーの基礎、生産の促進要因、およびデバイス製造を変革する戦略的技術能力に関する明確かつ権威ある指針
エピタキシャルウエハーは、次世代の高性能電子・フォトニックデバイスの基盤となる基板層を形成し、デバイスの効率、信頼性、および熱性能に直接影響を与える結晶成長を制御することを可能にします。材料科学、成膜技術、およびプロセス制御の進歩により、商用化可能なエピタキシャル材料の選択肢は、従来のシリコンを超えて拡大し、パワー、無線周波数、フォトニクス、およびセンシング用途の厳しい要件を満たす化合物半導体やワイドバンドギャップ材料が含まれるようになりました。
材料イノベーション、サプライチェーンの再構築、そしてアプリケーション主導の需要が融合し、エピタキシャルウエハーの市場環境とサプライヤーエコシステムをいかに急速に再定義しているか
エピタキシャルウエハー市場の環境は、材料イノベーション、アプリケーション需要、地政学的政策という複数の要因が相まって、変革的な変化を遂げつつあります。材料の多様化は加速しています。サプライヤーが欠陥制御や歩留まり管理における従来の障壁を克服するにつれ、ワイドバンドギャップ半導体はニッチな存在から主流へと移行しつつあります。一方、ヘテロジニアス統合のアプローチにより、化合物半導体とシリコンプラットフォームを融合させたハイブリッドスタックが推進され、様々な使用事例において性能の最適化が図られています。
最近の米国の関税および貿易政策措置が、ウエハーサプライチェーンにおける調達戦略、投資計画、および事業継続性にもたらす累積的な影響を評価する
米国発の最近の関税措置や貿易政策の転換は、調達経済、契約条件、戦略的投資判断に影響を与えることで、エピタキシャルウエハーのエコシステムに累積的な影響を及ぼしています。関税や関連する輸出規制によって国境を越えた材料の流れのコストや複雑さが増した地域では、メーカーは代替調達戦略を追求し、新規サプライヤーの認定期間を延長し、利益率への圧力を緩和するために商業条件の見直し交渉を行っています。
材料選定、ウエハー径の選択、用途の優先順位、および業界ごとの要件がどのように相まって、サプライヤーとバイヤーの意思決定を形作っているかを明らかにする詳細なセグメンテーション分析
セグメンテーションの知見は、材料の種類、ウエハーサイズ、アプリケーション領域、および業界セグメントにわたる、微妙な性能基準と戦略的優先順位を明らかにします。ガリウムヒ素、窒化ガリウム、リン化インジウム、シリコン、炭化ケイ素、シリコン・ゲルマニウムなどの材料の種類ごとに検討すると、それぞれの化学組成は、電子移動度、熱伝導率、欠陥許容度、および加工の複雑さの間で独自のトレードオフを示しており、それに応じたエピタキシャルアプローチと品質管理が必要となります。
主要地域における生産能力の動向、規制環境、イノベーション・エコシステムが、エピタキシャルウエハーの調達および認定戦略にどのような影響を与えているか
地域ごとの動向は、南北アメリカ、欧州・中東・アフリカ、アジア太平洋地域における生産能力の拡大、技術の採用、およびサプライチェーンのリスク管理に多大な影響を及ぼしています。南北アメリカ地域は、現地での加工への積極的な投資と、戦略的用途における国内サプライチェーンの安全確保への強い重視が特徴であり、これにより、ウエハーサプライヤー、デバイスメーカー、そしてレジリエンスの構築を目指す政府主導のイニシアチブとの間の緊密な連携が支えられています。
エピタキシャルウエハーのサプライチェーンにおいて、主要企業が長期的な優位性を確保するために、規模の拡大、技術的な差別化、および協業パートナーシップをどのように両立させているかについての洞察
主要企業間の競合動向からは、二本立てのアプローチが示されています。すなわち、汎用化された基板については規模拡大への投資を行う一方で、先端材料やニッチな用途については専門的なプロセス能力を維持するというものです。業界関係者は、認定期間の短縮や、表面形態、ドーピングの均一性、欠陥抑制といったウエハーの性能特性を向上させるプロセスレシピの共同開発を目的として、装置サプライヤーやファウンダリとの技術提携を強化しています。
業界リーダーが供給のレジリエンスを強化し、認定を加速させ、進化する材料および用途の優先順位に合わせてウエハー投資を調整するための実行可能な戦略的ステップ
業界リーダーは、短期的な事業継続性と長期的な技術的競争力のバランスをとる、調整された戦略を追求すべきです。まず、企業はサプライヤーの認定枠組みを強化し、重要なエピタキシャル材料についてデュアルソーシング体制を導入し、単一障害点への依存度を低減すると同時に、認定ベンダー間での性能の一貫性を維持する必要があります。
専門家への一次インタビュー、技術的検証、および三角測量による二次分析を組み合わせた包括的な混合手法による調査アプローチにより、信頼性の高い戦略的知見を導出
本調査手法では、1次調査と2次調査を統合し、厳格な技術的検証を行うことで、堅牢かつ実用的な知見を確保します。1次調査は、ウエハーメーカー、デバイスインテグレーター、装置サプライヤー、調達責任者に対する構造化インタビューで構成され、材料科学者やプロセスエンジニアとの技術ブリーフィングによって補完され、性能上のリスク要因や認定スケジュールを検証します。
技術の進歩、供給のレジリエンス、戦略的パートナーシップがいかにしてエピタキシャルウエハーのエコシステムにおける競争優位性を決定づけるかを強調した簡潔な要約
エピタキシャルウエハーは、次世代のデバイス革新の中核をなすものであり、材料の選定、ウエハーのサイズ、および認定戦略をエンド市場の需要に合わせて調整する利害関係者が競争優位性を確保することになります。ワイドバンドギャップ材料やハイブリッド集積アプローチにおける技術的進歩が能力の限界を拡大している一方で、サプライチェーンの動向や政策環境は、現実的なレジリエンス計画と戦略的連携を必要としています。
よくあるご質問
目次
第1章 序文
第2章 調査手法
- 調査デザイン
- 調査フレームワーク
- 市場規模予測
- データ・トライアンギュレーション
- 調査結果
- 調査の前提
- 調査の制約
第3章 エグゼクティブサマリー
- CXO視点
- 市場規模と成長動向
- 市場シェア分析, 2025
- FPNVポジショニングマトリックス, 2025
- 新たな収益機会
- 次世代ビジネスモデル
- 業界ロードマップ
第4章 市場概要
- 業界エコシステムとバリューチェーン分析
- ポーターのファイブフォース分析
- PESTEL分析
- 市場展望
- GTM戦略
第5章 市場洞察
- コンシューマー洞察とエンドユーザー視点
- 消費者体験ベンチマーク
- 機会マッピング
- 流通チャネル分析
- 価格動向分析
- 規制コンプライアンスと標準フレームワーク
- ESGとサステナビリティ分析
- ディスラプションとリスクシナリオ
- ROIとCBA
第6章 米国の関税の累積的な影響, 2025
第7章 AIの累積的影響, 2025
第8章 エピタキシャルウエハー市場:素材タイプ別
- ガリウムヒ素
- 窒化ガリウム
- リン化インジウム
- シリコン
- 炭化ケイ素
- シリコン・ゲルマニウム
第9章 エピタキシャルウエハー市場:ウエハーサイズ別
- 100mm
- 150mm
- 200mm
- 300mm
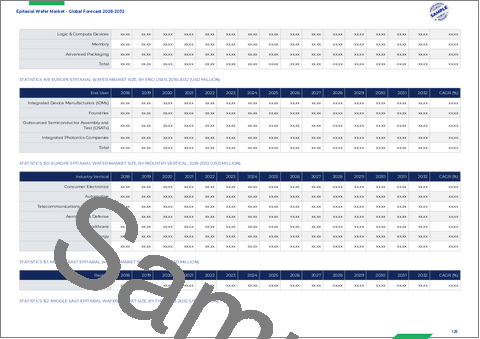
第10章 エピタキシャルウエハー市場:用途別
- 発光ダイオード
- マイクロエレクトロメカニカルシステム
- フォトニクス
- パワー半導体
- 高周波デバイス
第11章 エピタキシャルウエハー市場:業界別
- 航空宇宙・防衛
- 自動車
- 民生用電子機器
- 産業用・医療用電子機器
- 通信・ネットワーク
第12章 エピタキシャルウエハー市場:地域別
- 南北アメリカ
- 北米
- ラテンアメリカ
- 欧州・中東・アフリカ
- 欧州
- 中東
- アフリカ
- アジア太平洋地域
第13章 エピタキシャルウエハー市場:グループ別
- ASEAN
- GCC
- EU
- BRICS
- G7
- NATO
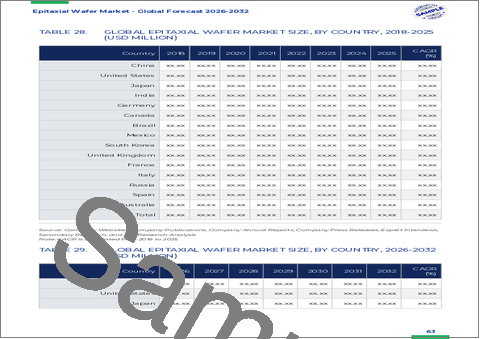
第14章 エピタキシャルウエハー市場:国別
- 米国
- カナダ
- メキシコ
- ブラジル
- 英国
- ドイツ
- フランス
- ロシア
- イタリア
- スペイン
- 中国
- インド
- 日本
- オーストラリア
- 韓国
第15章 米国エピタキシャルウエハー市場
第16章 中国エピタキシャルウエハー市場
第17章 競合情勢
- 市場集中度分析, 2025
- 集中比率(CR)
- ハーフィンダール・ハーシュマン指数(HHI)
- 最近の動向と影響分析, 2025
- 製品ポートフォリオ分析, 2025
- ベンチマーキング分析, 2025
- Acken Optoelectronics
- ASM International N.V.
- Beijing Grish Hitech Co., Ltd.
- Coherent Corporation
- Electronics and Materials Corporation
- EPI Solution Technology
- Intego GmbH
- IntelliEPI Inc.
- IQE PLC
- JEJE Deutschland GmbH
- JXT Technology Co., Ltd.
- Okmetic Oyj
- PlutoSemi Co., Ltd.
- Resonac Corporation by Showa Denko K. K.
- Shin-Etsu Chemical Co., Ltd.
- Silicon Materials, Inc.
- Siltronic AG
- SK Siltron Co., Ltd.
- Stanford Advanced Materials
- Sumco Corporation
- Sumitomo Electric Industries, Ltd.
- VIGO Photonics S.A.
- Wafer Works(Shanghai)Co., Ltd.
- WaferPro, Inc.
- Western Minmetals(SC)Corporation
- Xiamen Powerway Advenced Materials Co., Ltd.
