|
|
市場調査レポート
商品コード
1677160
アグリテック市場:タイプ別、最終用途産業別-2025-2030年の世界予測Agritech Market by Type, End Use Industry - Global Forecast 2025-2030 |
||||||
|
|||||||
カスタマイズ可能
適宜更新あり
|
|||||||


| アグリテック市場:タイプ別、最終用途産業別-2025-2030年の世界予測 |
|
出版日: 2025年03月09日
発行: 360iResearch
ページ情報: 英文 190 Pages
納期: 即日から翌営業日
|

全表示
- 概要
- 図表
- 目次
アグリテック市場は、2024年に27億米ドルと評価され、2025年には29億6,000万米ドル、CAGR 10.02%で成長し、2030年には47億9,000万米ドルに達すると予測されています。
| 主な市場の統計 | |
|---|---|
| 基準年 2024 | 27億米ドル |
| 推定年 2025 | 29億6,000万米ドル |
| 予測年 2030 | 47億9,000万米ドル |
| CAGR(%) | 10.02% |
今日の農業技術は、テクノロジーの進歩と市場力学の変化により、かつてないペースで進化しています。新しく革新的なソリューションは、科学、テクノロジー、データ主導の管理を統合することで、農業の展望を再構築しています。この10年間で、従来の慣行から、調査、精密技術、革新的な自動化システムを活用した近代的アプローチへの転換が見られました。この進化は、単に収量を向上させるだけでなく、持続可能性を確保し、気候の課題に対処し、農業バリューチェーン全体を合理化することでもあります。
デジタルツールの統合により、農家や農学者から政策立案者やサプライチェーンの専門家に至るまで、農業セクター全体の利害関係者が情報に基づいた意思決定を行えるようになっています。強化された接続性、予測分析、堅牢なハードウェア・ソリューションが一体となって、破壊のための肥沃な土壌を作り出しています。このような動向は、農業生産性のベンチマークを再定義するために、テクノロジー開発者、業界専門家、およびエンド・ユーザーが協力して取り組むことを促しています。
本レポートは、こうした変化の原動力を理解するための舞台を整え、新たな技術的・戦略的イニシアティブが農業技術をいかに強固でダイナミックな市場に変えたかを明らかにします。そして、新たな動向、戦略的洞察、将来の可能性を探るための土台を築きました。要するに、この入門的な探求は、テクノロジーを駆使した未来の課題と機会を満たすために急速に進化しつつあるセクターを評価するための枠組みを確立するものです。
アグリテック進化の転換期
アグリテック・セクターは、世界中で農業プロセスの実行方法に革命をもたらす変革的シフトを経験しています。デジタル技術の融合と持続可能性の強化が急務となる中、業界関係者は従来の手法を見直し、革新的な手法を取り入れつつあります。
この変革の中心的な原動力のひとつは、作物の健康状態、気象予測、土壌状態に関するリアルタイムの洞察を提供する高度なデータ分析の統合です。このリアルタイム情報は精密農業を促進し、収量を増加させながらコストを削減する可能性を秘めています。革命はデータだけにとどまらないです。ロボット工学、人工知能、コネクティビティが、作業を合理化し資源の浪費を最小限に抑える現代農業システムのバックボーンを形成しています。
もうひとつの大きな変化は、持続可能な慣行への推進です。化学物質の投入を減らし、バイオベースの解決策を採用する動きが明確になっています。水分レベルを監視するコネクテッド・センサーや、配水を最適化する自動化システムなど、かつては未来的と思われた技術も、今では具体的なツールとなっています。さらに、バイオテクノロジーの導入やビッグデータプラットフォームの活用により、農家は環境条件の変化に効率的に適応できるようになりました。
こうした変化は、アグリテックのダイナミックな性質と、継続的な適応の必要性を強調しています。モバイル・ソリューションとコネクテッド・デバイスの統合は、洞察がほぼリアルタイムで行動に移される完全統合システムをさらにサポートします。その結果、業界情勢は技術的に高度化するだけでなく、経済と環境の両方の必要性を総合的に認識するようになっています。
セグメンテーションの洞察:市場内訳の分析
詳細なセグメンテーション分析により、市場調査はタイプ別と最終用途産業別に行われる二重構造の枠組みが明らかになりました。タイプに基づくセグメンテーションでは、ビッグデータ&アナリティクスからバイオテクノロジー&生化学まで、さらにモビリティまで、そしてセンサー&コネクテッドデバイスで締めくくる範囲を調査します。これらの各セグメントは、意思決定をサポートし、生産を最適化し、業務効率を確保する革新的なソリューションの育成に重要な役割を果たしています。特にビッグデータ解析の利用は、タイムリーな介入を知らせるきめ細かな洞察の提供に役立っており、一方バイオテクノロジーは作物強化のための新しい手法を育成しています。モビリティ・ソリューションとコネクテッド・デバイスの出現は、現代農業の堅牢性をさらに高め、プロセスのどの部分も監視されないままであることを保証します。
最終用途産業に焦点を移すと、市場は伝統的な農業と農薬を含むカテゴリーに分類され、バイオテクノロジーと屋内農業で観察される現代的な進歩も含まれます。分析はさらに、デジタル革新が顕著な影響を及ぼしている精密農業やスマート農業にも及んでいます。この包括的なアプローチは、投資家や意思決定者にとって重要なニュアンスの視点を提供します。具体的な市場の細分化を理解することで、ニッチなビジネスチャンスや急速に発展する分野を特定することができます。
このセグメンテーションから引き出される洞察は、テクノロジーと農業慣行の間の複雑な相互作用を浮き彫りにします。投資家やビジネスリーダーは、新たな動向を把握し、資源を効率的に配分し、各セグメントの多様な要件を反映したオーダーメイドの戦略を策定する上で、より有利な立場に立つことができます。このセグメンテーションは、急速に変化する環境において、的を絞ったイノベーションと戦略的開発の道を開くものです。
目次
第1章 序文
第2章 調査手法
第3章 エグゼクティブサマリー
第4章 市場の概要
第5章 市場洞察
- 市場力学
- 促進要因
- 持続可能なオーガニック食品の需要増加
- シームレスな農業サプライチェーン管理を可能にするデジタルプラットフォームの拡大
- 近代農業への取り組みに対する政府の支援と補助金
- 抑制要因
- 先進農業技術の初期投資と運用コストが高い
- 機会
- 精密農業とIoT統合における技術の進歩
- 垂直農業と制御環境農業への投資増加
- 課題
- デジタル農業プラットフォームにおけるサイバーセキュリティの懸念とデータプライバシーの問題
- 促進要因
- 市場セグメンテーション分析
- タイプ:アグリテックにおけるビッグデータと分析の利用の増加により、収益を最適化し、リソースの無駄を削減
- 最終用途産業:収穫量と持続可能性を最大化するための精密農業におけるアグリテックの使用が増加
- ポーターのファイブフォース分析
- PESTEL分析
- 政治的
- 経済
- 社会
- 技術的
- 法律上
- 環境
第6章 アグリテック市場:タイプ別
- ビッグデータと分析
- バイオテクノロジーと生化学
- モビリティ
- センサーと接続デバイス
第7章 アグリテック市場:最終用途産業別
- 農業
- 農薬
- バイオテクノロジー
- 屋内農業
- 精密農業
- スマート農業
第8章 南北アメリカのアグリテック市場
- アルゼンチン
- ブラジル
- カナダ
- メキシコ
- 米国
第9章 アジア太平洋地域のアグリテック市場
- オーストラリア
- 中国
- インド
- インドネシア
- 日本
- マレーシア
- フィリピン
- シンガポール
- 韓国
- 台湾
- タイ
- ベトナム
第10章 欧州・中東・アフリカのアグリテック市場
- デンマーク
- エジプト
- フィンランド
- フランス
- ドイツ
- イスラエル
- イタリア
- オランダ
- ナイジェリア
- ノルウェー
- ポーランド
- カタール
- ロシア
- サウジアラビア
- 南アフリカ
- スペイン
- スウェーデン
- スイス
- トルコ
- アラブ首長国連邦
- 英国
第11章 競合情勢
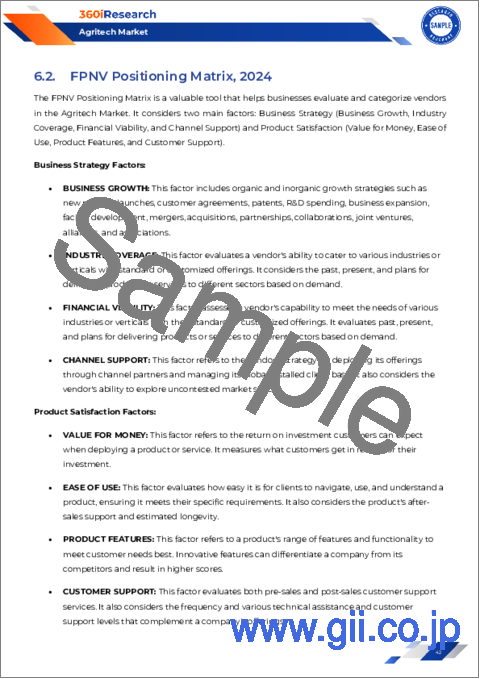
- 市場シェア分析, 2024
- FPNVポジショニングマトリックス, 2024
- 競合シナリオ分析
- 戦略分析と提言
企業一覧
- AeroFarms, Inc.
- AG Leader Technology, Inc.
- AGCO Corporation
- AgFunder, Inc.
- BASF SE
- Bayer AG
- CeresAI
- Corteva, Inc.
- Crofarm Agriproducts Pvt Ltd
- CropIn Technology Solutions Pvt. Ltd.
- CropX, Inc.
- Deere & Company
- Farmers Edge, Inc.
- Indigo Ag, Inc.
- Kubota Corporation
- Plenty Unlimited, Inc.
- Ripe Robotics Pty Ltd.
- SenseGrow Technologies Pvt. Ltd.
- Syngenta AG
- Taranis AgTech, Ltd.
- Trimble Inc.
- XAG Co., Ltd.
LIST OF FIGURES
- FIGURE 1. AGRITECH MARKET MULTI-CURRENCY
- FIGURE 2. AGRITECH MARKET MULTI-LANGUAGE
- FIGURE 3. AGRITECH MARKET RESEARCH PROCESS
- FIGURE 4. AGRITECH MARKET SIZE, 2024 VS 2030
- FIGURE 5. GLOBAL AGRITECH MARKET SIZE, 2018-2030 (USD MILLION)
- FIGURE 6. GLOBAL AGRITECH MARKET SIZE, BY REGION, 2024 VS 2025 VS 2030 (USD MILLION)
- FIGURE 7. GLOBAL AGRITECH MARKET SIZE, BY COUNTRY, 2024 VS 2025 VS 2030 (USD MILLION)
- FIGURE 8. GLOBAL AGRITECH MARKET SIZE, BY TYPE, 2024 VS 2030 (%)
- FIGURE 9. GLOBAL AGRITECH MARKET SIZE, BY TYPE, 2024 VS 2025 VS 2030 (USD MILLION)
- FIGURE 10. GLOBAL AGRITECH MARKET SIZE, BY END USE INDUSTRY, 2024 VS 2030 (%)
- FIGURE 11. GLOBAL AGRITECH MARKET SIZE, BY END USE INDUSTRY, 2024 VS 2025 VS 2030 (USD MILLION)
- FIGURE 12. AMERICAS AGRITECH MARKET SIZE, BY COUNTRY, 2024 VS 2030 (%)
- FIGURE 13. AMERICAS AGRITECH MARKET SIZE, BY COUNTRY, 2024 VS 2025 VS 2030 (USD MILLION)
- FIGURE 14. UNITED STATES AGRITECH MARKET SIZE, BY STATE, 2024 VS 2030 (%)
- FIGURE 15. UNITED STATES AGRITECH MARKET SIZE, BY STATE, 2024 VS 2025 VS 2030 (USD MILLION)
- FIGURE 16. ASIA-PACIFIC AGRITECH MARKET SIZE, BY COUNTRY, 2024 VS 2030 (%)
- FIGURE 17. ASIA-PACIFIC AGRITECH MARKET SIZE, BY COUNTRY, 2024 VS 2025 VS 2030 (USD MILLION)
- FIGURE 18. EUROPE, MIDDLE EAST & AFRICA AGRITECH MARKET SIZE, BY COUNTRY, 2024 VS 2030 (%)
- FIGURE 19. EUROPE, MIDDLE EAST & AFRICA AGRITECH MARKET SIZE, BY COUNTRY, 2024 VS 2025 VS 2030 (USD MILLION)
- FIGURE 20. AGRITECH MARKET SHARE, BY KEY PLAYER, 2024
- FIGURE 21. AGRITECH MARKET, FPNV POSITIONING MATRIX, 2024
LIST OF TABLES
- TABLE 1. AGRITECH MARKET SEGMENTATION & COVERAGE
- TABLE 2. UNITED STATES DOLLAR EXCHANGE RATE, 2018-2024
- TABLE 3. GLOBAL AGRITECH MARKET SIZE, 2018-2030 (USD MILLION)
- TABLE 4. GLOBAL AGRITECH MARKET SIZE, BY REGION, 2018-2030 (USD MILLION)
- TABLE 5. GLOBAL AGRITECH MARKET SIZE, BY COUNTRY, 2018-2030 (USD MILLION)
- TABLE 6. AGRITECH MARKET DYNAMICS
- TABLE 7. GLOBAL AGRITECH MARKET SIZE, BY TYPE, 2018-2030 (USD MILLION)
- TABLE 8. GLOBAL AGRITECH MARKET SIZE, BY BIG DATA & ANALYTICS, BY REGION, 2018-2030 (USD MILLION)
- TABLE 9. GLOBAL AGRITECH MARKET SIZE, BY BIOTECHNOLOGY & BIOCHEMICAL, BY REGION, 2018-2030 (USD MILLION)
- TABLE 10. GLOBAL AGRITECH MARKET SIZE, BY MOBILITY, BY REGION, 2018-2030 (USD MILLION)
- TABLE 11. GLOBAL AGRITECH MARKET SIZE, BY SENSORS & CONNECTED DEVICES, BY REGION, 2018-2030 (USD MILLION)
- TABLE 12. GLOBAL AGRITECH MARKET SIZE, BY END USE INDUSTRY, 2018-2030 (USD MILLION)
- TABLE 13. GLOBAL AGRITECH MARKET SIZE, BY AGRICULTURE, BY REGION, 2018-2030 (USD MILLION)
- TABLE 14. GLOBAL AGRITECH MARKET SIZE, BY AGROCHEMICALS, BY REGION, 2018-2030 (USD MILLION)
- TABLE 15. GLOBAL AGRITECH MARKET SIZE, BY BIOTECHNOLOGY, BY REGION, 2018-2030 (USD MILLION)
- TABLE 16. GLOBAL AGRITECH MARKET SIZE, BY INDOOR FARMING, BY REGION, 2018-2030 (USD MILLION)
- TABLE 17. GLOBAL AGRITECH MARKET SIZE, BY PRECISION FARMING, BY REGION, 2018-2030 (USD MILLION)
- TABLE 18. GLOBAL AGRITECH MARKET SIZE, BY SMART AGRICULTURE, BY REGION, 2018-2030 (USD MILLION)
- TABLE 19. AMERICAS AGRITECH MARKET SIZE, BY TYPE, 2018-2030 (USD MILLION)
- TABLE 20. AMERICAS AGRITECH MARKET SIZE, BY END USE INDUSTRY, 2018-2030 (USD MILLION)
- TABLE 21. AMERICAS AGRITECH MARKET SIZE, BY COUNTRY, 2018-2030 (USD MILLION)
- TABLE 22. ARGENTINA AGRITECH MARKET SIZE, BY TYPE, 2018-2030 (USD MILLION)
- TABLE 23. ARGENTINA AGRITECH MARKET SIZE, BY END USE INDUSTRY, 2018-2030 (USD MILLION)
- TABLE 24. BRAZIL AGRITECH MARKET SIZE, BY TYPE, 2018-2030 (USD MILLION)
- TABLE 25. BRAZIL AGRITECH MARKET SIZE, BY END USE INDUSTRY, 2018-2030 (USD MILLION)
- TABLE 26. CANADA AGRITECH MARKET SIZE, BY TYPE, 2018-2030 (USD MILLION)
- TABLE 27. CANADA AGRITECH MARKET SIZE, BY END USE INDUSTRY, 2018-2030 (USD MILLION)
- TABLE 28. MEXICO AGRITECH MARKET SIZE, BY TYPE, 2018-2030 (USD MILLION)
- TABLE 29. MEXICO AGRITECH MARKET SIZE, BY END USE INDUSTRY, 2018-2030 (USD MILLION)
- TABLE 30. UNITED STATES AGRITECH MARKET SIZE, BY TYPE, 2018-2030 (USD MILLION)
- TABLE 31. UNITED STATES AGRITECH MARKET SIZE, BY END USE INDUSTRY, 2018-2030 (USD MILLION)
- TABLE 32. UNITED STATES AGRITECH MARKET SIZE, BY STATE, 2018-2030 (USD MILLION)
- TABLE 33. ASIA-PACIFIC AGRITECH MARKET SIZE, BY TYPE, 2018-2030 (USD MILLION)
- TABLE 34. ASIA-PACIFIC AGRITECH MARKET SIZE, BY END USE INDUSTRY, 2018-2030 (USD MILLION)
- TABLE 35. ASIA-PACIFIC AGRITECH MARKET SIZE, BY COUNTRY, 2018-2030 (USD MILLION)
- TABLE 36. AUSTRALIA AGRITECH MARKET SIZE, BY TYPE, 2018-2030 (USD MILLION)
- TABLE 37. AUSTRALIA AGRITECH MARKET SIZE, BY END USE INDUSTRY, 2018-2030 (USD MILLION)
- TABLE 38. CHINA AGRITECH MARKET SIZE, BY TYPE, 2018-2030 (USD MILLION)
- TABLE 39. CHINA AGRITECH MARKET SIZE, BY END USE INDUSTRY, 2018-2030 (USD MILLION)
- TABLE 40. INDIA AGRITECH MARKET SIZE, BY TYPE, 2018-2030 (USD MILLION)
- TABLE 41. INDIA AGRITECH MARKET SIZE, BY END USE INDUSTRY, 2018-2030 (USD MILLION)
- TABLE 42. INDONESIA AGRITECH MARKET SIZE, BY TYPE, 2018-2030 (USD MILLION)
- TABLE 43. INDONESIA AGRITECH MARKET SIZE, BY END USE INDUSTRY, 2018-2030 (USD MILLION)
- TABLE 44. JAPAN AGRITECH MARKET SIZE, BY TYPE, 2018-2030 (USD MILLION)
- TABLE 45. JAPAN AGRITECH MARKET SIZE, BY END USE INDUSTRY, 2018-2030 (USD MILLION)
- TABLE 46. MALAYSIA AGRITECH MARKET SIZE, BY TYPE, 2018-2030 (USD MILLION)
- TABLE 47. MALAYSIA AGRITECH MARKET SIZE, BY END USE INDUSTRY, 2018-2030 (USD MILLION)
- TABLE 48. PHILIPPINES AGRITECH MARKET SIZE, BY TYPE, 2018-2030 (USD MILLION)
- TABLE 49. PHILIPPINES AGRITECH MARKET SIZE, BY END USE INDUSTRY, 2018-2030 (USD MILLION)
- TABLE 50. SINGAPORE AGRITECH MARKET SIZE, BY TYPE, 2018-2030 (USD MILLION)
- TABLE 51. SINGAPORE AGRITECH MARKET SIZE, BY END USE INDUSTRY, 2018-2030 (USD MILLION)
- TABLE 52. SOUTH KOREA AGRITECH MARKET SIZE, BY TYPE, 2018-2030 (USD MILLION)
- TABLE 53. SOUTH KOREA AGRITECH MARKET SIZE, BY END USE INDUSTRY, 2018-2030 (USD MILLION)
- TABLE 54. TAIWAN AGRITECH MARKET SIZE, BY TYPE, 2018-2030 (USD MILLION)
- TABLE 55. TAIWAN AGRITECH MARKET SIZE, BY END USE INDUSTRY, 2018-2030 (USD MILLION)
- TABLE 56. THAILAND AGRITECH MARKET SIZE, BY TYPE, 2018-2030 (USD MILLION)
- TABLE 57. THAILAND AGRITECH MARKET SIZE, BY END USE INDUSTRY, 2018-2030 (USD MILLION)
- TABLE 58. VIETNAM AGRITECH MARKET SIZE, BY TYPE, 2018-2030 (USD MILLION)
- TABLE 59. VIETNAM AGRITECH MARKET SIZE, BY END USE INDUSTRY, 2018-2030 (USD MILLION)
- TABLE 60. EUROPE, MIDDLE EAST & AFRICA AGRITECH MARKET SIZE, BY TYPE, 2018-2030 (USD MILLION)
- TABLE 61. EUROPE, MIDDLE EAST & AFRICA AGRITECH MARKET SIZE, BY END USE INDUSTRY, 2018-2030 (USD MILLION)
- TABLE 62. EUROPE, MIDDLE EAST & AFRICA AGRITECH MARKET SIZE, BY COUNTRY, 2018-2030 (USD MILLION)
- TABLE 63. DENMARK AGRITECH MARKET SIZE, BY TYPE, 2018-2030 (USD MILLION)
- TABLE 64. DENMARK AGRITECH MARKET SIZE, BY END USE INDUSTRY, 2018-2030 (USD MILLION)
- TABLE 65. EGYPT AGRITECH MARKET SIZE, BY TYPE, 2018-2030 (USD MILLION)
- TABLE 66. EGYPT AGRITECH MARKET SIZE, BY END USE INDUSTRY, 2018-2030 (USD MILLION)
- TABLE 67. FINLAND AGRITECH MARKET SIZE, BY TYPE, 2018-2030 (USD MILLION)
- TABLE 68. FINLAND AGRITECH MARKET SIZE, BY END USE INDUSTRY, 2018-2030 (USD MILLION)
- TABLE 69. FRANCE AGRITECH MARKET SIZE, BY TYPE, 2018-2030 (USD MILLION)
- TABLE 70. FRANCE AGRITECH MARKET SIZE, BY END USE INDUSTRY, 2018-2030 (USD MILLION)
- TABLE 71. GERMANY AGRITECH MARKET SIZE, BY TYPE, 2018-2030 (USD MILLION)
- TABLE 72. GERMANY AGRITECH MARKET SIZE, BY END USE INDUSTRY, 2018-2030 (USD MILLION)
- TABLE 73. ISRAEL AGRITECH MARKET SIZE, BY TYPE, 2018-2030 (USD MILLION)
- TABLE 74. ISRAEL AGRITECH MARKET SIZE, BY END USE INDUSTRY, 2018-2030 (USD MILLION)
- TABLE 75. ITALY AGRITECH MARKET SIZE, BY TYPE, 2018-2030 (USD MILLION)
- TABLE 76. ITALY AGRITECH MARKET SIZE, BY END USE INDUSTRY, 2018-2030 (USD MILLION)
- TABLE 77. NETHERLANDS AGRITECH MARKET SIZE, BY TYPE, 2018-2030 (USD MILLION)
- TABLE 78. NETHERLANDS AGRITECH MARKET SIZE, BY END USE INDUSTRY, 2018-2030 (USD MILLION)
- TABLE 79. NIGERIA AGRITECH MARKET SIZE, BY TYPE, 2018-2030 (USD MILLION)
- TABLE 80. NIGERIA AGRITECH MARKET SIZE, BY END USE INDUSTRY, 2018-2030 (USD MILLION)
- TABLE 81. NORWAY AGRITECH MARKET SIZE, BY TYPE, 2018-2030 (USD MILLION)
- TABLE 82. NORWAY AGRITECH MARKET SIZE, BY END USE INDUSTRY, 2018-2030 (USD MILLION)
- TABLE 83. POLAND AGRITECH MARKET SIZE, BY TYPE, 2018-2030 (USD MILLION)
- TABLE 84. POLAND AGRITECH MARKET SIZE, BY END USE INDUSTRY, 2018-2030 (USD MILLION)
- TABLE 85. QATAR AGRITECH MARKET SIZE, BY TYPE, 2018-2030 (USD MILLION)
- TABLE 86. QATAR AGRITECH MARKET SIZE, BY END USE INDUSTRY, 2018-2030 (USD MILLION)
- TABLE 87. RUSSIA AGRITECH MARKET SIZE, BY TYPE, 2018-2030 (USD MILLION)
- TABLE 88. RUSSIA AGRITECH MARKET SIZE, BY END USE INDUSTRY, 2018-2030 (USD MILLION)
- TABLE 89. SAUDI ARABIA AGRITECH MARKET SIZE, BY TYPE, 2018-2030 (USD MILLION)
- TABLE 90. SAUDI ARABIA AGRITECH MARKET SIZE, BY END USE INDUSTRY, 2018-2030 (USD MILLION)
- TABLE 91. SOUTH AFRICA AGRITECH MARKET SIZE, BY TYPE, 2018-2030 (USD MILLION)
- TABLE 92. SOUTH AFRICA AGRITECH MARKET SIZE, BY END USE INDUSTRY, 2018-2030 (USD MILLION)
- TABLE 93. SPAIN AGRITECH MARKET SIZE, BY TYPE, 2018-2030 (USD MILLION)
- TABLE 94. SPAIN AGRITECH MARKET SIZE, BY END USE INDUSTRY, 2018-2030 (USD MILLION)
- TABLE 95. SWEDEN AGRITECH MARKET SIZE, BY TYPE, 2018-2030 (USD MILLION)
- TABLE 96. SWEDEN AGRITECH MARKET SIZE, BY END USE INDUSTRY, 2018-2030 (USD MILLION)
- TABLE 97. SWITZERLAND AGRITECH MARKET SIZE, BY TYPE, 2018-2030 (USD MILLION)
- TABLE 98. SWITZERLAND AGRITECH MARKET SIZE, BY END USE INDUSTRY, 2018-2030 (USD MILLION)
- TABLE 99. TURKEY AGRITECH MARKET SIZE, BY TYPE, 2018-2030 (USD MILLION)
- TABLE 100. TURKEY AGRITECH MARKET SIZE, BY END USE INDUSTRY, 2018-2030 (USD MILLION)
- TABLE 101. UNITED ARAB EMIRATES AGRITECH MARKET SIZE, BY TYPE, 2018-2030 (USD MILLION)
- TABLE 102. UNITED ARAB EMIRATES AGRITECH MARKET SIZE, BY END USE INDUSTRY, 2018-2030 (USD MILLION)
- TABLE 103. UNITED KINGDOM AGRITECH MARKET SIZE, BY TYPE, 2018-2030 (USD MILLION)
- TABLE 104. UNITED KINGDOM AGRITECH MARKET SIZE, BY END USE INDUSTRY, 2018-2030 (USD MILLION)
- TABLE 105. AGRITECH MARKET SHARE, BY KEY PLAYER, 2024
- TABLE 106. AGRITECH MARKET, FPNV POSITIONING MATRIX, 2024
The Agritech Market was valued at USD 2.70 billion in 2024 and is projected to grow to USD 2.96 billion in 2025, with a CAGR of 10.02%, reaching USD 4.79 billion by 2030.
| KEY MARKET STATISTICS | |
|---|---|
| Base Year [2024] | USD 2.70 billion |
| Estimated Year [2025] | USD 2.96 billion |
| Forecast Year [2030] | USD 4.79 billion |
| CAGR (%) | 10.02% |
Agritech today is evolving at an unprecedented pace, driven by advancements in technology and changing market dynamics. New and innovative solutions are reshaping the agricultural landscape by integrating science, technology, and data-driven management. The past decade has witnessed a transformation from conventional practices to modern approaches that leverage research, precision techniques, and innovative automation systems. This evolution is not just about improving yields but also about ensuring sustainability, addressing climate challenges, and streamlining the entire agricultural value chain.
The integration of digital tools is empowering stakeholders across the sector, from farmers and agronomists to policymakers and supply chain experts, to make informed decisions. Enhanced connectivity, predictive analytics, and robust hardware solutions have collectively created a fertile ground for disruption. These trends encourage a collaborative effort among technology developers, industry experts, and end users to redefine the benchmarks of agricultural productivity.
This report sets the stage for understanding what drives these changes and highlights how new technological and strategic initiatives have turned agritech into a robust, dynamic market. It lays a foundation for exploring emerging trends, strategic insights, and future possibilities. In essence, this introductory exploration establishes the framework for evaluating a sector that is rapidly evolving to meet the challenges and opportunities of a technology-enabled future.
Transformative Shifts in Agritech Evolution
The agritech sector is experiencing transformative shifts that are revolutionizing the way agricultural processes are executed worldwide. With the convergence of digital technologies and the urgent need to enhance sustainability, industry players are reimagining traditional methods and embracing innovative practices.
One of the core drivers behind this transformation is the integration of advanced data analytics that is providing real-time insights into crop health, weather predictions, and soil conditions. This real-time information facilitates precision farming and has the potential to reduce costs while increasing yields. The revolution is not limited to data alone; robotics, artificial intelligence, and connectivity are forming the backbone of modern agricultural systems that streamline operations and minimize resource wastage.
Another significant shift is the drive towards sustainable practices. There is a clear move towards reducing chemical inputs and embracing bio-based solutions. Technologies that once seemed futuristic are now tangible tools, such as connected sensors that monitor moisture levels and automated systems that optimize water distribution. Furthermore, the introduction of biotechnology and the use of big data platforms have enabled farmers to adapt to shifting environmental conditions effectively.
These changes underscore the dynamic nature of agritech and the continuous need to adapt. The integration of mobile solutions and connected devices further supports a fully integrated system where insights are translated into action in near real-time. As a result, the industry landscape is not only more technologically advanced but also holistically aware of both economic and environmental imperatives.
Segmentation Insights: Analyzing Market Divisions
Detailed segmentation analysis reveals a dual-layered framework where market investigation is anchored on both type and end use industries. The type-based segmentation examines a spectrum that ranges from Big Data & Analytics to Biotechnology & Biochemical, extending further to Mobility, and concluding with Sensors & Connected Devices. Each of these segments plays a crucial role in fostering innovative solutions that support decision-making, optimize production, and ensure operational efficiency. The use of big data analytics is particularly instrumental in providing granular insights that inform timely interventions while biotechnology fosters new methods for crop enhancement. The emergence of mobility solutions and connected devices further adds to the robustness of modern agriculture, ensuring that no part of the process remains unmonitored.
When the focus shifts to the end use industry, the market is dissected into categories that include traditional Agriculture and Agrochemicals alongside modern advancements observed in Biotechnology and Indoor Farming. The analysis further extends to Precision Farming and Smart Agriculture, realms where digital innovations are making notable impacts. This comprehensive approach provides a nuanced perspective that is critical for investors and decision-makers. By understanding specific market subdivisions, one can identify niche opportunities and areas of rapid advancement.
The insights drawn from this segmentation highlight the intricate interplay between technology and agricultural practices. Investors and business leaders are better positioned to capture emerging trends, allocate resources efficiently, and create tailored strategies that reflect the varied requirements of each segment. This informed segmentation paves the way for targeted innovation and strategic development in a rapidly changing environment.
Based on Type, market is studied across Big Data & Analytics, Biotechnology & Biochemical, Mobility, and Sensors & Connected Devices.
Based on End Use Industry, market is studied across Agriculture, Agrochemicals, Biotechnology, Indoor Farming, Precision Farming, and Smart Agriculture.
Regional Insights: Global Dynamics in Agritech
An analysis of the agritech market across diverse regions offers a compelling narrative of growth and innovation that is both unique and shared. In the Americas, the robust integration of technology in traditional farming practices has led to significant productivity gains and cost efficiencies. This region has witnessed a vigorous adoption of data-driven methodologies and advanced connectivity, which have refined decision-making processes at various levels of the agricultural supply chain.
Transitioning focus to the Europe, Middle East & Africa region, a mosaic of practices is observed. Here, a blend of long-established agricultural traditions and modern technological interventions provides a rich ground for future growth. The demand for sustainable and innovative farming methods is prompting entities to invest in state-of-the-art systems that enhance crop resilience and environmental stewardship. Likewise, the Asia-Pacific region is emerging as a powerhouse of agritech innovation, driven by rapid technological adoption and a significant consumer base. Technological diffusion in this part of the world has been accelerated by digital transformation initiatives that cater to a wide array of farming techniques and diversification strategies.
Across these regions, the influence of local nuances and market maturity levels is clearly evident. Each region contributes uniquely to the global agritech ecosystem through different adoption curves and strategic investments. These varied dynamics offer an important perspective for stakeholders looking to harness regional strengths while acknowledging local challenges and opportunities.
Based on Region, market is studied across Americas, Asia-Pacific, and Europe, Middle East & Africa. The Americas is further studied across Argentina, Brazil, Canada, Mexico, and United States. The United States is further studied across California, Florida, Illinois, New York, Ohio, Pennsylvania, and Texas. The Asia-Pacific is further studied across Australia, China, India, Indonesia, Japan, Malaysia, Philippines, Singapore, South Korea, Taiwan, Thailand, and Vietnam. The Europe, Middle East & Africa is further studied across Denmark, Egypt, Finland, France, Germany, Israel, Italy, Netherlands, Nigeria, Norway, Poland, Qatar, Russia, Saudi Arabia, South Africa, Spain, Sweden, Switzerland, Turkey, United Arab Emirates, and United Kingdom.
Key Company Contributions Shaping Agritech
The landscape of agritech is enriched by the contributions of several leading companies whose strategic initiatives are shaping the future of farming. Innovators such as AeroFarms, Inc. and AG Leader Technology, Inc. are at the forefront of transforming urban agriculture and precision farming, respectively. Traditional heavyweights like AGCO Corporation and Deere & Company continue their legacy by integrating cutting-edge technology with experienced agronomic practices.
Equally, companies that bridge the gap between technology and agriculture, including AgFunder, Inc. and CropIn Technology Solutions Pvt. Ltd., have been instrumental in democratizing access to innovative agritech solutions. Global chemical and biotechnology conglomerates such as BASF SE and Bayer AG are continuously creating synergies that develop next-generation agriculture inputs that are efficient and environmentally sustainable. The influence of companies like CeresAI and Corteva, Inc. suggests that modern technology, when combined with sector expertise, can drive significant market advancements.
In addition, emerging entities including Crofarm Agriproducts Pvt Ltd, CropX, Inc., and Farmers Edge, Inc. are spearheading initiatives that place sensor-based monitoring and digital analytics at the core of cultivation practices. Innovators such as Indigo Ag, Inc. and Kubota Corporation highlight the potential of modern precision farming techniques, while Plenty Unlimited, Inc. and Ripe Robotics Pty Ltd. provide models of how urban and controlled environment agriculture can be advanced successfully. Companies like SenseGrow Technologies Pvt. Ltd., Syngenta AG, Taranis AgTech, Ltd., Trimble Inc., and XAG Co., Ltd. further exemplify the industry's commitment to innovation and sustainable practices. Together, these organizations create a vibrant network that facilitates knowledge sharing, encourages best practices, and continues to drive the evolution of agritech on a global scale.
The report delves into recent significant developments in the Agritech Market, highlighting leading vendors and their innovative profiles. These include AeroFarms, Inc., AG Leader Technology, Inc., AGCO Corporation, AgFunder, Inc., BASF SE, Bayer AG, CeresAI, Corteva, Inc., Crofarm Agriproducts Pvt Ltd, CropIn Technology Solutions Pvt. Ltd., CropX, Inc., Deere & Company, Farmers Edge, Inc., Indigo Ag, Inc., Kubota Corporation, Plenty Unlimited, Inc., Ripe Robotics Pty Ltd., SenseGrow Technologies Pvt. Ltd., Syngenta AG, Taranis AgTech, Ltd., Trimble Inc., and XAG Co., Ltd.. Strategic Recommendations for Industry Leaders
Industry leaders are encouraged to drive transformation by fostering collaboration, investing in research and development, and embracing digital innovations. It is critical for decision-makers to identify and capitalize on emerging technologies, ensuring that investments align with both short-term operational efficiencies and long-term sustainability goals. Leaders should consider integrating advanced data platforms with artificial intelligence to expand predictive capabilities and enhance precision farming systems. Further, bridging partnerships with technology providers offers opportunities to leverage digital insights for improved resource management and optimal crop outcomes.
A focus on expanding connectivity and automation within supply chains can also streamline operations, making economies more resilient and responsive. Strategic initiatives should be anchored in understanding regional market dynamics and tailoring solutions to address local needs. By investing in scalable and adaptive technologies, industry stakeholders can pave the way for a smarter and more sustainable agricultural ecosystem. Embracing such holistic strategies will not only fortify competitive advantages but also ensure that future risks are mitigated effectively.
Conclusion: Charting Future Pathways in Agritech
The evolving agritech sphere presents a dynamic interplay between technological advancement and agricultural tradition. This report underscores that the integration of data analytics, precision farming, and innovative biotechnologies is central to modern agricultural success. Each segmentation and regional insight provides clarity on how targeted investments and strategic planning can drive substantial changes.
In summary, the evolving landscape is a testament to the robust potential that lies at the intersection of innovation and agronomy. By leveraging comprehensive market insights and responding proactively to regional and sectoral trends, industry stakeholders can secure a competitive edge in an increasingly digitalized ecosystem. Future-oriented leaders must be prepared to adjust to emerging trends, harness the power of cutting-edge solutions, and create frameworks that respond dynamically to global challenges.
Table of Contents
1. Preface
- 1.1. Objectives of the Study
- 1.2. Market Segmentation & Coverage
- 1.3. Years Considered for the Study
- 1.4. Currency & Pricing
- 1.5. Language
- 1.6. Stakeholders
2. Research Methodology
- 2.1. Define: Research Objective
- 2.2. Determine: Research Design
- 2.3. Prepare: Research Instrument
- 2.4. Collect: Data Source
- 2.5. Analyze: Data Interpretation
- 2.6. Formulate: Data Verification
- 2.7. Publish: Research Report
- 2.8. Repeat: Report Update
3. Executive Summary
4. Market Overview
5. Market Insights
- 5.1. Market Dynamics
- 5.1.1. Drivers
- 5.1.1.1. Increasing demand for sustainable and organic food products
- 5.1.1.2. Expansion of digital platforms facilitating seamless agricultural supply chain management
- 5.1.1.3. Government support and subsidies for modern agriculture initiatives
- 5.1.2. Restraints
- 5.1.2.1. High initial investment and operational costs of advanced agriculture technologies
- 5.1.3. Opportunities
- 5.1.3.1. Technological advancements in precision farming and IoT integration
- 5.1.3.2. Growing investments in vertical and controlled environment agriculture
- 5.1.4. Challenges
- 5.1.4.1. Cybersecurity concerns and data privacy issues in digital agriculture platforms
- 5.1.1. Drivers
- 5.2. Market Segmentation Analysis
- 5.2.1. Type: Rising usage of big data & analytics in agritech to optimize yield and reduce resource waste
- 5.2.2. End Use Industry: Growing usage of agritech in precision farming for maximizing yield and sustainability
- 5.3. Porter's Five Forces Analysis
- 5.3.1. Threat of New Entrants
- 5.3.2. Threat of Substitutes
- 5.3.3. Bargaining Power of Customers
- 5.3.4. Bargaining Power of Suppliers
- 5.3.5. Industry Rivalry
- 5.4. PESTLE Analysis
- 5.4.1. Political
- 5.4.2. Economic
- 5.4.3. Social
- 5.4.4. Technological
- 5.4.5. Legal
- 5.4.6. Environmental
6. Agritech Market, by Type
- 6.1. Introduction
- 6.2. Big Data & Analytics
- 6.3. Biotechnology & Biochemical
- 6.4. Mobility
- 6.5. Sensors & Connected Devices
7. Agritech Market, by End Use Industry
- 7.1. Introduction
- 7.2. Agriculture
- 7.3. Agrochemicals
- 7.4. Biotechnology
- 7.5. Indoor Farming
- 7.6. Precision Farming
- 7.7. Smart Agriculture
8. Americas Agritech Market
- 8.1. Introduction
- 8.2. Argentina
- 8.3. Brazil
- 8.4. Canada
- 8.5. Mexico
- 8.6. United States
9. Asia-Pacific Agritech Market
- 9.1. Introduction
- 9.2. Australia
- 9.3. China
- 9.4. India
- 9.5. Indonesia
- 9.6. Japan
- 9.7. Malaysia
- 9.8. Philippines
- 9.9. Singapore
- 9.10. South Korea
- 9.11. Taiwan
- 9.12. Thailand
- 9.13. Vietnam
10. Europe, Middle East & Africa Agritech Market
- 10.1. Introduction
- 10.2. Denmark
- 10.3. Egypt
- 10.4. Finland
- 10.5. France
- 10.6. Germany
- 10.7. Israel
- 10.8. Italy
- 10.9. Netherlands
- 10.10. Nigeria
- 10.11. Norway
- 10.12. Poland
- 10.13. Qatar
- 10.14. Russia
- 10.15. Saudi Arabia
- 10.16. South Africa
- 10.17. Spain
- 10.18. Sweden
- 10.19. Switzerland
- 10.20. Turkey
- 10.21. United Arab Emirates
- 10.22. United Kingdom
11. Competitive Landscape
- 11.1. Market Share Analysis, 2024
- 11.2. FPNV Positioning Matrix, 2024
- 11.3. Competitive Scenario Analysis
- 11.3.1. DeHaat expands its digital agriculture ecosystem through the AgriCentral acquisition
- 11.3.2. Two Brothers Organic Farms secures Series A funding of INR 58.25 crore to drive agritech expansion in India and the US
- 11.4. Strategy Analysis & Recommendation
Companies Mentioned
- 1. AeroFarms, Inc.
- 2. AG Leader Technology, Inc.
- 3. AGCO Corporation
- 4. AgFunder, Inc.
- 5. BASF SE
- 6. Bayer AG
- 7. CeresAI
- 8. Corteva, Inc.
- 9. Crofarm Agriproducts Pvt Ltd
- 10. CropIn Technology Solutions Pvt. Ltd.
- 11. CropX, Inc.
- 12. Deere & Company
- 13. Farmers Edge, Inc.
- 14. Indigo Ag, Inc.
- 15. Kubota Corporation
- 16. Plenty Unlimited, Inc.
- 17. Ripe Robotics Pty Ltd.
- 18. SenseGrow Technologies Pvt. Ltd.
- 19. Syngenta AG
- 20. Taranis AgTech, Ltd.
- 21. Trimble Inc.
- 22. XAG Co., Ltd.
