|
|
市場調査レポート
商品コード
1830282
エポキシ化大豆油市場:用途、販売チャネル、グレード別-2025-2032年世界予測Epoxidized Soybean Oil Market by Application, Sales Channel, Grade - Global Forecast 2025-2032 |
||||||
|
|||||||
カスタマイズ可能
適宜更新あり
|
|||||||

| エポキシ化大豆油市場:用途、販売チャネル、グレード別-2025-2032年世界予測 |
|
出版日: 2025年09月30日
発行: 360iResearch
ページ情報: 英文 197 Pages
納期: 即日から翌営業日
|

概要
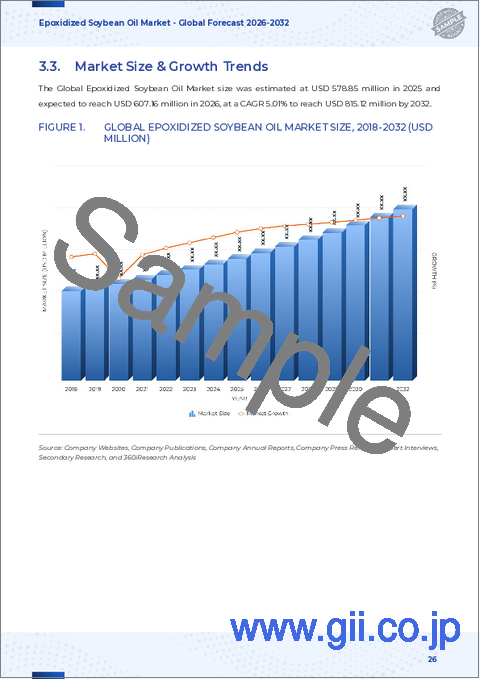
エポキシ化大豆油市場は、2032年までにCAGR 4.69%で7億6,482万米ドルの成長が予測されています。
| 主な市場の統計 | |
|---|---|
| 基準年2024 | 5億2,986万米ドル |
| 推定年2025 | 5億5,455万米ドル |
| 予測年2032 | 7億6,482万米ドル |
| CAGR(%) | 4.69% |
エポキシ化大豆油の技術的役割、持続可能性、製剤メーカーやバイヤーにとっての機能横断的意義に焦点を当てた包括的なイントロダクション
エポキシ化大豆油(ESBO)は、ポリマー加工、コーティング剤、接着剤、特殊流体などに使用されるバイオベースの添加剤として重要な位置を占めています。そのエポキシ化された機能性は、可塑化、安定化、酸化安定性の利点をもたらし、ポリ塩化ビニルとの相溶性や規制上の受容性が重要な用途において、一部の石油由来可塑剤の代替品として好まれています。さらに、大豆油を原料としていることから、より広範な持続可能性の話題の中に位置づけられ、再生可能な原料やライフサイクルでの温室効果ガス排出量の低減を求める配合者の関心を集めています。
実際には、ESBOの価値提案は、化学的性能、規制遵守、サプライチェーンの力学によって形成されます。技術チームは、PVCコンパウンドの柔軟性と耐移行性を向上させるESBOの能力を高く評価し、食品包装や栄養補助食品の処方担当者は、食品グレードの仕様と移行限界に重点を置いています。同時に、産業界のバイヤーは、金属加工や高温流体システムの代替品を評価する際に、熱伝達安定性や潤滑性などの側面を考慮します。
従来のフタル酸系可塑剤からエポキシ化植物油への移行には、研究開発、規制、調達の各チーム間の機能横断的な連携が必要です。その結果、技術審査、規制審査、サプライヤー認定を早期に統合する企業は、バイオベースのエポキシ化添加剤の業務上およびブランド上の利点を獲得しやすい立場にあります。このエグゼクティブサマリーでは、業界情勢の変化、規制と関税の影響、セグメンテーションに基づく洞察、地域別の動き、業界のベストプラクティス、ESBOを評価するリーダーに推奨される次のステップについて解説します。
エポキシ化大豆油分野におけるサプライヤーの期待、製品グレード、選択基準を再定義する、規制、持続可能性、技術の重要な変遷を探る
エポキシ化大豆油を取り巻く状況は、規制の明確化、持続可能性の義務化、技術の成熟、原料経済の進化によって、同時進行的に変化しています。規制当局は、食品に接触する材料に使用される物質の移行制限にますます重点を置くようになっており、メーカーに生産管理と文書化の実践に磨きをかけるよう促しています。このような規制の厳格化により、より純度の高い食品グレードの素材に対する需要が加速する一方で、新規サプライヤーにとっては参入のハードルが高くなります。
規制の圧力と並行して、企業の持続可能性プログラムと消費者の期待は、再生可能で低炭素の添加物に対する需要を高めています。多くの川下加工業者はバイオベースの証明書とサプライ・チェーンのトレーサビリティを優先しており、これが認証、出所追跡、ライフサイクル分析への投資のきっかけとなっています。その結果、第三者によって検証された持続可能性の主張と透明性のある原料調達を提供できる生産者は、サプライヤー選定の際に優先的に考慮されるようになりました。
エポキシ化化学と生産効率における技術的進歩も、競争力学を変化させています。プロセス収率の向上、副生成物プロファイルの低減、分析管理の強化により、サプライヤーは接着剤やシーリング剤、コーティング剤、熱伝導流体などに合わせたグレードを提供できるようになりました。さらに、代替可塑剤化学の勢い(バイオベースと合成の両方)は、配合者が利用できる代替ツールキットの幅を広げ、画一的な主張よりも用途に特化した性能検証に重点を置くようになっています。
これらのシフトを総合すると、規制への対応、持続可能な調達、最終用途の顧客との技術協力を組み合わせた統合戦略が有利となります。組織が適応していく中で、研究開発、調達、サステナビリティの各チームを積極的に連携させる企業は、実証可能な性能とコンプライアンスを通じて差別化を図る優れた機会を見出すことができると思われます。
米国における最近の関税措置と潜在的な関税措置が、サプライチェーンの脆弱性を高めると同時に、業界における戦略的調達、垂直統合、再製造の取り組みをどのように促すかの評価
米国では2025年まで関税環境が変化するため、大豆誘導品や特殊オレオケミカルに依存するサプライチェーン全体で備えをする必要が生じています。関税措置は、暫定的なものであれ、継続的なものであれ、輸入エポキシ化大豆油とその原料の比較コスト力学を変化させる可能性があり、バイヤーに調達フットプリントとサプライヤーとの関係を再考する動機を与えます。これに対応するため、多くの組織では、突然のコストシフト、事務手続きの遅延、書類の複雑さなどに対する脆弱性を評価するために、シナリオベースの調達プレイブックを採用しています。
実際的には、関税は供給の多様化の重要性を高めています。調達チームは、ニアショアリング、デュアルソーシング戦略、貿易政策のボラティリティへのエクスポージャーを軽減するための長期契約数量などのオプションを評価するようになってきています。同時に、関税は、生産者と原料供給業者との間で、供給の安全性を確保し、経済的に可能な場合には垂直統合を模索するために、より緊密な連携を動機づける。関税の分類と緩和措置には、詳細な製品説明と取引の透明性が要求されるため、規制と税関のコンプライアンス機能も重要性を増しています。
製品開発および商業チームにとって、関税は材料の代替や再製造への関心を加速させる可能性があります。輸入関連のコスト圧力が顕在化すると、配合担当者は代替可塑剤の検証や、安定したコストポイントで性能を維持するための配合レシピの調整に積極的になります。その結果、研究開発パイプラインには、最終用途の性能と規制遵守を維持しながら混乱を最小限に抑える、不測の事態に備えた経路が含まれるようになってきています。
全体として、累積関税の状況は、部門横断的な回復力の必要性を強化しています。すなわち、調達の柔軟性、規制の高度化、技術的敏捷性と、強固なサプライヤー・パートナーシップを組み合わせることで、企業は製品の完全性を損なうことなく、政策によって引き起こされる逆風を乗り切ることができます。
用途、販売チャネル、グレードの違い別、サプライヤーとバイヤーの技術要件、調達モデル、資格認定経路がどのように決まるかを明らかにする、セグメンテーションに基づく実用的な洞察
明確なセグメンテーションのレンズを通して市場を理解することで、用途、販売チャネル、等級ごとに異なる優先順位とリスクプロファイルが明らかになります。用途別では、接着剤・シーリング剤、コーティング剤、食品包装、熱伝導流体、可塑剤・潤滑剤、PVC安定剤が分析対象となり、それぞれ異なる技術仕様、純度要件、文書化ニーズが課されます。例えば、コーティングの配合者は酸化安定性と樹脂システムとの相溶性を重視するのに対し、食品包装用途では食品に接触する規制当局を満足させるために厳格な移行試験と文書化が要求されます。
目次
第1章 序文
第2章 調査手法
第3章 エグゼクティブサマリー
第4章 市場の概要
第5章 市場洞察
- 包装および建設におけるPVC用途におけるESOベースのフタル酸エステルフリー可塑剤の採用増加
- REACHおよびEPAによる規制圧力により、より安全な可塑剤の代替としてバイオベースのエポキシ化大豆油の需要が高まっています。
- 電子機器組立における耐熱性と耐薬品性を向上させるUV硬化コーティングへのエポキシ化大豆油の統合
- ポリマーの適合性と性能を向上させる高純度エポキシ化大豆油のための新規触媒プロセスの開発
- 自動車の内外装用途におけるESO需要の増加に対応するため、アジア太平洋地域での製造能力を拡大
- 持続可能なエポキシ化方法を拡大し、生産コストを削減するための油糧種子生産者と化学企業の協力
第6章 米国の関税の累積的な影響, 2025
第7章 AIの累積的影響, 2025
第8章 エポキシ化大豆油市場:用途別
- 接着剤とシーラント
- コーティング
- 食品包装
- 熱伝達流体
- 可塑剤および潤滑剤
- PVC安定剤
第9章 エポキシ化大豆油市場:販売チャネル別
- 直接販売
- 販売代理店販売
第10章 エポキシ化大豆油市場:グレード別
- 食品グレード
- 食品包装
- 栄養補助食品
- 工業用グレード
- 化学処理
- 金属加工
第11章 エポキシ化大豆油市場:地域別
- 南北アメリカ
- 北米
- ラテンアメリカ
- 欧州・中東・アフリカ
- 欧州
- 中東
- アフリカ
- アジア太平洋地域
第12章 エポキシ化大豆油市場:グループ別
- ASEAN
- GCC
- EU
- BRICS
- G7
- NATO
第13章 エポキシ化大豆油市場:国別
- 米国
- カナダ
- メキシコ
- ブラジル
- 英国
- ドイツ
- フランス
- ロシア
- イタリア
- スペイン
- 中国
- インド
- 日本
- オーストラリア
- 韓国
第14章 競合情勢
- 市場シェア分析, 2024
- FPNVポジショニングマトリックス, 2024
- 競合分析
- Kuala Lumpur Kepong Berhad
- Kolon Industries, Inc.
- Cargill, Incorporated
- Vantage Specialty Chemicals LLC
- Arkema S.A.
- BASF SE
- Evonik Industries AG
- AdvanSix Inc.
- Jiangsu Yangnong Chemical Group Co., Ltd.
- Jiangsu Garson Chemical Co., Ltd.

