|
|
市場調査レポート
商品コード
1835222
ハラール化粧品市場:製品タイプ別、流通チャネル別、用途別、エンドユーザー別、価格帯別 - 世界予測、2025年~2032年Halal Cosmetics Market by Product Type, Distribution Channel, Application, End User, Price Range - Global Forecast 2025-2032 |
||||||
|
|||||||
カスタマイズ可能
適宜更新あり
|
|||||||

| ハラール化粧品市場:製品タイプ別、流通チャネル別、用途別、エンドユーザー別、価格帯別 - 世界予測、2025年~2032年 |
|
出版日: 2025年09月30日
発行: 360iResearch
ページ情報: 英文 187 Pages
納期: 即日から翌営業日
|

概要
ハラール化粧品市場は、2032年までに14.92%のCAGRで1,540億2,000万米ドルの成長が予測されています。
| 主な市場の統計 | |
|---|---|
| 基準年2024 | 506億米ドル |
| 推定年2025 | 583億2,000万米ドル |
| 予測年2032 | 1,540億2,000万米ドル |
| CAGR(%) | 14.92% |
認証された完全性と高性能処方に対する消費者の期待が、ハラール化粧品の製品開発と市場開拓アプローチをどのように再定義しているか
ハラール化粧品セグメントは、ニッチなコンプライアンス・サブセットから、信仰に基づく消費者ニーズと、透明性、天然成分、倫理的生産に対する主流の嗜好が交差する戦略的カテゴリーへと成熟してきました。消費者は、認証プロセスや原料の出所についてますます洗練され、妥協のない製品を求めています。その結果、バリューチェーンの各企業は、ハラル認証と持続可能性と安全性に対するより広範な要求の双方に合致するよう、製品開発、サプライチェーンガバナンス、商業コミュニケーションを再調整しています。
これと並行して、デジタルチャネルと規制当局の監視はハラル主張の可視性を高め、ブランドは検証可能な認証、第三者監査、より明確な表示への投資を促しています。このような力学は、ブランドによるポートフォリオ設計のアプローチ方法を再構築し、成分のトレーサビリティ、クリーンな処方、文化的に敏感なマーケティングに重点を置くようになっています。消費者が包括的で倫理的な美のソリューションを求めるにつれて、異文化の受容が拡大しています。
これらの力を総合すると、メーカー、小売業者、サービス・プロバイダーにとって戦略的変曲点が生まれます。厳格な認証パスウェイを、消費者中心の製品性能とオムニチャネル・アクセシビリティと統合する企業は、ますます透明化するマーケットプレースにおいて、ロイヤルティを獲得し、評判リスクを軽減する立場にあります。
ハラール化粧品のバリューチェーン全体の競争力学を再構築している、デジタル加速、成分革新、認証への期待の高まりを含む主要な構造シフト
ハラール化粧品の情勢は、消費者の高度化、規制の進化、チャネルの革新によって、いくつかの変革期を迎えています。第一に、消費者の要求は単なるハラル表示から、成分トレーサビリティ、倫理的調達、製造衛生を含む包括的保証へと移行しつつあります。これによって、認証機関やコンプライアンス文書の役割が高まり、多様な市場でブランドの信頼性を決定する重要な要素として機能するようになりました。
第二に、デジタルトランスフォーメーションが導入ペースを加速させています。ソーシャル・コマース、インフルエンサー主導の教育、ブランド所有のeコマースにより、製品の発見が加速し、試用への障壁が低くなっています。同時に、スキンケアやヘアケアのような手触りの良いカテゴリーでは、オフラインの小売が依然として重要であり、体験型小売とシームレスなデジタル・フルフィルメントを組み合わせたハイブリッド戦略を促しています。
第三に、製剤と成分科学の技術的進歩により、従来の活性剤に代わるハラルに準拠した代替品が可能になり、競合する投入物への依存度が低下し、天然植物由来のイノベーションへの道が開かれつつあります。第四に、目的主導型ブランドに対する投資家の関心が高まり、検証可能な倫理的慣行、持続可能なパッケージング、包括的マーケティングを実証する企業に資本が向かい始めています。
これらのシフトを総合すると、認証の厳格さと製品の有効性を調和させ、オムニチャネル流通を拡大し、混雑した競合環境の中で信憑性を伝えることができる機敏な組織が有利となります。
2025年の関税環境は、米国で事業展開する企業や米国に輸出する企業の調達経済、流通戦略、サプライチェーンアーキテクチャをどのように再構築したか
2025年の米国関税の導入と累積的なエスカレーションは、ハラール化粧品のサプライチェーン全体に明確かつ直接的なプレッシャーをもたらし、調達、コスト構造、競争上のポジショニングに影響を及ぼしています。輸入原材料と完成品に対する関税の引き上げは、特殊な原材料、包装部品、香料をグローバルサプライヤーに依存している企業にとって、陸揚げコストを引き上げました。このため、関税が免除される国や関税の低い国への調達の移転、代替原料サプライヤーの資格認定の迅速化、関税の高い原料を代替するための製品処方の再評価など、いくつかの対応が促されています。
流通面では、輸入コストの上昇が川下における価格圧力となり、小売業者やブランドは消費者の需要を損なうことなく、これを管理しなければならないです。非上場会社の中には、合理化されたSKUやPB商品によって利用しやすい価格帯を維持しつつ、高級SKUのマージンを守るためにターゲットを絞ったプレミアム化を採用したところもあります。逆に、市場シェアを維持するためにコストを吸収し、ロイヤリティ・プログラムや販促の仕組みを活用して数量を維持する企業もあります。
ロジスティクスのパターンも変化しています。企業は、関税と運賃の変動を償却するために、戦略的な地域ハブにおける在庫の厚みを増しており、サプライチェーンを短縮し、関税変動のリスクを軽減するためにニアショアリングを模索しています。規制遵守と関税分類のワークストリームはより中心的なものとなり、関税治療を最適化するための法的検討と税関戦略を必要とするようになりました。
最後に、関税環境は、パートナーの選択とM&Aの計算を再構築しました。統合された製造能力を持つ企業や有利な二国間貿易協定を結んでいる企業は交渉において優位に立ち、一部の企業は、より高い関税制度の下で継続性とコスト競争力を確保するために戦略的提携や能力投資を行うようになりました。
製品カテゴリー、チャネルエコシステム、用途のニーズ、エンドユーザー層、価格設定層が、どのように差別化された商業戦略を要求しているかを明らかにする正確なセグメンテーション情報
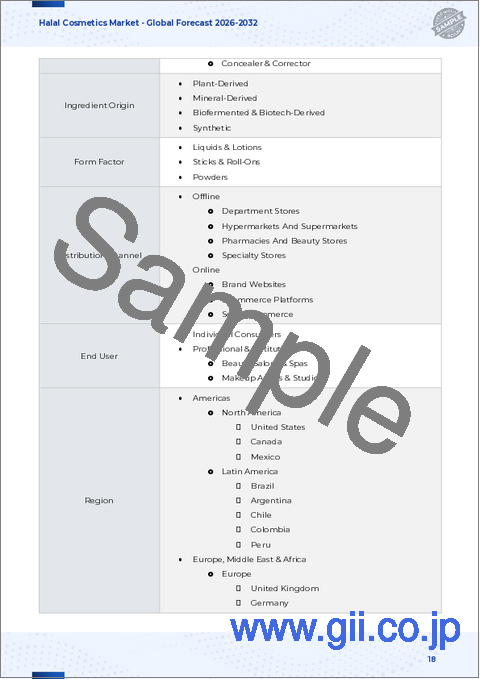
セグメンテーションの洞察により、製品タイプ、チャネル、アプリケーション、エンドユーザーコホート、価格帯において、個別の商業設計図を必要とする差別化されたダイナミクスが明らかになります。カラーコスメ、デオドラント、フレグランス、ヘアケア、スキンケアなどの製品タイプでは、スキンケアとヘアケアは、効能効果に対する懐疑的な見方を克服するために、より深い効能効果の立証と市場でのサンプリングが必要になることが多く、カラーコスメとフレグランスは、コンバージョンを促進するために、ビジュアルストーリーテリングとインフルエンサー主導のトライアルに依存する傾向があります。流通チャネルのニュアンスは重要で、オフラインチャネル(百貨店、ハイパーマーケット、スーパーマーケット、薬局、美容専門店、専門店)は、手触り体験とマスマーケットへのリーチにとって引き続き極めて重要である一方、オンラインチャネル(ブランドウェブサイト、eコマースプラットフォーム、ソーシャルコマース)は、ターゲットを絞ったアクティベーション、サブスクリプションモデル、消費者データの直接取得を可能にします。
ボディケア、フェイシャルケア、フレグランス、ヘアケア、メーキャップ、オーラルケアなどの用途には、それぞれ異なる規制や表示要件があり、製剤のタイムラインや認証のチェックポイントに影響を与えます。子供、男性、ユニセックス、女性といったエンドユーザーのセグメンテーションには、それぞれに合わせたメッセージングやパッケージデザインが必要です。子供向けの処方には、追加の安全性文書やより優しい成分プロファイルが求められ、男性向け製品では分かりやすい機能性表示が活用され、ユニセックス向け製品では包括性が強調され、女性向け製品では多くの場合、性能と感覚的な体験が組み合わされています。マス、ミッドレンジ、プレミアムの価格帯の違いは、流通戦略、販促の流れ、製品のライフサイクルを決定します。プレミアムの価格帯は、より高い認証とトレーサビリティのコストをサポートできるが、マスの価格帯は、コストの最適化とコンプライアンス経路の簡素化を優先します。
従って、統合された商業戦略は、製品開発のケーデンス、認証投資、チャネルの実行を、各セグメンテーション・セルの特定のニーズに合わせる必要があり、より効率的な資源配分と消費者の共鳴の向上を可能にします。
規制の枠組み、消費者の嗜好、小売のダイナミクスが世界のハラール化粧品市場でどのように異なるかを示す地域ごとの業務・商業上の洞察
地域別の洞察は、南北アメリカ、欧州、中東・アフリカ、アジア太平洋で、促進要因、規制の枠組み、消費者の期待が著しく異なることを示しており、地域特有のポジショニングとオペレーション上の選択が必要であることを示しています。南北アメリカでは、多文化的な消費者層とデジタルネイティブな購買行動により、透明性の高い表示と消費者直結の体験が重視され、小売業者はトレーサビリティと効能効果を重視しています。欧州と中東・アフリカは、文化的・宗教的な配慮が購入の意思決定に大きな影響を与える大規模な需要の中心地であると同時に、先進的な規制体制と高い認証への期待が複雑に絡み合っています。
アジア太平洋地域には、ハラル認証機関が最も集中していると同時に、最もダイナミックな小売エコシステムが存在し、伝統的なオフライン流通とソーシャルコマースの爆発的な普及が融合しています。アジア太平洋地域のサプライチェーンは、原料供給元により近いことが多く、リードタイムを短縮し、原料供給元との共同イノベーションを促進することができます。また、国境を越えた戦略では、認証マークの受け入れ態勢が異なることを想定する必要があります。
これらの地域にまたがって事業を展開する企業は、モジュール式の製品アーキテクチャーと柔軟なロジスティクス・フットプリントを採用し、グローバル・ブランドの一貫性を地域のコンプライアンスと消費者の期待と調和させることで、関連性を維持しながら市場投入までの時間的摩擦を軽減する必要があります。
大手企業はどのように認証をイノベーションパイプラインに統合し、オムニチャネルの成長とサプライチェーンの強靭性のバランスを取りながら、永続的な競争優位性を確立しているのか
ハラール化粧品分野の主要企業は、市場リーダーと追随企業を区別する一連の戦略的優先事項に収斂しつつあります。第一に、製品開発ワークフローに認証と監査対応プロセスを制度化し、研究開発から小売に至るまで、配合文書、サプライヤー宣言、トレーサビリティ記録を確実に維持することに明確な重点が置かれています。第二に、成功を収めている企業は、成分のイノベーションを消費者のストーリーテリングと融合させています。これは、成分サプライヤーと提携してハラルに準拠した活性物質を生み出すと同時に、利用しやすくエビデンスに裏打ちされたフォーマットでメリットを伝えています。
第三に、オムニチャネル流通戦略が競争力のある企業の特徴です。これらの企業は、オフライン小売の感覚的な利点と、eコマースやソーシャルコマースのパーソナライゼーションやデータ取得のバランスをとっており、多くの場合、デジタルチャネルを使用して試用を促し、オフラインでリピート購入者を獲得しています。第四に、ニアショアリング、受託製造パートナーシップ、デュアルソーシング戦略を通じたオペレーションの弾力性が、特に関税圧力やサプライチェーンのショックに直面した場合の特徴的な能力となっています。
最後に、トップクラスの企業は、価値観に敏感な幅広い消費者にアピールするため、透明性の高い持続可能性の実践やパッケージの革新に投資する一方、信頼性を高めるために認証機関や地域社会の利害関係者とのパートナーシップを構築しています。これらの戦略的選択は、製品ロードマップ、M&A活動、市場参入への投資に反映されます。
ハラール化粧品のサプライチェーンの強靭性、認証の完全性、オムニチャネルでの成長を確保するために、リーダーが採用すべき実行可能な業務上・商業上のステップ
業界リーダーは、洞察を商業的成果に結びつけるために、一連の的を絞った業務上の提言を追求すべきです。コストのかかる再製造や上市の遅れを避けるため、製剤プロセスの早い段階で認証の統合を優先します。調達契約を認証要件に合わせることで、下流のコンプライアンス・リスクを軽減します。重要成分のデュアルソーシングやニアショアオプションの導入によりサプライヤーの適格性を強化し、関税の影響や物流の混乱を軽減します。SKUをマス、ミッドレンジ、プレミアムの各階層に細分化し、各階層を適切な認証の深さとマーケティング費用に合わせることで、製品ポートフォリオを最適化し、アクセシビリティを維持しながら利幅を守る。
オムニチャネル戦略を強化し、デジタルチャネルを活用して試用を促進し、ファーストパーティデータを収集します。消費者教育キャンペーンに投資し、ハラル認証、原材料の出所、安全性試験について透明性をもって説明し、多様な層の信頼を築きました。原料パートナーとの研究開発協力を加速し、制限された原料のハラル適合代替品を開発し、プレミアム・ポジショニングを支える実証可能な有効性エビデンスを作成します。分類、特恵貿易の機会、関税軽減戦略を積極的に管理する税関・関税ガバナンス機能を導入します。最後に、持続可能性と循環性の目標をパッケージングとオペレーションに組み込むことで、ハラル消費者層以外にも訴求範囲を広げ、輸出市場における規制の摩擦を軽減します。
一次インタビュー、現地監査、規制分析、サプライチェーンマッピングをどのように組み合わせ、防御可能で行動指向の洞察を生み出したかを説明する調査手法の透明性
これらの洞察の裏付けとなる調査は、質的手法と量的手法を組み合わせることで、堅牢性と実用的妥当性を確保しています。1次調査には、製剤化学者、サプライチェーンマネージャー、認証機関代表者、小売カテゴリーリーダーとの構造化インタビューが含まれ、業務実態、認証のボトルネック、小売業者の受容ダイナミクスを把握しました。小売環境やeコマースの店頭の実地監査では、マーチャンダイジング、ラベリング、消費者関与のアプローチを直接観察しました。二次調査では、規制関連文書、通関ガイダンス、特許・成分登録、貿易フロー分析などを駆使し、調達・流通チャネル全体における制約と機会のポイントを三角測量しました。
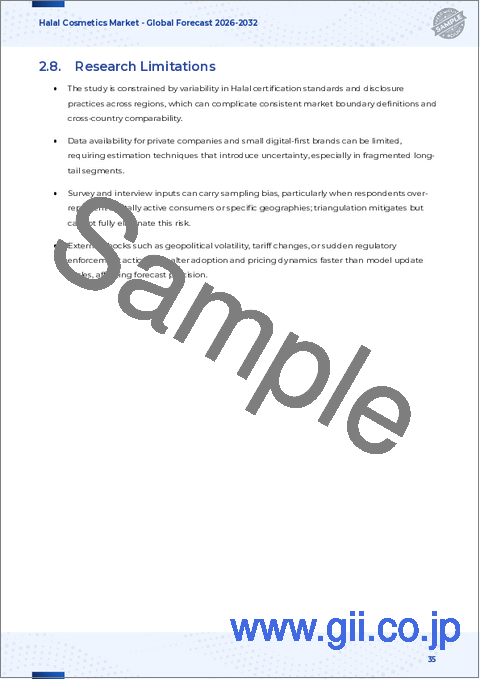
分析手法には、単一ソースの脆弱性を特定するためのサプライチェーンのマッピング、管轄区域間の承認の収束と乖離を判断するための比較認証分析、著名なマーケティング提案の背後にある証拠としての厳密性を評価するための製品クレームの検証評価などが含まれます。また、この調査手法では、シナリオに基づく感度分析を通じて、関税の変更、物流の混乱、規制の変更などのリスク要因も考慮しました。該当する場合には、複数の独立した専門家の情報源とのクロスチェックや文書監査を通じて、データの質を検証しました。限定事項としては、地域間の認証名称のばらつきや、一部のサプライヤー契約の専有的性質が挙げられるが、これらは匿名化された専門家のインプットと文書レビューによって軽減されました。
ハラール化粧品における競争優位性を形成するために、認証の厳格さ、製品の有効性、弾力性のあるサプライチェーンがどのように収束するかを示す戦略的要請の統合
結論として、ハラール化粧品カテゴリーは、認証の完全性、製品性能、オムニチャネルへのアクセシビリティが競争上の成功を左右する変曲点に立っています。研究開発、調達、製造にわたってハラル認証を制度化し、同時に成分の革新とデジタル・ファーストの商業モデルに投資する企業は、進化する消費者の期待に応えるのに最も有利な立場になると思われます。関税シフトと地域規制の複雑さは、機敏なサプライチェーン戦略と強固な税関ガバナンスの必要性を強めており、調達フットプリントと認証経路を積極的に適応させる企業は、コストとタイミングのリスクを軽減することができます。
ハラル認証を透明性のある持続可能性と安全性の主張と組み合わせることで、倫理的でパフォーマンスの高い美容ソリューションを求める多様な層へのアピールを広げることができます。現実的な実行には、規律あるポートフォリオ管理、認証取得とサプライチェーン回復力への的を絞った投資、そして実証可能な製品効能への絶え間ない集中が必要です。このような要素に取り組む企業は、マイナス面のリスクから身を守るだけでなく、競合がひしめく価値観主導のマーケットプレースにおいて、持続的なブランド差別化を実現することができます。
よくあるご質問
目次
第1章 序文
第2章 調査手法
第3章 エグゼクティブサマリー
第4章 市場の概要
第5章 市場洞察
- 化粧品における透明性のあるハラール認証のためのブロックチェーン技術の統合
- 意識の高いミレニアル世代の消費者をターゲットにしたジェンダーニュートラルなハラール化粧品ラインの台頭
- 生分解性包装代替品を使用した持続可能なハラール美容ブランドの成長
- アダプトゲン植物を配合した植物由来のハラールスキンケアの需要増加
- ハラール化粧品開発におけるAIを活用したパーソナライゼーションの導入
- GCCでのライブソーシャルコマースイベントを通じてハラールビューティーEコマースを拡大
- ハラール化粧品ブランドとマイクロインフルエンサーのコラボレーションによる真のオーディエンスエンゲージメント
- ASEANおよびGCC市場全体でハラール化粧品基準を調和させるための規制収束イニシアチブ
- ハラール認証を受けたウードや植物由来の香料の調査・イノベーションラボへの投資急増
- 拡張現実製品試着ソリューションを提供するハラール美容テクノロジースタートアップの出現
- アルコール、合成成分、動物由来成分を含まないハラール認証ネイルケアトリートメントの急増
- ヒゲケア、保湿、肌バリアサポートに重点を置いたハラールメンズグルーミングラインの発売
- カバー力、明るさ、SPF保護効果を兼ね備えた多機能ハラールBBクリームの需要
第6章 米国の関税の累積的な影響, 2025
第7章 AIの累積的影響, 2025
第8章 ハラール化粧品市場:製品タイプ別
- カラーコスメ
- デオドラント
- フレグランス
- ヘアケア
- スキンケア
第9章 ハラール化粧品市場:流通チャネル別
- オフライン
- デパート
- ハイパーマーケット・スーパーマーケット
- 薬局と美容店
- 専門店
- オンライン
- ブランドウェブサイト
- ECプラットフォーム
- ソーシャルコマース
第10章 ハラール化粧品市場:用途別
- ボディケア
- フェイシャルケア
- フレグランス
- ヘアケア
- メイクアップ
- オーラルケア
第11章 ハラール化粧品市場:エンドユーザー別
- 子供
- 男性
- ユニセックス
- 女性
第12章 ハラール化粧品市場:価格帯別
- 量産
- ミッドレンジ
- プレミアム
第13章 ハラール化粧品市場:地域別
- 南北アメリカ
- 北米
- ラテンアメリカ
- 欧州・中東・アフリカ
- 欧州
- 中東
- アフリカ
- アジア太平洋地域
第14章 ハラール化粧品市場:グループ別
- ASEAN
- GCC
- EU
- BRICS
- G7
- NATO
第15章 ハラール化粧品市場:国別
- 米国
- カナダ
- メキシコ
- ブラジル
- 英国
- ドイツ
- フランス
- ロシア
- イタリア
- スペイン
- 中国
- インド
- 日本
- オーストラリア
- 韓国
第16章 競合情勢
- 市場シェア分析, 2024
- FPNVポジショニングマトリックス, 2024
- 競合分析
- PT Paragon Technology and Innovation
- IBA Halal Care India Private Limited
- Amara Cosmetics FZC
- OnePure Beauty Sdn Bhd
- Safi Cosmetics Manufacturing Sdn Bhd
- Najel SAS
- Lyckina Group
- Shiffa LLC
- Herbolab Sdn Bhd
- Zaynab Cosmetics LLC

