|
|
市場調査レポート
商品コード
1459476
車の利用ベース自動車保険の世界市場 2024-2028Global Automotive Usage-Based Insurance Market 2024-2028 |
||||||

|
|||||||
カスタマイズ可能
|
|||||||


| 車の利用ベース自動車保険の世界市場 2024-2028 |
|
出版日: 2024年03月26日
発行: TechNavio
ページ情報: 英文 167 Pages
納期: 即納可能
|

全表示
- 概要
- 図表
- 目次
車の利用ベース自動車保険市場は2023-2028年に675億1,000万米ドル、予測期間中のCAGRは25.1%で成長すると予測されます。
当レポートでは、車の利用ベース自動車保険市場の全体的な分析、市場規模・予測、動向、成長促進要因、課題、約25のベンダーを網羅したベンダー分析などを掲載しています。
現在の市場シナリオ、最新動向と促進要因、市場環境全体に関する最新分析を提供しています。自動車のUBIの柔軟な価格体系、保険適用に関する政府規制の増加、自動車産業に資する技術環境の存在などが市場を牽引しています。
| 市場範囲 | |
|---|---|
| 基準年 | 2024 |
| 終了年 | 2028 |
| 予測期間 | 2024-2028 |
| 成長モメンタム | 加速 |
| 前年比2024年 | 22.69% |
| CAGR | 25.1% |
| 増分額 | 675億1,000万米ドル |
本調査では、今後数年間における車の利用ベース自動車保険市場の成長を促進する主な要因の1つとして、より良い運転習慣のために車の利用ベース自動車保険の採用が増加していることを挙げています。また、事故調査や盗難車回収における自動車のUBIの用途拡大や、スマートフォン対応UBIの出現は、市場の大きな需要につながります。
目次
第1章 エグゼクティブサマリー
- 市場概要
第2章 市場情勢
- 市場エコシステム
第3章 市場規模の評価
- 市場の定義
- 市場セグメント分析
- 市場規模 2023
- 市場の見通し 2023-2028
第4章 市場規模実績
- 車の利用ベース自動車保険の世界市場 2018-2022
- 用途別セグメント分析 2018-2022
- 価格体系セグメント分析 2018-2022
- 地域別セグメント分析 2018-2022
- 国別セグメント分析 2018-2022
第5章 ファイブフォース分析
- ファイブフォースの要約
- 買い手の交渉力
- 供給企業の交渉力
- 新規参入業者の脅威
- 代替品の脅威
- 競争の脅威
- 市況
第6章 市場セグメンテーション:用途別
- 市場セグメント
- 比較:用途別
- 組み込みUBI:市場規模と予測 2023-2028
- アプリベースのUBI:市場規模と予測 2023-2028
- 市場機会:用途別
第7章 市場セグメンテーション料金体系別
- 市場セグメント
- 比較料金体系別
- 運転行動連動型:市場規模と予測 2023-2028
- 走行距離連動型:市場規模と予測 2023-2028
- 運転方法管理型:市場規模と予測 2023-2028
- 市場機会料金体系別
第8章 顧客情勢
- 顧客情勢の概要
第9章 地域別情勢
- 地域別セグメンテーション
- 地域別比較
- 欧州:市場規模と予測 2023-2028
- 北米:市場規模と予測 2023-2028
- アジア太平洋:市場規模と予測 2023-2028
- 中東・アフリカ:市場規模と予測 2023-2028
- 南米:市場規模と予測 2023-2028
- 米国:市場規模と予測 2023-2028
- ドイツ:市場規模と予測 2023-2028
- 英国:市場規模と予測 2023-2028
- カナダ:市場規模と予測 2023-2028
- フランス:市場規模と予測 2023-2028
- 市場機会:地域情勢別
第10章 促進要因、課題、および動向
- 市場促進要因
- 市場の課題
- 促進要因と課題の影響
- 市場動向
第11章 ベンダー情勢
- 概要
- ベンダー情勢
- 混乱の状況
- 業界のリスク
第12章 ベンダー分析
- 対象ベンダー
- ベンダーの市場ポジショニング
- AXA Group
- Allianz SE
- Aviva insurance Ltd.
- Desjardins Group
- Direct Line Insurance Group Plc
- Discovery Ltd.
- GEICO
- Lemonade Inc.
- Liberty Mutual Insurance Co.
- Nationwide Mutual Insurance Co.
- The Allstate Corp.
- The Progressive Corp.
- The Travelers Co. Inc.
- USAA
- Zurich Insurance Co. Ltd.
第13章 付録
Exhibits:
- Exhibits1: Executive Summary - Chart on Market Overview
- Exhibits2: Executive Summary - Data Table on Market Overview
- Exhibits3: Executive Summary - Chart on Global Market Characteristics
- Exhibits4: Executive Summary - Chart on Market By Geographical Landscape
- Exhibits5: Executive Summary - Chart on Market Segmentation by Application
- Exhibits6: Executive Summary - Chart on Market Segmentation by Pricing Scheme
- Exhibits7: Executive Summary - Chart on Incremental Growth
- Exhibits8: Executive Summary - Data Table on Incremental Growth
- Exhibits9: Executive Summary - Chart on Vendor Market Positioning
- Exhibits10: Parent market
- Exhibits11: Market Characteristics
- Exhibits12: Offerings of vendors included in the market definition
- Exhibits13: Market segments
- Exhibits14: Chart on Global - Market size and forecast 2023-2028 ($ billion)
- Exhibits15: Data Table on Global - Market size and forecast 2023-2028 ($ billion)
- Exhibits16: Chart on Global Market: Year-over-year growth 2023-2028 (%)
- Exhibits17: Data Table on Global Market: Year-over-year growth 2023-2028 (%)
- Exhibits18: Historic Market Size - Data Table on global automotive usage-based insurance market 2018 - 2022 ($ billion)
- Exhibits19: Historic Market Size - Application Segment 2018 - 2022 ($ billion)
- Exhibits20: Historic Market Size - Pricing Scheme Segment 2018 - 2022 ($ billion)
- Exhibits21: Historic Market Size - Geography Segment 2018 - 2022 ($ billion)
- Exhibits22: Historic Market Size - Country Segment 2018 - 2022 ($ billion)
- Exhibits23: Five forces analysis - Comparison between 2023 and 2028
- Exhibits24: Chart on Bargaining power of buyers - Impact of key factors 2023 and 2028
- Exhibits25: Bargaining power of suppliers - Impact of key factors in 2023 and 2028
- Exhibits26: Threat of new entrants - Impact of key factors in 2023 and 2028
- Exhibits27: Threat of substitutes - Impact of key factors in 2023 and 2028
- Exhibits28: Threat of rivalry - Impact of key factors in 2023 and 2028
- Exhibits29: Chart on Market condition - Five forces 2023 and 2028
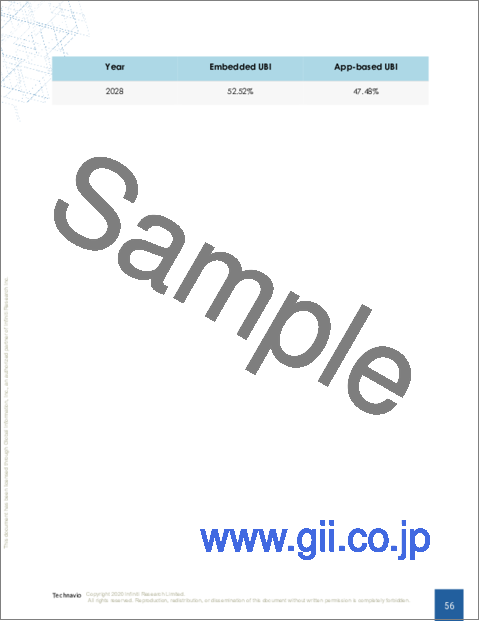
- Exhibits30: Chart on Application - Market share 2023-2028 (%)
- Exhibits31: Data Table on Application - Market share 2023-2028 (%)
- Exhibits32: Chart on Comparison by Application
- Exhibits33: Data Table on Comparison by Application
- Exhibits34: Chart on Embedded UBI - Market size and forecast 2023-2028 ($ billion)
- Exhibits35: Data Table on Embedded UBI - Market size and forecast 2023-2028 ($ billion)
- Exhibits36: Chart on Embedded UBI - Year-over-year growth 2023-2028 (%)
- Exhibits37: Data Table on Embedded UBI - Year-over-year growth 2023-2028 (%)
- Exhibits38: Chart on App-based UBI - Market size and forecast 2023-2028 ($ billion)
- Exhibits39: Data Table on App-based UBI - Market size and forecast 2023-2028 ($ billion)
- Exhibits40: Chart on App-based UBI - Year-over-year growth 2023-2028 (%)
- Exhibits41: Data Table on App-based UBI - Year-over-year growth 2023-2028 (%)
- Exhibits42: Market opportunity by Application ($ billion)
- Exhibits43: Data Table on Market opportunity by Application ($ billion)
- Exhibits44: Chart on Pricing Scheme - Market share 2023-2028 (%)
- Exhibits45: Data Table on Pricing Scheme - Market share 2023-2028 (%)
- Exhibits46: Chart on Comparison by Pricing Scheme
- Exhibits47: Data Table on Comparison by Pricing Scheme
- Exhibits48: Chart on PHYD - Market size and forecast 2023-2028 ($ billion)
- Exhibits49: Data Table on PHYD - Market size and forecast 2023-2028 ($ billion)
- Exhibits50: Chart on PHYD - Year-over-year growth 2023-2028 (%)
- Exhibits51: Data Table on PHYD - Year-over-year growth 2023-2028 (%)
- Exhibits52: Chart on PAYD - Market size and forecast 2023-2028 ($ billion)
- Exhibits53: Data Table on PAYD - Market size and forecast 2023-2028 ($ billion)
- Exhibits54: Chart on PAYD - Year-over-year growth 2023-2028 (%)
- Exhibits55: Data Table on PAYD - Year-over-year growth 2023-2028 (%)
- Exhibits56: Chart on MHYD - Market size and forecast 2023-2028 ($ billion)
- Exhibits57: Data Table on MHYD - Market size and forecast 2023-2028 ($ billion)
- Exhibits58: Chart on MHYD - Year-over-year growth 2023-2028 (%)
- Exhibits59: Data Table on MHYD - Year-over-year growth 2023-2028 (%)
- Exhibits60: Market opportunity by Pricing Scheme ($ billion)
- Exhibits61: Data Table on Market opportunity by Pricing Scheme ($ billion)
- Exhibits62: Analysis of price sensitivity, lifecycle, customer purchase basket, adoption rates, and purchase criteria
- Exhibits63: Chart on Market share By Geographical Landscape 2023-2028 (%)
- Exhibits64: Data Table on Market share By Geographical Landscape 2023-2028 (%)
- Exhibits65: Chart on Geographic comparison
- Exhibits66: Data Table on Geographic comparison
- Exhibits67: Chart on Europe - Market size and forecast 2023-2028 ($ billion)
- Exhibits68: Data Table on Europe - Market size and forecast 2023-2028 ($ billion)
- Exhibits69: Chart on Europe - Year-over-year growth 2023-2028 (%)
- Exhibits70: Data Table on Europe - Year-over-year growth 2023-2028 (%)
- Exhibits71: Chart on North America - Market size and forecast 2023-2028 ($ billion)
- Exhibits72: Data Table on North America - Market size and forecast 2023-2028 ($ billion)
- Exhibits73: Chart on North America - Year-over-year growth 2023-2028 (%)
- Exhibits74: Data Table on North America - Year-over-year growth 2023-2028 (%)
- Exhibits75: Chart on APAC - Market size and forecast 2023-2028 ($ billion)
- Exhibits76: Data Table on APAC - Market size and forecast 2023-2028 ($ billion)
- Exhibits77: Chart on APAC - Year-over-year growth 2023-2028 (%)
- Exhibits78: Data Table on APAC - Year-over-year growth 2023-2028 (%)
- Exhibits79: Chart on Middle East and Africa - Market size and forecast 2023-2028 ($ billion)
- Exhibits80: Data Table on Middle East and Africa - Market size and forecast 2023-2028 ($ billion)
- Exhibits81: Chart on Middle East and Africa - Year-over-year growth 2023-2028 (%)
- Exhibits82: Data Table on Middle East and Africa - Year-over-year growth 2023-2028 (%)
- Exhibits83: Chart on South America - Market size and forecast 2023-2028 ($ billion)
- Exhibits84: Data Table on South America - Market size and forecast 2023-2028 ($ billion)
- Exhibits85: Chart on South America - Year-over-year growth 2023-2028 (%)
- Exhibits86: Data Table on South America - Year-over-year growth 2023-2028 (%)
- Exhibits87: Chart on US - Market size and forecast 2023-2028 ($ billion)
- Exhibits88: Data Table on US - Market size and forecast 2023-2028 ($ billion)
- Exhibits89: Chart on US - Year-over-year growth 2023-2028 (%)
- Exhibits90: Data Table on US - Year-over-year growth 2023-2028 (%)
- Exhibits91: Chart on Germany - Market size and forecast 2023-2028 ($ billion)
- Exhibits92: Data Table on Germany - Market size and forecast 2023-2028 ($ billion)
- Exhibits93: Chart on Germany - Year-over-year growth 2023-2028 (%)
- Exhibits94: Data Table on Germany - Year-over-year growth 2023-2028 (%)
- Exhibits95: Chart on UK - Market size and forecast 2023-2028 ($ billion)
- Exhibits96: Data Table on UK - Market size and forecast 2023-2028 ($ billion)
- Exhibits97: Chart on UK - Year-over-year growth 2023-2028 (%)
- Exhibits98: Data Table on UK - Year-over-year growth 2023-2028 (%)
- Exhibits99: Chart on Canada - Market size and forecast 2023-2028 ($ billion)
- Exhibits100: Data Table on Canada - Market size and forecast 2023-2028 ($ billion)
- Exhibits101: Chart on Canada - Year-over-year growth 2023-2028 (%)
- Exhibits102: Data Table on Canada - Year-over-year growth 2023-2028 (%)
- Exhibits103: Chart on France - Market size and forecast 2023-2028 ($ billion)
- Exhibits104: Data Table on France - Market size and forecast 2023-2028 ($ billion)
- Exhibits105: Chart on France - Year-over-year growth 2023-2028 (%)
- Exhibits106: Data Table on France - Year-over-year growth 2023-2028 (%)
- Exhibits107: Market opportunity By Geographical Landscape ($ billion)
- Exhibits108: Data Tables on Market opportunity By Geographical Landscape ($ billion)
- Exhibits109: Impact of drivers and challenges in 2023 and 2028
- Exhibits110: Overview on Criticality of inputs and Factors of differentiation
- Exhibits111: Overview on factors of disruption
- Exhibits112: Impact of key risks on business
- Exhibits113: Vendors covered
- Exhibits114: Matrix on vendor position and classification
- Exhibits115: AXA Group - Overview
- Exhibits116: AXA Group - Business segments
- Exhibits117: AXA Group - Key news
- Exhibits118: AXA Group - Key offerings
- Exhibits119: AXA Group - Segment focus
- Exhibits120: Allianz SE - Overview
- Exhibits121: Allianz SE - Business segments
- Exhibits122: Allianz SE - Key news
- Exhibits123: Allianz SE - Key offerings
- Exhibits124: Allianz SE - Segment focus
- Exhibits125: Aviva insurance Ltd. - Overview
- Exhibits126: Aviva insurance Ltd. - Business segments
- Exhibits127: Aviva insurance Ltd. - Key news
- Exhibits128: Aviva insurance Ltd. - Key offerings
- Exhibits129: Aviva insurance Ltd. - Segment focus
- Exhibits130: Desjardins Group - Overview
- Exhibits131: Desjardins Group - Business segments
- Exhibits132: Desjardins Group - Key offerings
- Exhibits133: Desjardins Group - Segment focus
- Exhibits134: Direct Line Insurance Group Plc - Overview
- Exhibits135: Direct Line Insurance Group Plc - Business segments
- Exhibits136: Direct Line Insurance Group Plc - Key news
- Exhibits137: Direct Line Insurance Group Plc - Key offerings
- Exhibits138: Direct Line Insurance Group Plc - Segment focus
- Exhibits139: Discovery Ltd. - Overview
- Exhibits140: Discovery Ltd. - Business segments
- Exhibits141: Discovery Ltd. - Key offerings
- Exhibits142: Discovery Ltd. - Segment focus
- Exhibits143: GEICO - Overview
- Exhibits144: GEICO - Product / Service
- Exhibits145: GEICO - Key offerings
- Exhibits146: Lemonade Inc. - Overview
- Exhibits147: Lemonade Inc. - Product / Service
- Exhibits148: Lemonade Inc. - Key offerings
- Exhibits149: Liberty Mutual Insurance Co. - Overview
- Exhibits150: Liberty Mutual Insurance Co. - Business segments
- Exhibits151: Liberty Mutual Insurance Co. - Key offerings
- Exhibits152: Liberty Mutual Insurance Co. - Segment focus
- Exhibits153: Nationwide Mutual Insurance Co. - Overview
- Exhibits154: Nationwide Mutual Insurance Co. - Product / Service
- Exhibits155: Nationwide Mutual Insurance Co. - Key offerings
- Exhibits156: The Allstate Corp. - Overview
- Exhibits157: The Allstate Corp. - Business segments
- Exhibits158: The Allstate Corp. - Key offerings
- Exhibits159: The Allstate Corp. - Segment focus
- Exhibits160: The Progressive Corp. - Overview
- Exhibits161: The Progressive Corp. - Product / Service
- Exhibits162: The Progressive Corp. - Key offerings
- Exhibits163: The Travelers Co. Inc. - Overview
- Exhibits164: The Travelers Co. Inc. - Business segments
- Exhibits165: The Travelers Co. Inc. - Key offerings
- Exhibits166: The Travelers Co. Inc. - Segment focus
- Exhibits167: USAA - Overview
- Exhibits168: USAA - Product / Service
- Exhibits169: USAA - Key offerings
- Exhibits170: Zurich Insurance Co. Ltd. - Overview
- Exhibits171: Zurich Insurance Co. Ltd. - Business segments
- Exhibits172: Zurich Insurance Co. Ltd. - Key offerings
- Exhibits173: Zurich Insurance Co. Ltd. - Segment focus
- Exhibits174: Inclusions checklist
- Exhibits175: Exclusions checklist
- Exhibits176: Currency conversion rates for US$
- Exhibits177: Research methodology
- Exhibits178: Validation techniques employed for market sizing
- Exhibits179: Information sources
- Exhibits180: List of abbreviations
The automotive usage-based insurance market is forecasted to grow by USD 67.51 bn during 2023-2028, accelerating at a CAGR of 25.1% during the forecast period. The report on the automotive usage-based insurance market provides a holistic analysis, market size and forecast, trends, growth drivers, and challenges, as well as vendor analysis covering around 25 vendors.
The report offers an up-to-date analysis regarding the current market scenario, the latest trends and drivers, and the overall market environment. The market is driven by flexible pricing schemes of automotive UBI, increasing government regulations for insurance coverage, and the presence of a conducive technology environment for the automotive industry.
| Market Scope | |
|---|---|
| Base Year | 2024 |
| End Year | 2028 |
| Series Year | 2024-2028 |
| Growth Momentum | Accelerate |
| YOY 2024 | 22.69% |
| CAGR | 25.1% |
| Incremental Value | $67.51bn |
Technavio's automotive usage-based insurance market is segmented as below:
By Application
- Embedded UBI
- App-based UBI
By Pricing Scheme
- PHYD
- PAYD
- MHYD
By Geographical Landscape
- Europe
- North America
- APAC
- Middle East and Africa
- South America
This study identifies the increasing adoption of automotive usage-based insurance for better driving habits as one of the prime reasons driving the automotive usage-based insurance market growth during the next few years. Also, the growing application of automotive UBI in accident investigation and recovery of stolen vehicles and the emergence of smartphone-enabled UBI will lead to sizable demand in the market.
The report on the automotive usage-based insurance market covers the following areas:
- Automotive usage-based insurance market sizing
- Automotive usage-based insurance market forecast
- Automotive usage-based insurance market industry analysis
The robust vendor analysis is designed to help clients improve their market position, and in line with this, this report provides a detailed analysis of several leading automotive usage-based insurance market vendors that include AXA Group, ACKO General Insurance Ltd., Allianz SE, Aviva Insurance Ltd., Desjardins Group, Discovery Ltd., Direct Line Insurance Group Plc, GEICO, HDFC Bank Ltd., Lemonade Inc., Liberty Mutual Insurance Co., Mile Auto Inc., Nationwide Mutual Insurance Co., Root Inc., The Allstate Corp., The Progressive Corp., The Travelers Co. Inc., USAA, Verizon Communications Inc., and Zurich Insurance Co. Ltd. Also, the automotive usage-based insurance market analysis report includes information on upcoming trends and challenges that will influence market growth. This is to help companies strategize and leverage all forthcoming growth opportunities.
The study was conducted using an objective combination of primary and secondary information including inputs from key participants in the industry. The report contains a comprehensive market and vendor landscape in addition to an analysis of the key vendors.
The publisher presents a detailed picture of the market by way of study, synthesis, and summation of data from multiple sources through an analysis of key parameters such as profit, pricing, competition, and promotions. It presents various market facets by identifying the key industry influencers. The data presented is comprehensive, reliable, and a result of extensive research - both primary and secondary. The market research reports provide a complete competitive landscape and an in-depth vendor selection methodology and analysis using qualitative and quantitative research to forecast accurate market growth.
Table of Contents
1 Executive Summary
- 1.1 Market overview
2 Market Landscape
- 2.1 Market ecosystem
3 Market Sizing
- 3.1 Market definition
- 3.2 Market segment analysis
- 3.3 Market size 2023
- 3.4 Market outlook: Forecast for 2023-2028
4 Historic Market Size
- 4.1 Global automotive usage-based insurance market 2018 - 2022
- 4.2 Application Segment Analysis 2018 - 2022
- 4.3 Pricing Scheme Segment Analysis 2018 - 2022
- 4.4 Geography Segment Analysis 2018 - 2022
- 4.5 Country Segment Analysis 2018 - 2022
5 Five Forces Analysis
- 5.1 Five forces summary
- 5.2 Bargaining power of buyers
- 5.3 Bargaining power of suppliers
- 5.4 Threat of new entrants
- 5.5 Threat of substitutes
- 5.6 Threat of rivalry
- 5.7 Market condition
6 Market Segmentation by Application
- 6.1 Market segments
- 6.2 Comparison by Application
- 6.3 Embedded UBI - Market size and forecast 2023-2028
- 6.4 App-based UBI - Market size and forecast 2023-2028
- 6.5 Market opportunity by Application
7 Market Segmentation by Pricing Scheme
- 7.1 Market segments
- 7.2 Comparison by Pricing Scheme
- 7.3 PHYD - Market size and forecast 2023-2028
- 7.4 PAYD - Market size and forecast 2023-2028
- 7.5 MHYD - Market size and forecast 2023-2028
- 7.6 Market opportunity by Pricing Scheme
8 Customer Landscape
- 8.1 Customer landscape overview
9 Geographic Landscape
- 9.1 Geographic segmentation
- 9.2 Geographic comparison
- 9.3 Europe - Market size and forecast 2023-2028
- 9.4 North America - Market size and forecast 2023-2028
- 9.5 APAC - Market size and forecast 2023-2028
- 9.6 Middle East and Africa - Market size and forecast 2023-2028
- 9.7 South America - Market size and forecast 2023-2028
- 9.8 US - Market size and forecast 2023-2028
- 9.9 Germany - Market size and forecast 2023-2028
- 9.10 UK - Market size and forecast 2023-2028
- 9.11 Canada - Market size and forecast 2023-2028
- 9.12 France - Market size and forecast 2023-2028
- 9.13 Market opportunity By Geographical Landscape
10 Drivers, Challenges, and Trends
- 10.1 Market drivers
- 10.2 Market challenges
- 10.3 Impact of drivers and challenges
- 10.4 Market trends
11 Vendor Landscape
- 11.1 Overview
- 11.2 Vendor landscape
- 11.3 Landscape disruption
- 11.4 Industry risks
12 Vendor Analysis
- 12.1 Vendors covered
- 12.2 Market positioning of vendors
- 12.3 AXA Group
- 12.4 Allianz SE
- 12.5 Aviva insurance Ltd.
- 12.6 Desjardins Group
- 12.7 Direct Line Insurance Group Plc
- 12.8 Discovery Ltd.
- 12.9 GEICO
- 12.10 Lemonade Inc.
- 12.11 Liberty Mutual Insurance Co.
- 12.12 Nationwide Mutual Insurance Co.
- 12.13 The Allstate Corp.
- 12.14 The Progressive Corp.
- 12.15 The Travelers Co. Inc.
- 12.16 USAA
- 12.17 Zurich Insurance Co. Ltd.
13 Appendix
- 13.1 Scope of the report
- 13.2 Inclusions and exclusions checklist
- 13.3 Currency conversion rates for US$
- 13.4 Research methodology
- 13.5 List of abbreviations
