|
|
市場調査レポート
商品コード
1645589
スマートビルの世界市場、2025-2029年Global Smart Buildings Market 2025-2029 |
||||||

|
|||||||
カスタマイズ可能
|
|||||||


| スマートビルの世界市場、2025-2029年 |
|
出版日: 2025年01月18日
発行: TechNavio
ページ情報: 英文 219 Pages
納期: 即納可能
|

全表示
- 概要
- 図表
- 目次
スマートビル市場は2024-2029年に768億米ドル、予測期間中のCAGRは11.3%で成長すると予測されます。
当レポートでは、スマートビル市場の全体的な分析、市場規模・予測、動向、成長促進要因、課題、約25のベンダーを網羅したベンダー分析などを掲載しています。
現在の市場シナリオ、最新動向と促進要因、市場環境全体に関する最新分析を提供しています。同市場は、ビジネス成果を高めるためのビルオートメーションへのニーズの高まり、安全・セキュリティシステムの強化へのニーズ、エネルギー節約のニーズの高まりによって牽引されています。
| 市場範囲 | |
|---|---|
| 基準年 | 2025 |
| 終了年 | 2029 |
| 予測期間 | 2025-2029 |
| 成長モメンタム | 加速 |
| 前年比2025年 | 9.9% |
| CAGR | 11.3% |
| 増分額 | 768億米ドル |
本調査では、今後数年間のスマートビル市場の成長を促進する主な要因の1つとして、IoTとビルディングオートメーションソフトウェアの統合の増加を挙げています。また、BIOT の概念の高まりや、スマートシティに向けた政府の取り組みへの注目の高まりも、市場の大きな需要につながると思われます。
目次
第1章 エグゼクティブサマリー
- 市場概要
第2章 Technavio分析
- 価格・ライフサイクル・顧客購入バスケット・採用率・購入基準の分析
- インプットの重要性と差別化の要因
- 混乱の要因
- 促進要因と課題の影響
第3章 市場情勢
- 市場エコシステム
- 市場の特徴
- バリューチェーン分析
第4章 市場規模
- 市場の定義
- 市場セグメント分析
- 市場規模 2024
- 市場の見通し 2024-2029
第5章 市場規模実績
- スマートビルの世界市場 2019-2023
- 製品セグメント分析 2019-2023
- 部品セグメント分析 2019-2023
- 地域別セグメント分析 2019-2023
- 国別セグメント分析 2019-2023
第6章 定性分析
- AIの影響:スマートビルの世界市場
第7章 ファイブフォース分析
- ファイブフォースの要約
- 買い手の交渉力
- 供給企業の交渉力
- 新規参入業者の脅威
- 代替品の脅威
- 競争の脅威
- 市況
第8章 市場セグメンテーション:製品別
- 市場セグメント
- 比較:製品別
- BMS:市場規模と予測 2024-2029
- 空調設備:市場規模と予測 2024-2029
- 照明制御:市場規模と予測 2024-2029
- セキュリティとアクセス制御:市場規模と予測 2024-2029
- その他:市場規模と予測 2024-2029
- 市場機会:製品別
第9章 市場セグメンテーション:コンポーネント別
- 市場セグメント
- 比較:コンポーネント別
- ソフトウェア:市場規模と予測 2024-2029
- ハードウェア:市場規模と予測 2024-2029
- サービス:市場規模と予測 2024-2029
- 市場機会:コンポーネント別
第10章 顧客情勢
- 顧客情勢の概要
第11章 地域別情勢
- 地域別セグメンテーション
- 地域別比較
- 北米:市場規模と予測 2024-2029
- 欧州:市場規模と予測 2024-2029
- アジア太平洋:市場規模と予測 2024-2029
- 南米:市場規模と予測 2024-2029
- 中東・アフリカ:市場規模と予測 2024-2029
- 米国:市場規模と予測 2024-2029
- 英国:市場規模と予測 2024-2029
- ドイツ:市場規模と予測 2024-2029
- 中国:市場規模と予測 2024-2029
- 日本:市場規模と予測 2024-2029
- フランス:市場規模と予測 2024-2029
- カナダ:市場規模と予測 2024-2029
- インド:市場規模と予測 2024-2029
- ブラジル:市場規模と予測 2024-2029
- アラブ首長国連邦:市場規模と予測 2024-2029
- 市場機会:地域情勢別
第12章 促進要因・課題・機会・抑制要因
- 市場促進要因
- 市場の課題
- 促進要因と課題の影響
- 市場の機会・抑制要因
第13章 競合情勢
- 概要
- 競合情勢
- 混乱の状況
- 業界のリスク
第14章 競合分析
- 企業プロファイル
- 企業ランキング指数
- 企業の市場ポジショニング
- ABB Ltd
- Advantech Co. Ltd.
- BuildingLogiX
- Cisco Systems Inc.
- Delta Electronics Inc.
- Emerson Electric Co.
- Honeywell International Inc.
- International Business Machines Corp.
- Johnson Controls
- L and T Technology Services Ltd.
- Robert Bosch GmbH
- Schneider Electric SE
- Siemens AG
- Snap One LLC
- Softdel System Pte. Ltd.
第15章 付録
Exhibits:
- Exhibits1: Executive Summary - Chart on Market Overview
- Exhibits2: Executive Summary - Data Table on Market Overview
- Exhibits3: Executive Summary - Chart on Global Market Characteristics
- Exhibits4: Executive Summary - Chart on Market By Geographical Landscape
- Exhibits5: Executive Summary - Chart on Market Segmentation by Product
- Exhibits6: Executive Summary - Chart on Market Segmentation by Component
- Exhibits7: Executive Summary - Chart on Incremental Growth
- Exhibits8: Executive Summary - Data Table on Incremental Growth
- Exhibits9: Executive Summary - Chart on Company Market Positioning
- Exhibits10: Analysis of price sensitivity, lifecycle, customer purchase basket, adoption rates, and purchase criteria
- Exhibits11: Overview on criticality of inputs and factors of differentiation
- Exhibits12: Overview on factors of disruption
- Exhibits13: Impact of drivers and challenges in 2024 and 2029
- Exhibits14: Parent Market
- Exhibits15: Data Table on - Parent Market
- Exhibits16: Market characteristics analysis
- Exhibits17: Value chain analysis
- Exhibits18: Offerings of companies included in the market definition
- Exhibits19: Market segments
- Exhibits20: Chart on Global - Market size and forecast 2024-2029 ($ billion)
- Exhibits21: Data Table on Global - Market size and forecast 2024-2029 ($ billion)
- Exhibits22: Chart on Global Market: Year-over-year growth 2024-2029 (%)
- Exhibits23: Data Table on Global Market: Year-over-year growth 2024-2029 (%)
- Exhibits24: Historic Market Size - Data Table on Global Smart Buildings Market 2019 - 2023 ($ billion)
- Exhibits25: Historic Market Size - Product Segment 2019 - 2023 ($ billion)
- Exhibits26: Historic Market Size - Component Segment 2019 - 2023 ($ billion)
- Exhibits27: Historic Market Size - Geography Segment 2019 - 2023 ($ billion)
- Exhibits28: Historic Market Size - Country Segment 2019 - 2023 ($ billion)
- Exhibits29: Five forces analysis - Comparison between 2024 and 2029
- Exhibits30: Bargaining power of buyers - Impact of key factors 2024 and 2029
- Exhibits31: Bargaining power of suppliers - Impact of key factors in 2024 and 2029
- Exhibits32: Threat of new entrants - Impact of key factors in 2024 and 2029
- Exhibits33: Threat of substitutes - Impact of key factors in 2024 and 2029
- Exhibits34: Threat of rivalry - Impact of key factors in 2024 and 2029
- Exhibits35: Chart on Market condition - Five forces 2024 and 2029
- Exhibits36: Chart on Product - Market share 2024-2029 (%)
- Exhibits37: Data Table on Product - Market share 2024-2029 (%)
- Exhibits38: Chart on Comparison by Product
- Exhibits39: Data Table on Comparison by Product
- Exhibits40: Chart on BMS - Market size and forecast 2024-2029 ($ billion)
- Exhibits41: Data Table on BMS - Market size and forecast 2024-2029 ($ billion)
- Exhibits42: Chart on BMS - Year-over-year growth 2024-2029 (%)
- Exhibits43: Data Table on BMS - Year-over-year growth 2024-2029 (%)
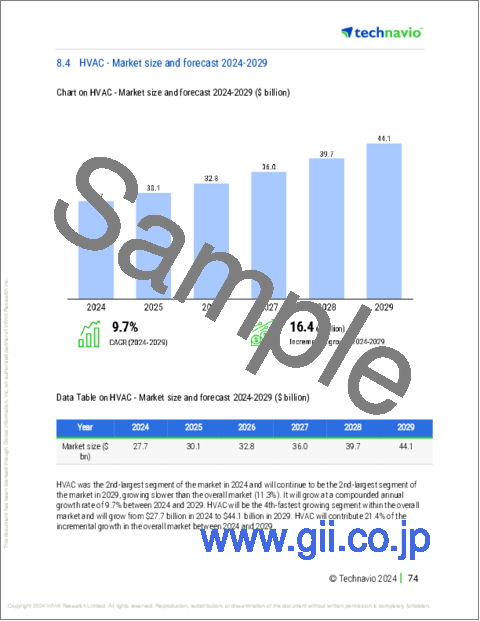
- Exhibits44: Chart on HVAC - Market size and forecast 2024-2029 ($ billion)
- Exhibits45: Data Table on HVAC - Market size and forecast 2024-2029 ($ billion)
- Exhibits46: Chart on HVAC - Year-over-year growth 2024-2029 (%)
- Exhibits47: Data Table on HVAC - Year-over-year growth 2024-2029 (%)
- Exhibits48: Chart on Lighting control - Market size and forecast 2024-2029 ($ billion)
- Exhibits49: Data Table on Lighting control - Market size and forecast 2024-2029 ($ billion)
- Exhibits50: Chart on Lighting control - Year-over-year growth 2024-2029 (%)
- Exhibits51: Data Table on Lighting control - Year-over-year growth 2024-2029 (%)
- Exhibits52: Chart on Security and access control - Market size and forecast 2024-2029 ($ billion)
- Exhibits53: Data Table on Security and access control - Market size and forecast 2024-2029 ($ billion)
- Exhibits54: Chart on Security and access control - Year-over-year growth 2024-2029 (%)
- Exhibits55: Data Table on Security and access control - Year-over-year growth 2024-2029 (%)
- Exhibits56: Chart on Others - Market size and forecast 2024-2029 ($ billion)
- Exhibits57: Data Table on Others - Market size and forecast 2024-2029 ($ billion)
- Exhibits58: Chart on Others - Year-over-year growth 2024-2029 (%)
- Exhibits59: Data Table on Others - Year-over-year growth 2024-2029 (%)
- Exhibits60: Market opportunity by Product ($ billion)
- Exhibits61: Data Table on Market opportunity by Product ($ billion)
- Exhibits62: Chart on Component - Market share 2024-2029 (%)
- Exhibits63: Data Table on Component - Market share 2024-2029 (%)
- Exhibits64: Chart on Comparison by Component
- Exhibits65: Data Table on Comparison by Component
- Exhibits66: Chart on Software - Market size and forecast 2024-2029 ($ billion)
- Exhibits67: Data Table on Software - Market size and forecast 2024-2029 ($ billion)
- Exhibits68: Chart on Software - Year-over-year growth 2024-2029 (%)
- Exhibits69: Data Table on Software - Year-over-year growth 2024-2029 (%)
- Exhibits70: Chart on Hardware - Market size and forecast 2024-2029 ($ billion)
- Exhibits71: Data Table on Hardware - Market size and forecast 2024-2029 ($ billion)
- Exhibits72: Chart on Hardware - Year-over-year growth 2024-2029 (%)
- Exhibits73: Data Table on Hardware - Year-over-year growth 2024-2029 (%)
- Exhibits74: Chart on Services - Market size and forecast 2024-2029 ($ billion)
- Exhibits75: Data Table on Services - Market size and forecast 2024-2029 ($ billion)
- Exhibits76: Chart on Services - Year-over-year growth 2024-2029 (%)
- Exhibits77: Data Table on Services - Year-over-year growth 2024-2029 (%)
- Exhibits78: Market opportunity by Component ($ billion)
- Exhibits79: Data Table on Market opportunity by Component ($ billion)
- Exhibits80: Analysis of price sensitivity, lifecycle, customer purchase basket, adoption rates, and purchase criteria
- Exhibits81: Chart on Market share By Geographical Landscape 2024-2029 (%)
- Exhibits82: Data Table on Market share By Geographical Landscape 2024-2029 (%)
- Exhibits83: Chart on Geographic comparison
- Exhibits84: Data Table on Geographic comparison
- Exhibits85: Chart on North America - Market size and forecast 2024-2029 ($ billion)
- Exhibits86: Data Table on North America - Market size and forecast 2024-2029 ($ billion)
- Exhibits87: Chart on North America - Year-over-year growth 2024-2029 (%)
- Exhibits88: Data Table on North America - Year-over-year growth 2024-2029 (%)
- Exhibits89: Chart on Europe - Market size and forecast 2024-2029 ($ billion)
- Exhibits90: Data Table on Europe - Market size and forecast 2024-2029 ($ billion)
- Exhibits91: Chart on Europe - Year-over-year growth 2024-2029 (%)
- Exhibits92: Data Table on Europe - Year-over-year growth 2024-2029 (%)
- Exhibits93: Chart on APAC - Market size and forecast 2024-2029 ($ billion)
- Exhibits94: Data Table on APAC - Market size and forecast 2024-2029 ($ billion)
- Exhibits95: Chart on APAC - Year-over-year growth 2024-2029 (%)
- Exhibits96: Data Table on APAC - Year-over-year growth 2024-2029 (%)
- Exhibits97: Chart on South America - Market size and forecast 2024-2029 ($ billion)
- Exhibits98: Data Table on South America - Market size and forecast 2024-2029 ($ billion)
- Exhibits99: Chart on South America - Year-over-year growth 2024-2029 (%)
- Exhibits100: Data Table on South America - Year-over-year growth 2024-2029 (%)
- Exhibits101: Chart on Middle East and Africa - Market size and forecast 2024-2029 ($ billion)
- Exhibits102: Data Table on Middle East and Africa - Market size and forecast 2024-2029 ($ billion)
- Exhibits103: Chart on Middle East and Africa - Year-over-year growth 2024-2029 (%)
- Exhibits104: Data Table on Middle East and Africa - Year-over-year growth 2024-2029 (%)
- Exhibits105: Chart on US - Market size and forecast 2024-2029 ($ billion)
- Exhibits106: Data Table on US - Market size and forecast 2024-2029 ($ billion)
- Exhibits107: Chart on US - Year-over-year growth 2024-2029 (%)
- Exhibits108: Data Table on US - Year-over-year growth 2024-2029 (%)
- Exhibits109: Chart on UK - Market size and forecast 2024-2029 ($ billion)
- Exhibits110: Data Table on UK - Market size and forecast 2024-2029 ($ billion)
- Exhibits111: Chart on UK - Year-over-year growth 2024-2029 (%)
- Exhibits112: Data Table on UK - Year-over-year growth 2024-2029 (%)
- Exhibits113: Chart on Germany - Market size and forecast 2024-2029 ($ billion)
- Exhibits114: Data Table on Germany - Market size and forecast 2024-2029 ($ billion)
- Exhibits115: Chart on Germany - Year-over-year growth 2024-2029 (%)
- Exhibits116: Data Table on Germany - Year-over-year growth 2024-2029 (%)
- Exhibits117: Chart on China - Market size and forecast 2024-2029 ($ billion)
- Exhibits118: Data Table on China - Market size and forecast 2024-2029 ($ billion)
- Exhibits119: Chart on China - Year-over-year growth 2024-2029 (%)
- Exhibits120: Data Table on China - Year-over-year growth 2024-2029 (%)
- Exhibits121: Chart on Japan - Market size and forecast 2024-2029 ($ billion)
- Exhibits122: Data Table on Japan - Market size and forecast 2024-2029 ($ billion)
- Exhibits123: Chart on Japan - Year-over-year growth 2024-2029 (%)
- Exhibits124: Data Table on Japan - Year-over-year growth 2024-2029 (%)
- Exhibits125: Chart on France - Market size and forecast 2024-2029 ($ billion)
- Exhibits126: Data Table on France - Market size and forecast 2024-2029 ($ billion)
- Exhibits127: Chart on France - Year-over-year growth 2024-2029 (%)
- Exhibits128: Data Table on France - Year-over-year growth 2024-2029 (%)
- Exhibits129: Chart on Canada - Market size and forecast 2024-2029 ($ billion)
- Exhibits130: Data Table on Canada - Market size and forecast 2024-2029 ($ billion)
- Exhibits131: Chart on Canada - Year-over-year growth 2024-2029 (%)
- Exhibits132: Data Table on Canada - Year-over-year growth 2024-2029 (%)
- Exhibits133: Chart on India - Market size and forecast 2024-2029 ($ billion)
- Exhibits134: Data Table on India - Market size and forecast 2024-2029 ($ billion)
- Exhibits135: Chart on India - Year-over-year growth 2024-2029 (%)
- Exhibits136: Data Table on India - Year-over-year growth 2024-2029 (%)
- Exhibits137: Chart on Brazil - Market size and forecast 2024-2029 ($ billion)
- Exhibits138: Data Table on Brazil - Market size and forecast 2024-2029 ($ billion)
- Exhibits139: Chart on Brazil - Year-over-year growth 2024-2029 (%)
- Exhibits140: Data Table on Brazil - Year-over-year growth 2024-2029 (%)
- Exhibits141: Chart on UAE - Market size and forecast 2024-2029 ($ billion)
- Exhibits142: Data Table on UAE - Market size and forecast 2024-2029 ($ billion)
- Exhibits143: Chart on UAE - Year-over-year growth 2024-2029 (%)
- Exhibits144: Data Table on UAE - Year-over-year growth 2024-2029 (%)
- Exhibits145: Market opportunity By Geographical Landscape ($ billion)
- Exhibits146: Data Tables on Market opportunity By Geographical Landscape ($ billion)
- Exhibits147: Impact of drivers and challenges in 2024 and 2029
- Exhibits148: Overview on criticality of inputs and factors of differentiation
- Exhibits149: Overview on factors of disruption
- Exhibits150: Impact of key risks on business
- Exhibits151: Companies covered
- Exhibits152: Company ranking index
- Exhibits153: Matrix on companies position and classification
- Exhibits154: ABB Ltd - Overview
- Exhibits155: ABB Ltd - Business segments
- Exhibits156: ABB Ltd - Key news
- Exhibits157: ABB Ltd - Key offerings
- Exhibits158: ABB Ltd - Segment focus
- Exhibits159: SWOT
- Exhibits160: Advantech Co. Ltd. - Overview
- Exhibits161: Advantech Co. Ltd. - Business segments
- Exhibits162: Advantech Co. Ltd. - Key news
- Exhibits163: Advantech Co. Ltd. - Key offerings
- Exhibits164: Advantech Co. Ltd. - Segment focus
- Exhibits165: SWOT
- Exhibits166: BuildingLogiX - Overview
- Exhibits167: BuildingLogiX - Product / Service
- Exhibits168: BuildingLogiX - Key offerings
- Exhibits169: SWOT
- Exhibits170: Cisco Systems Inc. - Overview
- Exhibits171: Cisco Systems Inc. - Business segments
- Exhibits172: Cisco Systems Inc. - Key news
- Exhibits173: Cisco Systems Inc. - Key offerings
- Exhibits174: Cisco Systems Inc. - Segment focus
- Exhibits175: SWOT
- Exhibits176: Delta Electronics Inc. - Overview
- Exhibits177: Delta Electronics Inc. - Business segments
- Exhibits178: Delta Electronics Inc. - Key news
- Exhibits179: Delta Electronics Inc. - Key offerings
- Exhibits180: Delta Electronics Inc. - Segment focus
- Exhibits181: SWOT
- Exhibits182: Emerson Electric Co. - Overview
- Exhibits183: Emerson Electric Co. - Business segments
- Exhibits184: Emerson Electric Co. - Key news
- Exhibits185: Emerson Electric Co. - Key offerings
- Exhibits186: Emerson Electric Co. - Segment focus
- Exhibits187: SWOT
- Exhibits188: Honeywell International Inc. - Overview
- Exhibits189: Honeywell International Inc. - Business segments
- Exhibits190: Honeywell International Inc. - Key news
- Exhibits191: Honeywell International Inc. - Key offerings
- Exhibits192: Honeywell International Inc. - Segment focus
- Exhibits193: SWOT
- Exhibits194: International Business Machines Corp. - Overview
- Exhibits195: International Business Machines Corp. - Business segments
- Exhibits196: International Business Machines Corp. - Key news
- Exhibits197: International Business Machines Corp. - Key offerings
- Exhibits198: International Business Machines Corp. - Segment focus
- Exhibits199: SWOT
- Exhibits200: Johnson Controls - Overview
- Exhibits201: Johnson Controls - Business segments
- Exhibits202: Johnson Controls - Key news
- Exhibits203: Johnson Controls - Key offerings
- Exhibits204: Johnson Controls - Segment focus
- Exhibits205: SWOT
- Exhibits206: L and T Technology Services Ltd. - Overview
- Exhibits207: L and T Technology Services Ltd. - Business segments
- Exhibits208: L and T Technology Services Ltd. - Key offerings
- Exhibits209: L and T Technology Services Ltd. - Segment focus
- Exhibits210: SWOT
- Exhibits211: Robert Bosch GmbH - Overview
- Exhibits212: Robert Bosch GmbH - Product / Service
- Exhibits213: Robert Bosch GmbH - Key news
- Exhibits214: Robert Bosch GmbH - Key offerings
- Exhibits215: SWOT
- Exhibits216: Schneider Electric SE - Overview
- Exhibits217: Schneider Electric SE - Business segments
- Exhibits218: Schneider Electric SE - Key news
- Exhibits219: Schneider Electric SE - Key offerings
- Exhibits220: Schneider Electric SE - Segment focus
- Exhibits221: SWOT
- Exhibits222: Siemens AG - Overview
- Exhibits223: Siemens AG - Business segments
- Exhibits224: Siemens AG - Key news
- Exhibits225: Siemens AG - Key offerings
- Exhibits226: Siemens AG - Segment focus
- Exhibits227: SWOT
- Exhibits228: Snap One LLC - Overview
- Exhibits229: Snap One LLC - Product / Service
- Exhibits230: Snap One LLC - Key offerings
- Exhibits231: SWOT
- Exhibits232: Softdel System Pte. Ltd. - Overview
- Exhibits233: Softdel System Pte. Ltd. - Product / Service
- Exhibits234: Softdel System Pte. Ltd. - Key offerings
- Exhibits235: SWOT
- Exhibits236: Inclusions checklist
- Exhibits237: Exclusions checklist
- Exhibits238: Currency conversion rates for US$
- Exhibits239: Research methodology
- Exhibits240: Information sources
- Exhibits241: Data validation
- Exhibits242: Validation techniques employed for market sizing
- Exhibits243: Data synthesis
- Exhibits244: 360 degree market analysis
- Exhibits245: List of abbreviations
The smart buildings market is forecasted to grow by USD 76.8 bn during 2024-2029, accelerating at a CAGR of 11.3% during the forecast period. The report on the smart buildings market provides a holistic analysis, market size and forecast, trends, growth drivers, and challenges, as well as vendor analysis covering around 25 vendors.
The report offers an up-to-date analysis regarding the current market scenario, the latest trends and drivers, and the overall market environment. The market is driven by growing need for building automation to enhance business outcomes, need for enhanced safety and security systems, and increasing need to conserve energy.
| Market Scope | |
|---|---|
| Base Year | 2025 |
| End Year | 2029 |
| Series Year | 2025-2029 |
| Growth Momentum | Accelerate |
| YOY 2025 | 9.9% |
| CAGR | 11.3% |
| Incremental Value | $76.8 bn |
Technavio's smart buildings market is segmented as below:
By Product
- BMS
- HVAC
- Lighting control
- Security and access control
- Others
By Component
- Software
- Hardware
- Services
By Geographical Landscape
- North America
- Europe
- APAC
- South America
- Middle East and Africa
This study identifies the increasing integration of iot with building automation software as one of the prime reasons driving the smart buildings market growth during the next few years. Also, growing concept of biot and rising focus on government initiatives for smart cities will lead to sizable demand in the market.
The report on the smart buildings market covers the following areas:
- Smart Buildings Market sizing
- Smart Buildings Market forecast
- Smart Buildings Market industry analysis
The robust vendor analysis is designed to help clients improve their market position, and in line with this, this report provides a detailed analysis of several leading smart buildings market vendors that include ABB Ltd, Advantech Co. Ltd., BuildingLogiX, Cisco Systems Inc., Delta Electronics Inc., Emerson Electric Co., Honeywell International Inc., International Business Machines Corp., Johnson Controls, L and T Technology Services Ltd., Legrand SA, Panasonic Holdings Corp., Robert Bosch GmbH, RTX Corp., Schneider Electric SE, Siemens AG, Smarteh d.o.o., Snap One LLC, Softdel System Pte. Ltd., and Switch Automation. Also, the smart buildings market analysis report includes information on upcoming trends and challenges that will influence market growth. This is to help companies strategize and leverage all forthcoming growth opportunities.
The study was conducted using an objective combination of primary and secondary information including inputs from key participants in the industry. The report contains a comprehensive market and vendor landscape in addition to an analysis of the key vendors.
The publisher presents a detailed picture of the market by the way of study, synthesis, and summation of data from multiple sources by an analysis of key parameters such as profit, pricing, competition, and promotions. It presents various market facets by identifying the key industry influencers. The data presented is comprehensive, reliable, and a result of extensive primary and secondary research. The market research reports provide a complete competitive landscape and an in-depth vendor selection methodology and analysis using qualitative and quantitative research to forecast accurate market growth.
Table of Contents
1 Executive Summary
- 1.1 Market overview
- Executive Summary - Chart on Market Overview
- Executive Summary - Data Table on Market Overview
- Executive Summary - Chart on Global Market Characteristics
- Executive Summary - Chart on Market By Geographical Landscape
- Executive Summary - Chart on Market Segmentation by Product
- Executive Summary - Chart on Market Segmentation by Component
- Executive Summary - Chart on Incremental Growth
- Executive Summary - Data Table on Incremental Growth
- Executive Summary - Chart on Company Market Positioning
2 Technavio Analysis
- 2.1 Analysis of price sensitivity, lifecycle, customer purchase basket, adoption rates, and purchase criteria
- Analysis of price sensitivity, lifecycle, customer purchase basket, adoption rates, and purchase criteria
- 2.2 Criticality of inputs and Factors of differentiation
- Overview on criticality of inputs and factors of differentiation
- 2.3 Factors of disruption
- Overview on factors of disruption
- 2.4 Impact of drivers and challenges
- Impact of drivers and challenges in 2024 and 2029
3 Market Landscape
- 3.1 Market ecosystem
- Parent Market
- Data Table on - Parent Market
- 3.2 Market characteristics
- Market characteristics analysis
- 3.3 Value chain analysis
- Value chain analysis
4 Market Sizing
- 4.1 Market definition
- Offerings of companies included in the market definition
- 4.2 Market segment analysis
- Market segments
- 4.3 Market size 2024
- 4.4 Market outlook: Forecast for 2024-2029
- Chart on Global - Market size and forecast 2024-2029 ($ billion)
- Data Table on Global - Market size and forecast 2024-2029 ($ billion)
- Chart on Global Market: Year-over-year growth 2024-2029 (%)
- Data Table on Global Market: Year-over-year growth 2024-2029 (%)
5 Historic Market Size
- 5.1 Global Smart Buildings Market 2019 - 2023
- Historic Market Size - Data Table on Global Smart Buildings Market 2019 - 2023 ($ billion)
- 5.2 Product segment analysis 2019 - 2023
- Historic Market Size - Product Segment 2019 - 2023 ($ billion)
- 5.3 Component segment analysis 2019 - 2023
- Historic Market Size - Component Segment 2019 - 2023 ($ billion)
- 5.4 Geography segment analysis 2019 - 2023
- Historic Market Size - Geography Segment 2019 - 2023 ($ billion)
- 5.5 Country segment analysis 2019 - 2023
- Historic Market Size - Country Segment 2019 - 2023 ($ billion)
6 Qualitative Analysis
- 6.1 The AI impact on Global Smart Buildings Market
7 Five Forces Analysis
- 7.1 Five forces summary
- Five forces analysis - Comparison between 2024 and 2029
- 7.2 Bargaining power of buyers
- Bargaining power of buyers - Impact of key factors 2024 and 2029
- 7.3 Bargaining power of suppliers
- Bargaining power of suppliers - Impact of key factors in 2024 and 2029
- 7.4 Threat of new entrants
- Threat of new entrants - Impact of key factors in 2024 and 2029
- 7.5 Threat of substitutes
- Threat of substitutes - Impact of key factors in 2024 and 2029
- 7.6 Threat of rivalry
- Threat of rivalry - Impact of key factors in 2024 and 2029
- 7.7 Market condition
- Chart on Market condition - Five forces 2024 and 2029
8 Market Segmentation by Product
- 8.1 Market segments
- Chart on Product - Market share 2024-2029 (%)
- Data Table on Product - Market share 2024-2029 (%)
- 8.2 Comparison by Product
- Chart on Comparison by Product
- Data Table on Comparison by Product
- 8.3 BMS - Market size and forecast 2024-2029
- Chart on BMS - Market size and forecast 2024-2029 ($ billion)
- Data Table on BMS - Market size and forecast 2024-2029 ($ billion)
- Chart on BMS - Year-over-year growth 2024-2029 (%)
- Data Table on BMS - Year-over-year growth 2024-2029 (%)
- 8.4 HVAC - Market size and forecast 2024-2029
- Chart on HVAC - Market size and forecast 2024-2029 ($ billion)
- Data Table on HVAC - Market size and forecast 2024-2029 ($ billion)
- Chart on HVAC - Year-over-year growth 2024-2029 (%)
- Data Table on HVAC - Year-over-year growth 2024-2029 (%)
- 8.5 Lighting control - Market size and forecast 2024-2029
- Chart on Lighting control - Market size and forecast 2024-2029 ($ billion)
- Data Table on Lighting control - Market size and forecast 2024-2029 ($ billion)
- Chart on Lighting control - Year-over-year growth 2024-2029 (%)
- Data Table on Lighting control - Year-over-year growth 2024-2029 (%)
- 8.6 Security and access control - Market size and forecast 2024-2029
- Chart on Security and access control - Market size and forecast 2024-2029 ($ billion)
- Data Table on Security and access control - Market size and forecast 2024-2029 ($ billion)
- Chart on Security and access control - Year-over-year growth 2024-2029 (%)
- Data Table on Security and access control - Year-over-year growth 2024-2029 (%)
- 8.7 Others - Market size and forecast 2024-2029
- Chart on Others - Market size and forecast 2024-2029 ($ billion)
- Data Table on Others - Market size and forecast 2024-2029 ($ billion)
- Chart on Others - Year-over-year growth 2024-2029 (%)
- Data Table on Others - Year-over-year growth 2024-2029 (%)
- 8.8 Market opportunity by Product
- Market opportunity by Product ($ billion)
- Data Table on Market opportunity by Product ($ billion)
9 Market Segmentation by Component
- 9.1 Market segments
- Chart on Component - Market share 2024-2029 (%)
- Data Table on Component - Market share 2024-2029 (%)
- 9.2 Comparison by Component
- Chart on Comparison by Component
- Data Table on Comparison by Component
- 9.3 Software - Market size and forecast 2024-2029
- Chart on Software - Market size and forecast 2024-2029 ($ billion)
- Data Table on Software - Market size and forecast 2024-2029 ($ billion)
- Chart on Software - Year-over-year growth 2024-2029 (%)
- Data Table on Software - Year-over-year growth 2024-2029 (%)
- 9.4 Hardware - Market size and forecast 2024-2029
- Chart on Hardware - Market size and forecast 2024-2029 ($ billion)
- Data Table on Hardware - Market size and forecast 2024-2029 ($ billion)
- Chart on Hardware - Year-over-year growth 2024-2029 (%)
- Data Table on Hardware - Year-over-year growth 2024-2029 (%)
- 9.5 Services - Market size and forecast 2024-2029
- Chart on Services - Market size and forecast 2024-2029 ($ billion)
- Data Table on Services - Market size and forecast 2024-2029 ($ billion)
- Chart on Services - Year-over-year growth 2024-2029 (%)
- Data Table on Services - Year-over-year growth 2024-2029 (%)
- 9.6 Market opportunity by Component
- Market opportunity by Component ($ billion)
- Data Table on Market opportunity by Component ($ billion)
10 Customer Landscape
- 10.1 Customer landscape overview
- Analysis of price sensitivity, lifecycle, customer purchase basket, adoption rates, and purchase criteria
11 Geographic Landscape
- 11.1 Geographic segmentation
- Chart on Market share By Geographical Landscape 2024-2029 (%)
- Data Table on Market share By Geographical Landscape 2024-2029 (%)
- 11.2 Geographic comparison
- Chart on Geographic comparison
- Data Table on Geographic comparison
- 11.3 North America - Market size and forecast 2024-2029
- Chart on North America - Market size and forecast 2024-2029 ($ billion)
- Data Table on North America - Market size and forecast 2024-2029 ($ billion)
- Chart on North America - Year-over-year growth 2024-2029 (%)
- Data Table on North America - Year-over-year growth 2024-2029 (%)
- 11.4 Europe - Market size and forecast 2024-2029
- Chart on Europe - Market size and forecast 2024-2029 ($ billion)
- Data Table on Europe - Market size and forecast 2024-2029 ($ billion)
- Chart on Europe - Year-over-year growth 2024-2029 (%)
- Data Table on Europe - Year-over-year growth 2024-2029 (%)
- 11.5 APAC - Market size and forecast 2024-2029
- Chart on APAC - Market size and forecast 2024-2029 ($ billion)
- Data Table on APAC - Market size and forecast 2024-2029 ($ billion)
- Chart on APAC - Year-over-year growth 2024-2029 (%)
- Data Table on APAC - Year-over-year growth 2024-2029 (%)
- 11.6 South America - Market size and forecast 2024-2029
- Chart on South America - Market size and forecast 2024-2029 ($ billion)
- Data Table on South America - Market size and forecast 2024-2029 ($ billion)
- Chart on South America - Year-over-year growth 2024-2029 (%)
- Data Table on South America - Year-over-year growth 2024-2029 (%)
- 11.7 Middle East and Africa - Market size and forecast 2024-2029
- Chart on Middle East and Africa - Market size and forecast 2024-2029 ($ billion)
- Data Table on Middle East and Africa - Market size and forecast 2024-2029 ($ billion)
- Chart on Middle East and Africa - Year-over-year growth 2024-2029 (%)
- Data Table on Middle East and Africa - Year-over-year growth 2024-2029 (%)
- 11.8 US - Market size and forecast 2024-2029
- Chart on US - Market size and forecast 2024-2029 ($ billion)
- Data Table on US - Market size and forecast 2024-2029 ($ billion)
- Chart on US - Year-over-year growth 2024-2029 (%)
- Data Table on US - Year-over-year growth 2024-2029 (%)
- 11.9 UK - Market size and forecast 2024-2029
- Chart on UK - Market size and forecast 2024-2029 ($ billion)
- Data Table on UK - Market size and forecast 2024-2029 ($ billion)
- Chart on UK - Year-over-year growth 2024-2029 (%)
- Data Table on UK - Year-over-year growth 2024-2029 (%)
- 11.10 Germany - Market size and forecast 2024-2029
- Chart on Germany - Market size and forecast 2024-2029 ($ billion)
- Data Table on Germany - Market size and forecast 2024-2029 ($ billion)
- Chart on Germany - Year-over-year growth 2024-2029 (%)
- Data Table on Germany - Year-over-year growth 2024-2029 (%)
- 11.11 China - Market size and forecast 2024-2029
- Chart on China - Market size and forecast 2024-2029 ($ billion)
- Data Table on China - Market size and forecast 2024-2029 ($ billion)
- Chart on China - Year-over-year growth 2024-2029 (%)
- Data Table on China - Year-over-year growth 2024-2029 (%)
- 11.12 Japan - Market size and forecast 2024-2029
- Chart on Japan - Market size and forecast 2024-2029 ($ billion)
- Data Table on Japan - Market size and forecast 2024-2029 ($ billion)
- Chart on Japan - Year-over-year growth 2024-2029 (%)
- Data Table on Japan - Year-over-year growth 2024-2029 (%)
- 11.13 France - Market size and forecast 2024-2029
- Chart on France - Market size and forecast 2024-2029 ($ billion)
- Data Table on France - Market size and forecast 2024-2029 ($ billion)
- Chart on France - Year-over-year growth 2024-2029 (%)
- Data Table on France - Year-over-year growth 2024-2029 (%)
- 11.14 Canada - Market size and forecast 2024-2029
- Chart on Canada - Market size and forecast 2024-2029 ($ billion)
- Data Table on Canada - Market size and forecast 2024-2029 ($ billion)
- Chart on Canada - Year-over-year growth 2024-2029 (%)
- Data Table on Canada - Year-over-year growth 2024-2029 (%)
- 11.15 India - Market size and forecast 2024-2029
- Chart on India - Market size and forecast 2024-2029 ($ billion)
- Data Table on India - Market size and forecast 2024-2029 ($ billion)
- Chart on India - Year-over-year growth 2024-2029 (%)
- Data Table on India - Year-over-year growth 2024-2029 (%)
- 11.16 Brazil - Market size and forecast 2024-2029
- Chart on Brazil - Market size and forecast 2024-2029 ($ billion)
- Data Table on Brazil - Market size and forecast 2024-2029 ($ billion)
- Chart on Brazil - Year-over-year growth 2024-2029 (%)
- Data Table on Brazil - Year-over-year growth 2024-2029 (%)
- 11.17 UAE - Market size and forecast 2024-2029
- Chart on UAE - Market size and forecast 2024-2029 ($ billion)
- Data Table on UAE - Market size and forecast 2024-2029 ($ billion)
- Chart on UAE - Year-over-year growth 2024-2029 (%)
- Data Table on UAE - Year-over-year growth 2024-2029 (%)
- 11.18 Market opportunity By Geographical Landscape
- Market opportunity By Geographical Landscape ($ billion)
- Data Tables on Market opportunity By Geographical Landscape ($ billion)
12 Drivers, Challenges, and Opportunity/Restraints
- 12.1 Market drivers
- 12.2 Market challenges
- 12.3 Impact of drivers and challenges
- Impact of drivers and challenges in 2024 and 2029
- 12.4 Market opportunities/restraints
13 Competitive Landscape
- 13.1 Overview
- 13.2 Competitive Landscape
- Overview on criticality of inputs and factors of differentiation
- 13.3 Landscape disruption
- Overview on factors of disruption
- 13.4 Industry risks
- Impact of key risks on business
14 Competitive Analysis
- 14.1 Companies profiled
- Companies covered
- 14.2 Company ranking index
- Company ranking index
- 14.3 Market positioning of companies
- Matrix on companies position and classification
- 14.4 ABB Ltd
- ABB Ltd - Overview
- ABB Ltd - Business segments
- ABB Ltd - Key news
- ABB Ltd - Key offerings
- ABB Ltd - Segment focus
- SWOT
- 14.5 Advantech Co. Ltd.
- Advantech Co. Ltd. - Overview
- Advantech Co. Ltd. - Business segments
- Advantech Co. Ltd. - Key news
- Advantech Co. Ltd. - Key offerings
- Advantech Co. Ltd. - Segment focus
- SWOT
- 14.6 BuildingLogiX
- BuildingLogiX - Overview
- BuildingLogiX - Product / Service
- BuildingLogiX - Key offerings
- SWOT
- 14.7 Cisco Systems Inc.
- Cisco Systems Inc. - Overview
- Cisco Systems Inc. - Business segments
- Cisco Systems Inc. - Key news
- Cisco Systems Inc. - Key offerings
- Cisco Systems Inc. - Segment focus
- SWOT
- 14.8 Delta Electronics Inc.
- Delta Electronics Inc. - Overview
- Delta Electronics Inc. - Business segments
- Delta Electronics Inc. - Key news
- Delta Electronics Inc. - Key offerings
- Delta Electronics Inc. - Segment focus
- SWOT
- 14.9 Emerson Electric Co.
- Emerson Electric Co. - Overview
- Emerson Electric Co. - Business segments
- Emerson Electric Co. - Key news
- Emerson Electric Co. - Key offerings
- Emerson Electric Co. - Segment focus
- SWOT
- 14.10 Honeywell International Inc.
- Honeywell International Inc. - Overview
- Honeywell International Inc. - Business segments
- Honeywell International Inc. - Key news
- Honeywell International Inc. - Key offerings
- Honeywell International Inc. - Segment focus
- SWOT
- 14.11 International Business Machines Corp.
- International Business Machines Corp. - Overview
- International Business Machines Corp. - Business segments
- International Business Machines Corp. - Key news
- International Business Machines Corp. - Key offerings
- International Business Machines Corp. - Segment focus
- SWOT
- 14.12 Johnson Controls
- Johnson Controls - Overview
- Johnson Controls - Business segments
- Johnson Controls - Key news
- Johnson Controls - Key offerings
- Johnson Controls - Segment focus
- SWOT
- 14.13 L and T Technology Services Ltd.
- L and T Technology Services Ltd. - Overview
- L and T Technology Services Ltd. - Business segments
- L and T Technology Services Ltd. - Key offerings
- L and T Technology Services Ltd. - Segment focus
- SWOT
- 14.14 Robert Bosch GmbH
- Robert Bosch GmbH - Overview
- Robert Bosch GmbH - Product / Service
- Robert Bosch GmbH - Key news
- Robert Bosch GmbH - Key offerings
- SWOT
- 14.15 Schneider Electric SE
- Schneider Electric SE - Overview
- Schneider Electric SE - Business segments
- Schneider Electric SE - Key news
- Schneider Electric SE - Key offerings
- Schneider Electric SE - Segment focus
- SWOT
- 14.16 Siemens AG
- Siemens AG - Overview
- Siemens AG - Business segments
- Siemens AG - Key news
- Siemens AG - Key offerings
- Siemens AG - Segment focus
- SWOT
- 14.17 Snap One LLC
- Snap One LLC - Overview
- Snap One LLC - Product / Service
- Snap One LLC - Key offerings
- SWOT
- 14.18 Softdel System Pte. Ltd.
- Softdel System Pte. Ltd. - Overview
- Softdel System Pte. Ltd. - Product / Service
- Softdel System Pte. Ltd. - Key offerings
- SWOT
15 Appendix
- 15.1 Scope of the report
- 15.2 Inclusions and exclusions checklist
- Inclusions checklist
- Exclusions checklist
- 15.3 Currency conversion rates for US$
- Currency conversion rates for US$
- 15.4 Research methodology
- Research methodology
- 15.5 Data procurement
- Information sources
- 15.6 Data validation
- Data validation
- 15.7 Validation techniques employed for market sizing
- Validation techniques employed for market sizing
- 15.8 Data synthesis
- Data synthesis
- 15.9 360 degree market analysis
- 360 degree market analysis
- 15.10 List of abbreviations
- List of abbreviations

