|
|
市場調査レポート
商品コード
1558444
熱交換器の世界市場、2024~2028年Global Heat Exchanger Market 2024-2028 |
||||||

|
|||||||
カスタマイズ可能
|
|||||||


| 熱交換器の世界市場、2024~2028年 |
|
出版日: 2024年08月14日
発行: TechNavio
ページ情報: 英文 186 Pages
納期: 即納可能
|

全表示
- 概要
- 図表
- 目次
熱交換器市場は2023~2028年に44億8,080万米ドル、予測期間中のCAGRは4.4%で成長すると予測されます。
当レポートでは、熱交換器市場の全体的な分析、市場規模・予測、動向、成長促進要因、課題、約25のベンダーを網羅したベンダー分析などを掲載しています。
現在の市場シナリオ、最新動向と促進要因、市場環境全体に関する最新分析を提供しています。市場を牽引するのは、上下水道業界からの需要増加、アジア太平洋諸国からの熱交換器需要の増加、自動車向けの軽量コンパクトな熱交換器需要の増加などがあります。
| 市場範囲 | |
|---|---|
| 基準年 | 2024年 |
| 終了年 | 2028年 |
| 予測期間 | 2024~2028年 |
| 成長モメンタム | 加速 |
| 前年比[2024年] | 4.14% |
| CAGR | 4.4% |
| 増分額 | 44億8,080万米ドル |
本調査では、熱交換器の設計における技術的進歩が、今後数年間の熱交換器市場の成長を牽引する主要な理由のひとつであるとしています。また、自動車用のろう付け銅製熱交換器の人気の高まりや、原子力セグメントの成長は、市場の大きな需要につながると考えられます。
目次
第1章 エグゼクティブサマリー
- 市場概要
第2章 市場情勢
- 市場エコシステム
- 市場の特徴
- バリューチェーン分析
第3章 市場規模の評価
- 市場の定義
- 市場セグメント分析
- 市場規模 2023年
- 市場の展望 2023~2028年
第4章 市場規模実績
- 熱交換器の世界市場 2018~2022年
- エンドユーザー別セグメント分析 2018~2022年
- 製品別セグメント分析 2018~2022年
- 地域別セグメント分析 2018~2022年
- 国別セグメント分析 2018~2022年
第5章 ファイブフォース分析
- ファイブフォースの要約
- 買い手の交渉力
- 供給企業の交渉力
- 新規参入業者の脅威
- 代替品の脅威
- 競争の脅威
- 市況
第6章 市場セグメンテーション:エンドユーザー別
- 市場セグメンテーション
- 比較:エンドユーザー別
- 化学薬品:市場規模と予測 2023~2028年
- 燃料処理:市場規模と予測 2023~2028年
- 空調設備:市場規模と予測 2023~2028年
- その他:市場規模と予測 2023~2028年
- 市場機会:エンドユーザー別
第7章 市場セグメンテーション:製品別
- 市場セグメンテーション
- 比較:製品別
- シェルアンドチューブ:市場規模と予測 2023~2028年
- プレートとフレーム:市場規模と予測 2023~2028年
- 冷却塔:市場規模と予測 2023~2028年
- 空冷式:市場規模と予測 2023~2028年
- その他:市場規模と予測 2023~2028年
- 市場機会:製品別
第8章 顧客情勢
- 顧客情勢概要
第9章 地域別情勢
- 地域別セグメンテーション
- 比較:地域別
- 欧州:市場規模と予測 2023~2028年
- アジア太平洋:市場規模と予測 2023~2028年
- 北米:市場規模と予測 2023~2028年
- 南米:市場規模と予測 2023~2028年
- 中東・アフリカ:市場規模と予測 2023~2028年
- 米国:市場規模と予測 2023~2028年
- 中国:市場規模と予測 2023~2028年
- ドイツ:市場規模と予測 2023~2028年
- 英国:市場規模と予測 2023~2028年
- カナダ:市場規模と予測 2023~2028年
- 市場機会:地域情勢別
第10章 促進要因・課題・機会・抑制要因
- 市場促進要因
- 市場課題
- 促進要因と課題の影響
- 市場の機会・抑制要因
第11章 競合情勢
- 概要
- 競合情勢
- 混乱の状況
- 業界のリスク
第12章 競合分析
- 企業プロファイル
- 企業の市場ポジショニング
- Alfa Laval AB
- API Heat Transfer Inc.
- Boyd Corp.
- Chart Industries Inc.
- Danfoss AS
- Doosan Corp.
- Dover Corp.
- Exchanger Industries Ltd.
- General Electric Co.
- Hisaka Works Ltd.
- Johnson Controls International Plc.
- Kelvion Holding GmbH
- Koch Industries Inc.
- SPX FLOW Inc.
- Thermal Edge Inc.
第13章 付録
Exhibits:
- Exhibits1: Executive Summary - Chart on Market Overview
- Exhibits2: Executive Summary - Data Table on Market Overview
- Exhibits3: Executive Summary - Chart on Global Market Characteristics
- Exhibits4: Executive Summary - Chart on Market By Geographical Landscape
- Exhibits5: Executive Summary - Chart on Market Segmentation by End-user
- Exhibits6: Executive Summary - Chart on Market Segmentation by Product
- Exhibits7: Executive Summary - Chart on Incremental Growth
- Exhibits8: Executive Summary - Data Table on Incremental Growth
- Exhibits9: Executive Summary - Chart on Company Market Positioning
- Exhibits10: Parent Market
- Exhibits11: Data Table on - Parent Market
- Exhibits12: Market characteristics analysis
- Exhibits13: Value Chain Analysis
- Exhibits14: Offerings of companies included in the market definition
- Exhibits15: Market segments
- Exhibits16: Chart on Global - Market size and forecast 2023-2028 ($ million)
- Exhibits17: Data Table on Global - Market size and forecast 2023-2028 ($ million)
- Exhibits18: Chart on Global Market: Year-over-year growth 2023-2028 (%)
- Exhibits19: Data Table on Global Market: Year-over-year growth 2023-2028 (%)
- Exhibits20: Historic Market Size - Data Table on Global Heat Exchanger Market 2018 - 2022 ($ million)
- Exhibits21: Historic Market Size - End-user Segment 2018 - 2022 ($ million)
- Exhibits22: Historic Market Size - Product Segment 2018 - 2022 ($ million)
- Exhibits23: Historic Market Size - Geography Segment 2018 - 2022 ($ million)
- Exhibits24: Historic Market Size - Country Segment 2018 - 2022 ($ million)
- Exhibits25: Five forces analysis - Comparison between 2023 and 2028
- Exhibits26: Bargaining power of buyers - Impact of key factors 2023 and 2028
- Exhibits27: Bargaining power of suppliers - Impact of key factors in 2023 and 2028
- Exhibits28: Threat of new entrants - Impact of key factors in 2023 and 2028
- Exhibits29: Threat of substitutes - Impact of key factors in 2023 and 2028
- Exhibits30: Threat of rivalry - Impact of key factors in 2023 and 2028
- Exhibits31: Chart on Market condition - Five forces 2023 and 2028
- Exhibits32: Chart on End-user - Market share 2023-2028 (%)
- Exhibits33: Data Table on End-user - Market share 2023-2028 (%)
- Exhibits34: Chart on Comparison by End-user
- Exhibits35: Data Table on Comparison by End-user
- Exhibits36: Chart on Chemical - Market size and forecast 2023-2028 ($ million)
- Exhibits37: Data Table on Chemical - Market size and forecast 2023-2028 ($ million)
- Exhibits38: Chart on Chemical - Year-over-year growth 2023-2028 (%)
- Exhibits39: Data Table on Chemical - Year-over-year growth 2023-2028 (%)
- Exhibits40: Chart on Fuel processing - Market size and forecast 2023-2028 ($ million)
- Exhibits41: Data Table on Fuel processing - Market size and forecast 2023-2028 ($ million)
- Exhibits42: Chart on Fuel processing - Year-over-year growth 2023-2028 (%)
- Exhibits43: Data Table on Fuel processing - Year-over-year growth 2023-2028 (%)
- Exhibits44: Chart on HVAC - Market size and forecast 2023-2028 ($ million)
- Exhibits45: Data Table on HVAC - Market size and forecast 2023-2028 ($ million)
- Exhibits46: Chart on HVAC - Year-over-year growth 2023-2028 (%)
- Exhibits47: Data Table on HVAC - Year-over-year growth 2023-2028 (%)
- Exhibits48: Chart on Others - Market size and forecast 2023-2028 ($ million)
- Exhibits49: Data Table on Others - Market size and forecast 2023-2028 ($ million)
- Exhibits50: Chart on Others - Year-over-year growth 2023-2028 (%)
- Exhibits51: Data Table on Others - Year-over-year growth 2023-2028 (%)
- Exhibits52: Market opportunity by End-user ($ million)
- Exhibits53: Data Table on Market opportunity by End-user ($ million)
- Exhibits54: Chart on Product - Market share 2023-2028 (%)
- Exhibits55: Data Table on Product - Market share 2023-2028 (%)
- Exhibits56: Chart on Comparison by Product
- Exhibits57: Data Table on Comparison by Product
- Exhibits58: Chart on Shell and tube - Market size and forecast 2023-2028 ($ million)
- Exhibits59: Data Table on Shell and tube - Market size and forecast 2023-2028 ($ million)
- Exhibits60: Chart on Shell and tube - Year-over-year growth 2023-2028 (%)
- Exhibits61: Data Table on Shell and tube - Year-over-year growth 2023-2028 (%)
- Exhibits62: Chart on Plate and frame - Market size and forecast 2023-2028 ($ million)
- Exhibits63: Data Table on Plate and frame - Market size and forecast 2023-2028 ($ million)
- Exhibits64: Chart on Plate and frame - Year-over-year growth 2023-2028 (%)
- Exhibits65: Data Table on Plate and frame - Year-over-year growth 2023-2028 (%)
- Exhibits66: Chart on Cooling tower - Market size and forecast 2023-2028 ($ million)
- Exhibits67: Data Table on Cooling tower - Market size and forecast 2023-2028 ($ million)
- Exhibits68: Chart on Cooling tower - Year-over-year growth 2023-2028 (%)
- Exhibits69: Data Table on Cooling tower - Year-over-year growth 2023-2028 (%)
- Exhibits70: Chart on Air cooled - Market size and forecast 2023-2028 ($ million)
- Exhibits71: Data Table on Air cooled - Market size and forecast 2023-2028 ($ million)
- Exhibits72: Chart on Air cooled - Year-over-year growth 2023-2028 (%)
- Exhibits73: Data Table on Air cooled - Year-over-year growth 2023-2028 (%)
- Exhibits74: Chart on Others - Market size and forecast 2023-2028 ($ million)
- Exhibits75: Data Table on Others - Market size and forecast 2023-2028 ($ million)
- Exhibits76: Chart on Others - Year-over-year growth 2023-2028 (%)
- Exhibits77: Data Table on Others - Year-over-year growth 2023-2028 (%)
- Exhibits78: Market opportunity by Product ($ million)
- Exhibits79: Data Table on Market opportunity by Product ($ million)
- Exhibits80: Analysis of price sensitivity, lifecycle, customer purchase basket, adoption rates, and purchase criteria
- Exhibits81: Chart on Market share By Geographical Landscape 2023-2028 (%)
- Exhibits82: Data Table on Market share By Geographical Landscape 2023-2028 (%)
- Exhibits83: Chart on Geographic comparison
- Exhibits84: Data Table on Geographic comparison
- Exhibits85: Chart on Europe - Market size and forecast 2023-2028 ($ million)
- Exhibits86: Data Table on Europe - Market size and forecast 2023-2028 ($ million)
- Exhibits87: Chart on Europe - Year-over-year growth 2023-2028 (%)
- Exhibits88: Data Table on Europe - Year-over-year growth 2023-2028 (%)
- Exhibits89: Chart on APAC - Market size and forecast 2023-2028 ($ million)
- Exhibits90: Data Table on APAC - Market size and forecast 2023-2028 ($ million)
- Exhibits91: Chart on APAC - Year-over-year growth 2023-2028 (%)
- Exhibits92: Data Table on APAC - Year-over-year growth 2023-2028 (%)
- Exhibits93: Chart on North America - Market size and forecast 2023-2028 ($ million)
- Exhibits94: Data Table on North America - Market size and forecast 2023-2028 ($ million)
- Exhibits95: Chart on North America - Year-over-year growth 2023-2028 (%)
- Exhibits96: Data Table on North America - Year-over-year growth 2023-2028 (%)
- Exhibits97: Chart on South America - Market size and forecast 2023-2028 ($ million)
- Exhibits98: Data Table on South America - Market size and forecast 2023-2028 ($ million)
- Exhibits99: Chart on South America - Year-over-year growth 2023-2028 (%)
- Exhibits100: Data Table on South America - Year-over-year growth 2023-2028 (%)
- Exhibits101: Chart on Middle East and Africa - Market size and forecast 2023-2028 ($ million)
- Exhibits102: Data Table on Middle East and Africa - Market size and forecast 2023-2028 ($ million)
- Exhibits103: Chart on Middle East and Africa - Year-over-year growth 2023-2028 (%)
- Exhibits104: Data Table on Middle East and Africa - Year-over-year growth 2023-2028 (%)
- Exhibits105: Chart on US - Market size and forecast 2023-2028 ($ million)
- Exhibits106: Data Table on US - Market size and forecast 2023-2028 ($ million)
- Exhibits107: Chart on US - Year-over-year growth 2023-2028 (%)
- Exhibits108: Data Table on US - Year-over-year growth 2023-2028 (%)
- Exhibits109: Chart on China - Market size and forecast 2023-2028 ($ million)
- Exhibits110: Data Table on China - Market size and forecast 2023-2028 ($ million)
- Exhibits111: Chart on China - Year-over-year growth 2023-2028 (%)
- Exhibits112: Data Table on China - Year-over-year growth 2023-2028 (%)
- Exhibits113: Chart on Germany - Market size and forecast 2023-2028 ($ million)
- Exhibits114: Data Table on Germany - Market size and forecast 2023-2028 ($ million)
- Exhibits115: Chart on Germany - Year-over-year growth 2023-2028 (%)
- Exhibits116: Data Table on Germany - Year-over-year growth 2023-2028 (%)
- Exhibits117: Chart on UK - Market size and forecast 2023-2028 ($ million)
- Exhibits118: Data Table on UK - Market size and forecast 2023-2028 ($ million)
- Exhibits119: Chart on UK - Year-over-year growth 2023-2028 (%)
- Exhibits120: Data Table on UK - Year-over-year growth 2023-2028 (%)
- Exhibits121: Chart on Canada - Market size and forecast 2023-2028 ($ million)
- Exhibits122: Data Table on Canada - Market size and forecast 2023-2028 ($ million)
- Exhibits123: Chart on Canada - Year-over-year growth 2023-2028 (%)
- Exhibits124: Data Table on Canada - Year-over-year growth 2023-2028 (%)
- Exhibits125: Market opportunity By Geographical Landscape ($ million)
- Exhibits126: Data Tables on Market opportunity By Geographical Landscape ($ million)
- Exhibits127: Impact of drivers and challenges in 2023 and 2028
- Exhibits128: Overview on criticality of inputs and factors of differentiation
- Exhibits129: Overview on factors of disruption
- Exhibits130: Impact of key risks on business
- Exhibits131: Companies covered
- Exhibits132: Matrix on companies position and classification
- Exhibits133: Alfa Laval AB - Overview
- Exhibits134: Alfa Laval AB - Business segments
- Exhibits135: Alfa Laval AB - Key news
- Exhibits136: Alfa Laval AB - Key offerings
- Exhibits137: Alfa Laval AB - Segment focus
- Exhibits138: API Heat Transfer Inc. - Overview
- Exhibits139: API Heat Transfer Inc. - Product / Service
- Exhibits140: API Heat Transfer Inc. - Key offerings
- Exhibits141: Boyd Corp. - Overview
- Exhibits142: Boyd Corp. - Product / Service
- Exhibits143: Boyd Corp. - Key offerings
- Exhibits144: Chart Industries Inc. - Overview
- Exhibits145: Chart Industries Inc. - Business segments
- Exhibits146: Chart Industries Inc. - Key news
- Exhibits147: Chart Industries Inc. - Key offerings
- Exhibits148: Chart Industries Inc. - Segment focus
- Exhibits149: Danfoss AS - Overview
- Exhibits150: Danfoss AS - Product / Service
- Exhibits151: Danfoss AS - Key offerings
- Exhibits152: Doosan Corp. - Overview
- Exhibits153: Doosan Corp. - Business segments
- Exhibits154: Doosan Corp. - Key news
- Exhibits155: Doosan Corp. - Key offerings
- Exhibits156: Doosan Corp. - Segment focus
- Exhibits157: Dover Corp. - Overview
- Exhibits158: Dover Corp. - Business segments
- Exhibits159: Dover Corp. - Key news
- Exhibits160: Dover Corp. - Key offerings
- Exhibits161: Dover Corp. - Segment focus
- Exhibits162: Exchanger Industries Ltd. - Overview
- Exhibits163: Exchanger Industries Ltd. - Product / Service
- Exhibits164: Exchanger Industries Ltd. - Key offerings
- Exhibits165: General Electric Co. - Overview
- Exhibits166: General Electric Co. - Business segments
- Exhibits167: General Electric Co. - Key news
- Exhibits168: General Electric Co. - Key offerings
- Exhibits169: General Electric Co. - Segment focus
- Exhibits170: Hisaka Works Ltd. - Overview
- Exhibits171: Hisaka Works Ltd. - Product / Service
- Exhibits172: Hisaka Works Ltd. - Key offerings
- Exhibits173: Johnson Controls International Plc. - Overview
- Exhibits174: Johnson Controls International Plc. - Business segments
- Exhibits175: Johnson Controls International Plc. - Key news
- Exhibits176: Johnson Controls International Plc. - Key offerings
- Exhibits177: Johnson Controls International Plc. - Segment focus
- Exhibits178: Kelvion Holding GmbH - Overview
- Exhibits179: Kelvion Holding GmbH - Product / Service
- Exhibits180: Kelvion Holding GmbH - Key offerings
- Exhibits181: Koch Industries Inc. - Overview
- Exhibits182: Koch Industries Inc. - Product / Service
- Exhibits183: Koch Industries Inc. - Key offerings
- Exhibits184: SPX FLOW Inc. - Overview
- Exhibits185: SPX FLOW Inc. - Product / Service
- Exhibits186: SPX FLOW Inc. - Key news
- Exhibits187: SPX FLOW Inc. - Key offerings
- Exhibits188: Thermal Edge Inc. - Overview
- Exhibits189: Thermal Edge Inc. - Product / Service
- Exhibits190: Thermal Edge Inc. - Key offerings
- Exhibits191: Inclusions checklist
- Exhibits192: Exclusions checklist
- Exhibits193: Currency conversion rates for US$
- Exhibits194: Research methodology
- Exhibits195: Information sources
- Exhibits196: Data validation
- Exhibits197: Validation techniques employed for market sizing
- Exhibits198: Data synthesis
- Exhibits199: 360 degree market analysis
- Exhibits200: List of abbreviations
The heat exchanger market is forecasted to grow by USD 4480.8 mn during 2023-2028, accelerating at a CAGR of 4.4% during the forecast period. The report on the heat exchanger market provides a holistic analysis, market size and forecast, trends, growth drivers, and challenges, as well as vendor analysis covering around 25 vendors.
The report offers an up-to-date analysis regarding the current market scenario, the latest trends and drivers, and the overall market environment. The market is driven by rising demand from the water and wastewater industry, growing demand for heat exchanger from apac-based countries, and increase in demand for lightweight and compact heat exchanger for automobiles.
Technavio's heat exchanger market is segmented as below:
| Market Scope | |
|---|---|
| Base Year | 2024 |
| End Year | 2028 |
| Series Year | 2024-2028 |
| Growth Momentum | Accelerate |
| YOY 2024 | 4.14% |
| CAGR | 4.4% |
| Incremental Value | $4480.8 mn |
By End-user
- Chemical
- Fuel processing
- HVAC
- Others
By Product
- Shell and tube
- Plate and frame
- Cooling tower
- Air cooled
- Others
By Geographical Landscape
- Europe
- APAC
- North America
- South America
- Middle East and Africa
This study identifies the technological advances in the design of heat exchangers as one of the prime reasons driving the heat exchanger market growth during the next few years. Also, increase in the popularity of brazed copper heat exchanger for automotive vehicles and growth in the nuclear power sector will lead to sizable demand in the market.
The report on the heat exchanger market covers the following areas:
- Heat exchanger market sizing
- Heat exchanger market forecast
- Heat exchanger market industry analysis
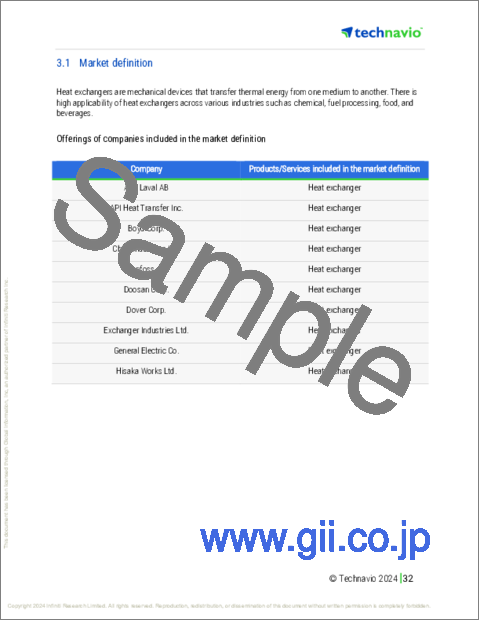
The robust vendor analysis is designed to help clients improve their market position, and in line with this, this report provides a detailed analysis of several leading heat exchanger market vendors that include Alfa Laval AB, API Heat Transfer Inc., Boyd Corp., Chart Industries Inc., Danfoss AS, Doosan Corp., Dover Corp., Exchanger Industries Ltd., General Electric Co., Guntner GmbH and Co. KG., Hisaka Works Ltd., Johnson Controls International Plc., Kelvion Holding GmbH, Koch Industries Inc., Mersen Corporate Services SAS, Radiant Heat Exchanger Pvt. Ltd., SPX FLOW Inc., Thermal Edge Inc., Thermax Ltd., and Xylem Inc.. Also, the heat exchanger market analysis report includes information on upcoming trends and challenges that will influence market growth. This is to help companies strategize and leverage all forthcoming growth opportunities.
The study was conducted using an objective combination of primary and secondary information including inputs from key participants in the industry. The report contains a comprehensive market and vendor landscape in addition to an analysis of the key vendors.
The publisher presents a detailed picture of the market by the way of study, synthesis, and summation of data from multiple sources by an analysis of key parameters such as profit, pricing, competition, and promotions. It presents various market facets by identifying the key industry influencers. The data presented is comprehensive, reliable, and a result of extensive research - both primary and secondary. The market research reports provide a complete competitive landscape and an in-depth vendor selection methodology and analysis using qualitative and quantitative research to forecast the accurate market growth.
Table of Contents
1 Executive Summary
- 1.1 Market overview
- Executive Summary - Chart on Market Overview
- Executive Summary - Data Table on Market Overview
- Executive Summary - Chart on Global Market Characteristics
- Executive Summary - Chart on Market By Geographical Landscape
- Executive Summary - Chart on Market Segmentation by End-user
- Executive Summary - Chart on Market Segmentation by Product
- Executive Summary - Chart on Incremental Growth
- Executive Summary - Data Table on Incremental Growth
- Executive Summary - Chart on Company Market Positioning
2 Market Landscape
- 2.1 Market ecosystem
- Parent Market
- Data Table on - Parent Market
- 2.2 Market characteristics
- Market characteristics analysis
- 2.3 Value chain analysis
- Value Chain Analysis
3 Market Sizing
- 3.1 Market definition
- Offerings of companies included in the market definition
- 3.2 Market segment analysis
- Market segments
- 3.3 Market size 2023
- 3.4 Market outlook: Forecast for 2023-2028
- Chart on Global - Market size and forecast 2023-2028 ($ million)
- Data Table on Global - Market size and forecast 2023-2028 ($ million)
- Chart on Global Market: Year-over-year growth 2023-2028 (%)
- Data Table on Global Market: Year-over-year growth 2023-2028 (%)
4 Historic Market Size
- 4.1 Global Heat Exchanger Market 2018 - 2022
- Historic Market Size - Data Table on Global Heat Exchanger Market 2018 - 2022 ($ million)
- 4.2 End-user segment analysis 2018 - 2022
- Historic Market Size - End-user Segment 2018 - 2022 ($ million)
- 4.3 Product segment analysis 2018 - 2022
- Historic Market Size - Product Segment 2018 - 2022 ($ million)
- 4.4 Geography segment analysis 2018 - 2022
- Historic Market Size - Geography Segment 2018 - 2022 ($ million)
- 4.5 Country segment analysis 2018 - 2022
- Historic Market Size - Country Segment 2018 - 2022 ($ million)
5 Five Forces Analysis
- 5.1 Five forces summary
- Five forces analysis - Comparison between 2023 and 2028
- 5.2 Bargaining power of buyers
- Bargaining power of buyers - Impact of key factors 2023 and 2028
- 5.3 Bargaining power of suppliers
- Bargaining power of suppliers - Impact of key factors in 2023 and 2028
- 5.4 Threat of new entrants
- Threat of new entrants - Impact of key factors in 2023 and 2028
- 5.5 Threat of substitutes
- Threat of substitutes - Impact of key factors in 2023 and 2028
- 5.6 Threat of rivalry
- Threat of rivalry - Impact of key factors in 2023 and 2028
- 5.7 Market condition
- Chart on Market condition - Five forces 2023 and 2028
6 Market Segmentation by End-user
- 6.1 Market segments
- Chart on End-user - Market share 2023-2028 (%)
- Data Table on End-user - Market share 2023-2028 (%)
- 6.2 Comparison by End-user
- Chart on Comparison by End-user
- Data Table on Comparison by End-user
- 6.3 Chemical - Market size and forecast 2023-2028
- Chart on Chemical - Market size and forecast 2023-2028 ($ million)
- Data Table on Chemical - Market size and forecast 2023-2028 ($ million)
- Chart on Chemical - Year-over-year growth 2023-2028 (%)
- Data Table on Chemical - Year-over-year growth 2023-2028 (%)
- 6.4 Fuel processing - Market size and forecast 2023-2028
- Chart on Fuel processing - Market size and forecast 2023-2028 ($ million)
- Data Table on Fuel processing - Market size and forecast 2023-2028 ($ million)
- Chart on Fuel processing - Year-over-year growth 2023-2028 (%)
- Data Table on Fuel processing - Year-over-year growth 2023-2028 (%)
- 6.5 HVAC - Market size and forecast 2023-2028
- Chart on HVAC - Market size and forecast 2023-2028 ($ million)
- Data Table on HVAC - Market size and forecast 2023-2028 ($ million)
- Chart on HVAC - Year-over-year growth 2023-2028 (%)
- Data Table on HVAC - Year-over-year growth 2023-2028 (%)
- 6.6 Others - Market size and forecast 2023-2028
- Chart on Others - Market size and forecast 2023-2028 ($ million)
- Data Table on Others - Market size and forecast 2023-2028 ($ million)
- Chart on Others - Year-over-year growth 2023-2028 (%)
- Data Table on Others - Year-over-year growth 2023-2028 (%)
- 6.7 Market opportunity by End-user
- Market opportunity by End-user ($ million)
- Data Table on Market opportunity by End-user ($ million)
7 Market Segmentation by Product
- 7.1 Market segments
- Chart on Product - Market share 2023-2028 (%)
- Data Table on Product - Market share 2023-2028 (%)
- 7.2 Comparison by Product
- Chart on Comparison by Product
- Data Table on Comparison by Product
- 7.3 Shell and tube - Market size and forecast 2023-2028
- Chart on Shell and tube - Market size and forecast 2023-2028 ($ million)
- Data Table on Shell and tube - Market size and forecast 2023-2028 ($ million)
- Chart on Shell and tube - Year-over-year growth 2023-2028 (%)
- Data Table on Shell and tube - Year-over-year growth 2023-2028 (%)
- 7.4 Plate and frame - Market size and forecast 2023-2028
- Chart on Plate and frame - Market size and forecast 2023-2028 ($ million)
- Data Table on Plate and frame - Market size and forecast 2023-2028 ($ million)
- Chart on Plate and frame - Year-over-year growth 2023-2028 (%)
- Data Table on Plate and frame - Year-over-year growth 2023-2028 (%)
- 7.5 Cooling tower - Market size and forecast 2023-2028
- Chart on Cooling tower - Market size and forecast 2023-2028 ($ million)
- Data Table on Cooling tower - Market size and forecast 2023-2028 ($ million)
- Chart on Cooling tower - Year-over-year growth 2023-2028 (%)
- Data Table on Cooling tower - Year-over-year growth 2023-2028 (%)
- 7.6 Air cooled - Market size and forecast 2023-2028
- Chart on Air cooled - Market size and forecast 2023-2028 ($ million)
- Data Table on Air cooled - Market size and forecast 2023-2028 ($ million)
- Chart on Air cooled - Year-over-year growth 2023-2028 (%)
- Data Table on Air cooled - Year-over-year growth 2023-2028 (%)
- 7.7 Others - Market size and forecast 2023-2028
- Chart on Others - Market size and forecast 2023-2028 ($ million)
- Data Table on Others - Market size and forecast 2023-2028 ($ million)
- Chart on Others - Year-over-year growth 2023-2028 (%)
- Data Table on Others - Year-over-year growth 2023-2028 (%)
- 7.8 Market opportunity by Product
- Market opportunity by Product ($ million)
- Data Table on Market opportunity by Product ($ million)
8 Customer Landscape
- 8.1 Customer landscape overview
- Analysis of price sensitivity, lifecycle, customer purchase basket, adoption rates, and purchase criteria
9 Geographic Landscape
- 9.1 Geographic segmentation
- Chart on Market share By Geographical Landscape 2023-2028 (%)
- Data Table on Market share By Geographical Landscape 2023-2028 (%)
- 9.2 Geographic comparison
- Chart on Geographic comparison
- Data Table on Geographic comparison
- 9.3 Europe - Market size and forecast 2023-2028
- Chart on Europe - Market size and forecast 2023-2028 ($ million)
- Data Table on Europe - Market size and forecast 2023-2028 ($ million)
- Chart on Europe - Year-over-year growth 2023-2028 (%)
- Data Table on Europe - Year-over-year growth 2023-2028 (%)
- 9.4 APAC - Market size and forecast 2023-2028
- Chart on APAC - Market size and forecast 2023-2028 ($ million)
- Data Table on APAC - Market size and forecast 2023-2028 ($ million)
- Chart on APAC - Year-over-year growth 2023-2028 (%)
- Data Table on APAC - Year-over-year growth 2023-2028 (%)
- 9.5 North America - Market size and forecast 2023-2028
- Chart on North America - Market size and forecast 2023-2028 ($ million)
- Data Table on North America - Market size and forecast 2023-2028 ($ million)
- Chart on North America - Year-over-year growth 2023-2028 (%)
- Data Table on North America - Year-over-year growth 2023-2028 (%)
- 9.6 South America - Market size and forecast 2023-2028
- Chart on South America - Market size and forecast 2023-2028 ($ million)
- Data Table on South America - Market size and forecast 2023-2028 ($ million)
- Chart on South America - Year-over-year growth 2023-2028 (%)
- Data Table on South America - Year-over-year growth 2023-2028 (%)
- 9.7 Middle East and Africa - Market size and forecast 2023-2028
- Chart on Middle East and Africa - Market size and forecast 2023-2028 ($ million)
- Data Table on Middle East and Africa - Market size and forecast 2023-2028 ($ million)
- Chart on Middle East and Africa - Year-over-year growth 2023-2028 (%)
- Data Table on Middle East and Africa - Year-over-year growth 2023-2028 (%)
- 9.8 US - Market size and forecast 2023-2028
- Chart on US - Market size and forecast 2023-2028 ($ million)
- Data Table on US - Market size and forecast 2023-2028 ($ million)
- Chart on US - Year-over-year growth 2023-2028 (%)
- Data Table on US - Year-over-year growth 2023-2028 (%)
- 9.9 China - Market size and forecast 2023-2028
- Chart on China - Market size and forecast 2023-2028 ($ million)
- Data Table on China - Market size and forecast 2023-2028 ($ million)
- Chart on China - Year-over-year growth 2023-2028 (%)
- Data Table on China - Year-over-year growth 2023-2028 (%)
- 9.10 Germany - Market size and forecast 2023-2028
- Chart on Germany - Market size and forecast 2023-2028 ($ million)
- Data Table on Germany - Market size and forecast 2023-2028 ($ million)
- Chart on Germany - Year-over-year growth 2023-2028 (%)
- Data Table on Germany - Year-over-year growth 2023-2028 (%)
- 9.11 UK - Market size and forecast 2023-2028
- Chart on UK - Market size and forecast 2023-2028 ($ million)
- Data Table on UK - Market size and forecast 2023-2028 ($ million)
- Chart on UK - Year-over-year growth 2023-2028 (%)
- Data Table on UK - Year-over-year growth 2023-2028 (%)
- 9.12 Canada - Market size and forecast 2023-2028
- Chart on Canada - Market size and forecast 2023-2028 ($ million)
- Data Table on Canada - Market size and forecast 2023-2028 ($ million)
- Chart on Canada - Year-over-year growth 2023-2028 (%)
- Data Table on Canada - Year-over-year growth 2023-2028 (%)
- 9.13 Market opportunity By Geographical Landscape
- Market opportunity By Geographical Landscape ($ million)
- Data Tables on Market opportunity By Geographical Landscape ($ million)
10 Drivers, Challenges, and Opportunity/Restraints
- 10.1 Market drivers
- 10.2 Market challenges
- 10.3 Impact of drivers and challenges
- Impact of drivers and challenges in 2023 and 2028
- 10.4 Market opportunities/restraints
11 Competitive Landscape
- 11.1 Overview
- 11.2 Competitive Landscape
- Overview on criticality of inputs and factors of differentiation
- 11.3 Landscape disruption
- Overview on factors of disruption
- 11.4 Industry risks
- Impact of key risks on business
12 Competitive Analysis
- 12.1 Companies profiled
- Companies covered
- 12.2 Market positioning of companies
- Matrix on companies position and classification
- 12.3 Alfa Laval AB
- Alfa Laval AB - Overview
- Alfa Laval AB - Business segments
- Alfa Laval AB - Key news
- Alfa Laval AB - Key offerings
- Alfa Laval AB - Segment focus
- 12.4 API Heat Transfer Inc.
- API Heat Transfer Inc. - Overview
- API Heat Transfer Inc. - Product / Service
- API Heat Transfer Inc. - Key offerings
- 12.5 Boyd Corp.
- Boyd Corp. - Overview
- Boyd Corp. - Product / Service
- Boyd Corp. - Key offerings
- 12.6 Chart Industries Inc.
- Chart Industries Inc. - Overview
- Chart Industries Inc. - Business segments
- Chart Industries Inc. - Key news
- Chart Industries Inc. - Key offerings
- Chart Industries Inc. - Segment focus
- 12.7 Danfoss AS
- Danfoss AS - Overview
- Danfoss AS - Product / Service
- Danfoss AS - Key offerings
- 12.8 Doosan Corp.
- Doosan Corp. - Overview
- Doosan Corp. - Business segments
- Doosan Corp. - Key news
- Doosan Corp. - Key offerings
- Doosan Corp. - Segment focus
- 12.9 Dover Corp.
- Dover Corp. - Overview
- Dover Corp. - Business segments
- Dover Corp. - Key news
- Dover Corp. - Key offerings
- Dover Corp. - Segment focus
- 12.10 Exchanger Industries Ltd.
- Exchanger Industries Ltd. - Overview
- Exchanger Industries Ltd. - Product / Service
- Exchanger Industries Ltd. - Key offerings
- 12.11 General Electric Co.
- General Electric Co. - Overview
- General Electric Co. - Business segments
- General Electric Co. - Key news
- General Electric Co. - Key offerings
- General Electric Co. - Segment focus
- 12.12 Hisaka Works Ltd.
- Hisaka Works Ltd. - Overview
- Hisaka Works Ltd. - Product / Service
- Hisaka Works Ltd. - Key offerings
- 12.13 Johnson Controls International Plc.
- Johnson Controls International Plc. - Overview
- Johnson Controls International Plc. - Business segments
- Johnson Controls International Plc. - Key news
- Johnson Controls International Plc. - Key offerings
- Johnson Controls International Plc. - Segment focus
- 12.14 Kelvion Holding GmbH
- Kelvion Holding GmbH - Overview
- Kelvion Holding GmbH - Product / Service
- Kelvion Holding GmbH - Key offerings
- 12.15 Koch Industries Inc.
- Koch Industries Inc. - Overview
- Koch Industries Inc. - Product / Service
- Koch Industries Inc. - Key offerings
- 12.16 SPX FLOW Inc.
- SPX FLOW Inc. - Overview
- SPX FLOW Inc. - Product / Service
- SPX FLOW Inc. - Key news
- SPX FLOW Inc. - Key offerings
- 12.17 Thermal Edge Inc.
- Thermal Edge Inc. - Overview
- Thermal Edge Inc. - Product / Service
- Thermal Edge Inc. - Key offerings
13 Appendix
- 13.1 Scope of the report
- 13.2 Inclusions and exclusions checklist
- Inclusions checklist
- Exclusions checklist
- 13.3 Currency conversion rates for US$
- Currency conversion rates for US$
- 13.4 Research methodology
- Research methodology
- 13.5 Data procurement
- Information sources
- 13.6 Data validation
- Data validation
- 13.7 Validation techniques employed for market sizing
- Validation techniques employed for market sizing
- 13.8 Data synthesis
- Data synthesis
- 13.9 360 degree market analysis
- 360 degree market analysis
- 13.10 List of abbreviations
- List of abbreviations

