|
|
市場調査レポート
商品コード
1515962
プラスチックパレットの世界市場 2024-2028Global plastic pallets market 2024-2028 |
||||||
|
|||||||
カスタマイズ可能
|
|||||||

| プラスチックパレットの世界市場 2024-2028 |
|
出版日: 2024年06月11日
発行: TechNavio
ページ情報: 英文 151 Pages
納期: 即納可能
|

全表示
- 概要
- 図表
- 目次
プラスチックパレット市場は2023-2028年に 13億2,230万米ドル、予測期間中のCAGRは3.84%で成長すると予測されています。
当レポートでは、プラスチックパレット市場の全体的な分析、市場規模・予測、動向、成長促進要因、課題、約25のベンダーを網羅したベンダー分析などを掲載しています。
現在の市場シナリオ、最新動向と促進要因、市場環境全体に関する最新分析を提供しています。市場は、プラスチックパレットの使用に関連する利点、海運および荷役部門における高い用途、市場を活性化するアジア太平洋地域の市場によって牽引されています。
| 市場範囲 | |
|---|---|
| 基準年 | 2024 |
| 終了年 | 2028 |
| 予測期間 | 2024-2028 |
| 成長モメンタム | 加速 |
| 前年比2024年 | 3.54% |
| CAGR | 3.84% |
| 増分額 | 13億2,230万米ドル |
本調査では、今後数年間のプラスチックパレット市場成長を牽引する主な要因の一つとして、100%リサイクル可能なプラスチックを使用したプラスチックパレットの製造を挙げています。また、プラスチックパレットを追跡するためのRFIDタグや、産業オートメーションをサポートするプラスチックパレット設計の進歩は、市場の大きな需要につながります。
目次
第1章 エグゼクティブサマリー
- 市場概要
第2章 市場情勢
- 市場エコシステム
- 市場の特徴
- バリューチェーン分析
第3章 市場規模の評価
- 市場の定義
- 市場セグメント分析
- 市場規模 2023
- 市場の見通し 2023-2028
第4章 市場規模実績
- 世界プラスチックパレット市場 2018-2022
- 材料別セグメント分析 2018-2022
- 地域別セグメント分析 2018-2022
- 国別セグメント分析 2018-2022
第5章 ファイブフォース分析
- ファイブフォースの要約
- 買い手の交渉力
- 供給企業の交渉力
- 新規参入業者の脅威
- 代替品の脅威
- 競争の脅威
- 市況
第6章 市場セグメンテーション:材料別
- 市場セグメンテーション
- 比較:材料別
- 高密度ポリエチレン:市場規模と予測 2023-2028
- PP:市場規模と予測 2023-2028
- 市場機会:材料別
第7章 顧客情勢
- 顧客情勢の概要
第8章 地域別情勢
- 地域別セグメンテーション
- 地域別比較
- アジア太平洋:市場規模と予測 2023-2028
- 欧州:市場規模と予測 2023-2028
- 北米:市場規模と予測 2023-2028
- 南米:市場規模と予測 2023-2028
- 中東・アフリカ:市場規模と予測 2023-2028
- 米国:市場規模と予測 2023-2028
- 中国:市場規模と予測 2023-2028
- 日本:市場規模と予測 2023-2028
- ドイツ:市場規模と予測 2023-2028
- 英国:市場規模と予測 2023-2028
- 市場機会:地域情勢別
第9章 促進要因・課題・機会・抑制要因
- 市場促進要因
- 市場の課題
- 促進要因と課題の影響
- 市場の機会・抑制要因
第10章 競合情勢
- 概要
- 競合情勢
- 混乱の状況
- 業界のリスク
第11章 競合分析
- 企業プロファイル
- 企業の市場ポジショニング
- Brambles Ltd.
- CABKA Group GmbH
- CTC Plastics
- De Vierhouten Groep BV
- DIC Corp.
- Enlightening Pallet Industry Co. Ltd.
- Greif Inc.
- Greystone Logistics Inc.
- Litco International Inc.
- Loscam International Holdings Co. Ltd.
- Myers Industries Inc.
- Nefab AB
- PGS Group
- Rehrig Pacific Co.
- Schoeller Allibert
第12章 付録
Exhibits:
- Exhibits1: Executive Summary - Chart on Market Overview
- Exhibits2: Executive Summary - Data Table on Market Overview
- Exhibits3: Executive Summary - Chart on Global Market Characteristics
- Exhibits4: Executive Summary - Chart on Market By Geographical Landscape
- Exhibits5: Executive Summary - Chart on Market Segmentation by Material
- Exhibits6: Executive Summary - Chart on Incremental Growth
- Exhibits7: Executive Summary - Data Table on Incremental Growth
- Exhibits8: Executive Summary - Chart on Company Market Positioning
- Exhibits9: Parent Market
- Exhibits10: Data Table on - Parent Market
- Exhibits11: Market characteristics analysis
- Exhibits12: Value Chain Analysis
- Exhibits13: Offerings of companies included in the market definition
- Exhibits14: Market segments
- Exhibits15: Chart on Global - Market size and forecast 2023-2028 ($ million)
- Exhibits16: Data Table on Global - Market size and forecast 2023-2028 ($ million)
- Exhibits17: Chart on Global Market: Year-over-year growth 2023-2028 (%)
- Exhibits18: Data Table on Global Market: Year-over-year growth 2023-2028 (%)
- Exhibits19: Historic Market Size - Data Table on Global Plastic Pallets Market 2018 - 2022 ($ million)
- Exhibits20: Historic Market Size - Material Segment 2018 - 2022 ($ million)
- Exhibits21: Historic Market Size - Geography Segment 2018 - 2022 ($ million)
- Exhibits22: Historic Market Size - Country Segment 2018 - 2022 ($ million)
- Exhibits23: Five forces analysis - Comparison between 2023 and 2028
- Exhibits24: Bargaining power of buyers - Impact of key factors 2023 and 2028
- Exhibits25: Bargaining power of suppliers - Impact of key factors in 2023 and 2028
- Exhibits26: Threat of new entrants - Impact of key factors in 2023 and 2028
- Exhibits27: Threat of substitutes - Impact of key factors in 2023 and 2028
- Exhibits28: Threat of rivalry - Impact of key factors in 2023 and 2028
- Exhibits29: Chart on Market condition - Five forces 2023 and 2028
- Exhibits30: Chart on Material - Market share 2023-2028 (%)
- Exhibits31: Data Table on Material - Market share 2023-2028 (%)
- Exhibits32: Chart on Comparison by Material
- Exhibits33: Data Table on Comparison by Material
- Exhibits34: Chart on HDPE - Market size and forecast 2023-2028 ($ million)
- Exhibits35: Data Table on HDPE - Market size and forecast 2023-2028 ($ million)
- Exhibits36: Chart on HDPE - Year-over-year growth 2023-2028 (%)
- Exhibits37: Data Table on HDPE - Year-over-year growth 2023-2028 (%)
- Exhibits38: Chart on PP - Market size and forecast 2023-2028 ($ million)
- Exhibits39: Data Table on PP - Market size and forecast 2023-2028 ($ million)
- Exhibits40: Chart on PP - Year-over-year growth 2023-2028 (%)
- Exhibits41: Data Table on PP - Year-over-year growth 2023-2028 (%)
- Exhibits42: Market opportunity by Material ($ million)
- Exhibits43: Data Table on Market opportunity by Material ($ million)
- Exhibits44: Analysis of price sensitivity, lifecycle, customer purchase basket, adoption rates, and purchase criteria
- Exhibits45: Chart on Market share By Geographical Landscape 2023-2028 (%)
- Exhibits46: Data Table on Market share By Geographical Landscape 2023-2028 (%)
- Exhibits47: Chart on Geographic comparison
- Exhibits48: Data Table on Geographic comparison
- Exhibits49: Chart on APAC - Market size and forecast 2023-2028 ($ million)
- Exhibits50: Data Table on APAC - Market size and forecast 2023-2028 ($ million)
- Exhibits51: Chart on APAC - Year-over-year growth 2023-2028 (%)
- Exhibits52: Data Table on APAC - Year-over-year growth 2023-2028 (%)
- Exhibits53: Chart on Europe - Market size and forecast 2023-2028 ($ million)
- Exhibits54: Data Table on Europe - Market size and forecast 2023-2028 ($ million)
- Exhibits55: Chart on Europe - Year-over-year growth 2023-2028 (%)
- Exhibits56: Data Table on Europe - Year-over-year growth 2023-2028 (%)
- Exhibits57: Chart on North America - Market size and forecast 2023-2028 ($ million)
- Exhibits58: Data Table on North America - Market size and forecast 2023-2028 ($ million)
- Exhibits59: Chart on North America - Year-over-year growth 2023-2028 (%)
- Exhibits60: Data Table on North America - Year-over-year growth 2023-2028 (%)
- Exhibits61: Chart on South America - Market size and forecast 2023-2028 ($ million)
- Exhibits62: Data Table on South America - Market size and forecast 2023-2028 ($ million)
- Exhibits63: Chart on South America - Year-over-year growth 2023-2028 (%)
- Exhibits64: Data Table on South America - Year-over-year growth 2023-2028 (%)
- Exhibits65: Chart on Middle East and Africa - Market size and forecast 2023-2028 ($ million)
- Exhibits66: Data Table on Middle East and Africa - Market size and forecast 2023-2028 ($ million)
- Exhibits67: Chart on Middle East and Africa - Year-over-year growth 2023-2028 (%)
- Exhibits68: Data Table on Middle East and Africa - Year-over-year growth 2023-2028 (%)
- Exhibits69: Chart on US - Market size and forecast 2023-2028 ($ million)
- Exhibits70: Data Table on US - Market size and forecast 2023-2028 ($ million)
- Exhibits71: Chart on US - Year-over-year growth 2023-2028 (%)
- Exhibits72: Data Table on US - Year-over-year growth 2023-2028 (%)
- Exhibits73: Chart on China - Market size and forecast 2023-2028 ($ million)
- Exhibits74: Data Table on China - Market size and forecast 2023-2028 ($ million)
- Exhibits75: Chart on China - Year-over-year growth 2023-2028 (%)
- Exhibits76: Data Table on China - Year-over-year growth 2023-2028 (%)
- Exhibits77: Chart on Japan - Market size and forecast 2023-2028 ($ million)
- Exhibits78: Data Table on Japan - Market size and forecast 2023-2028 ($ million)
- Exhibits79: Chart on Japan - Year-over-year growth 2023-2028 (%)
- Exhibits80: Data Table on Japan - Year-over-year growth 2023-2028 (%)
- Exhibits81: Chart on Germany - Market size and forecast 2023-2028 ($ million)
- Exhibits82: Data Table on Germany - Market size and forecast 2023-2028 ($ million)
- Exhibits83: Chart on Germany - Year-over-year growth 2023-2028 (%)
- Exhibits84: Data Table on Germany - Year-over-year growth 2023-2028 (%)
- Exhibits85: Chart on UK - Market size and forecast 2023-2028 ($ million)
- Exhibits86: Data Table on UK - Market size and forecast 2023-2028 ($ million)
- Exhibits87: Chart on UK - Year-over-year growth 2023-2028 (%)
- Exhibits88: Data Table on UK - Year-over-year growth 2023-2028 (%)
- Exhibits89: Market opportunity By Geographical Landscape ($ million)
- Exhibits90: Data Tables on Market opportunity By Geographical Landscape ($ million)
- Exhibits91: Impact of drivers and challenges in 2023 and 2028
- Exhibits92: Overview on criticality of inputs and factors of differentiation
- Exhibits93: Overview on factors of disruption
- Exhibits94: Impact of key risks on business
- Exhibits95: Companies covered
- Exhibits96: Matrix on companies position and classification
- Exhibits97: Brambles Ltd. - Overview
- Exhibits98: Brambles Ltd. - Business segments
- Exhibits99: Brambles Ltd. - Key offerings
- Exhibits100: Brambles Ltd. - Segment focus
- Exhibits101: CABKA Group GmbH - Overview
- Exhibits102: CABKA Group GmbH - Product / Service
- Exhibits103: CABKA Group GmbH - Key news
- Exhibits104: CABKA Group GmbH - Key offerings
- Exhibits105: CTC Plastics - Overview
- Exhibits106: CTC Plastics - Product / Service
- Exhibits107: CTC Plastics - Key offerings
- Exhibits108: De Vierhouten Groep BV - Overview
- Exhibits109: De Vierhouten Groep BV - Product / Service
- Exhibits110: De Vierhouten Groep BV - Key offerings
- Exhibits111: DIC Corp. - Overview
- Exhibits112: DIC Corp. - Business segments
- Exhibits113: DIC Corp. - Key news
- Exhibits114: DIC Corp. - Key offerings
- Exhibits115: DIC Corp. - Segment focus
- Exhibits116: Enlightening Pallet Industry Co. Ltd. - Overview
- Exhibits117: Enlightening Pallet Industry Co. Ltd. - Product / Service
- Exhibits118: Enlightening Pallet Industry Co. Ltd. - Key offerings
- Exhibits119: Greif Inc. - Overview
- Exhibits120: Greif Inc. - Business segments
- Exhibits121: Greif Inc. - Key news
- Exhibits122: Greif Inc. - Key offerings
- Exhibits123: Greif Inc. - Segment focus
- Exhibits124: Greystone Logistics Inc. - Overview
- Exhibits125: Greystone Logistics Inc. - Product / Service
- Exhibits126: Greystone Logistics Inc. - Key offerings
- Exhibits127: Litco International Inc. - Overview
- Exhibits128: Litco International Inc. - Product / Service
- Exhibits129: Litco International Inc. - Key offerings
- Exhibits130: Loscam International Holdings Co. Ltd. - Overview
- Exhibits131: Loscam International Holdings Co. Ltd. - Product / Service
- Exhibits132: Loscam International Holdings Co. Ltd. - Key offerings
- Exhibits133: Myers Industries Inc. - Overview
- Exhibits134: Myers Industries Inc. - Business segments
- Exhibits135: Myers Industries Inc. - Key offerings
- Exhibits136: Myers Industries Inc. - Segment focus
- Exhibits137: Nefab AB - Overview
- Exhibits138: Nefab AB - Product / Service
- Exhibits139: Nefab AB - Key offerings
- Exhibits140: PGS Group - Overview
- Exhibits141: PGS Group - Product / Service
- Exhibits142: PGS Group - Key offerings
- Exhibits143: Rehrig Pacific Co. - Overview
- Exhibits144: Rehrig Pacific Co. - Product / Service
- Exhibits145: Rehrig Pacific Co. - Key offerings
- Exhibits146: Schoeller Allibert - Overview
- Exhibits147: Schoeller Allibert - Product / Service
- Exhibits148: Schoeller Allibert - Key offerings
- Exhibits149: Inclusions checklist
- Exhibits150: Exclusions checklist
- Exhibits151: Currency conversion rates for US$
- Exhibits152: Research methodology
- Exhibits153: Information sources
- Exhibits154: Data validation
- Exhibits155: Validation techniques employed for market sizing
- Exhibits156: Data synthesis
- Exhibits157: 360 degree market analysis
- Exhibits158: List of abbreviations
The plastic pallets market is forecasted to grow by USD 1322.3 mn during 2023-2028, accelerating at a CAGR of 3.84% during the forecast period. The report on the plastic pallets market provides a holistic analysis, market size and forecast, trends, growth drivers, and challenges, as well as vendor analysis covering around 25 vendors.
The report offers an up-to-date analysis regarding the current market scenario, the latest trends and drivers, and the overall market environment. The market is driven by benefits associated with use of plastic pallets, high application in shipping and load handling sectors, and emerging markets in apac acting as market enablers.
Technavio's plastic pallets market is segmented as below:
| Market Scope | |
|---|---|
| Base Year | 2024 |
| End Year | 2028 |
| Series Year | 2024-2028 |
| Growth Momentum | Accelerate |
| YOY 2024 | 3.54% |
| CAGR | 3.84% |
| Incremental Value | $1322.3mn |
By Material
- HDPE
- PP
By Geographical Landscape
- APAC
- Europe
- North America
- South America
- Middle East and Africa
This study identifies the manufacturing of plastic pallets using 100 percentage recyclable plastics as one of the prime reasons driving the plastic pallets market growth during the next few years. Also, rfid tags for tracking plastic pallets and advances in plastic pallet design to support industrial automation will lead to sizable demand in the market.
The report on the plastic pallets market covers the following areas:
- Plastic pallets market sizing
- Plastic pallets market forecast
- Plastic pallets market industry analysis
The robust vendor analysis is designed to help clients improve their market position, and in line with this, this report provides a detailed analysis of several leading plastic pallets market vendors that include Agrico Plastiques Ltee, Allied Plastics Inc., Brambles Ltd., CABKA Group GmbH, CTC Plastics, De Vierhouten Groep BV, DIC Corp., Enlightening Pallet Industry Co. Ltd., Greif Inc., Greystone Logistics Inc., Kamps Inc., Litco International Inc., Loscam International Holdings Co. Ltd., Monoflo International Inc., Myers Industries Inc., Nefab AB, Perfect Pallets Inc., PGS Group, Polymer Solutions International Inc., PURUS PLASTICS GmbH, Rehrig Pacific Co., Schoeller Allibert, SDI Packaging Inc., T.M. Fitzgerald and Associates, and TranPak Inc.. Also, the plastic pallets market analysis report includes information on upcoming trends and challenges that will influence market growth. This is to help companies strategize and leverage all forthcoming growth opportunities.
The study was conducted using an objective combination of primary and secondary information including inputs from key participants in the industry. The report contains a comprehensive market and vendor landscape in addition to an analysis of the key vendors.
The publisher presents a detailed picture of the market by the way of study, synthesis, and summation of data from multiple sources by an analysis of key parameters such as profit, pricing, competition, and promotions. It presents various market facets by identifying the key industry influencers. The data presented is comprehensive, reliable, and a result of extensive research - both primary and secondary. The market research reports provide a complete competitive landscape and an in-depth vendor selection methodology and analysis using qualitative and quantitative research to forecast the accurate market growth.
Table of Contents
1 Executive Summary
- 1.1 Market overview
- Executive Summary - Chart on Market Overview
- Executive Summary - Data Table on Market Overview
- Executive Summary - Chart on Global Market Characteristics
- Executive Summary - Chart on Market By Geographical Landscape
- Executive Summary - Chart on Market Segmentation by Material
- Executive Summary - Chart on Incremental Growth
- Executive Summary - Data Table on Incremental Growth
- Executive Summary - Chart on Company Market Positioning
2 Market Landscape
- 2.1 Market ecosystem
- Parent Market
- Data Table on - Parent Market
- 2.2 Market characteristics
- Market characteristics analysis
- 2.3 Value chain analysis
- Value Chain Analysis
3 Market Sizing
- 3.1 Market definition
- Offerings of companies included in the market definition
- 3.2 Market segment analysis
- Market segments
- 3.3 Market size 2023
- 3.4 Market outlook: Forecast for 2023-2028
- Chart on Global - Market size and forecast 2023-2028 ($ million)
- Data Table on Global - Market size and forecast 2023-2028 ($ million)
- Chart on Global Market: Year-over-year growth 2023-2028 (%)
- Data Table on Global Market: Year-over-year growth 2023-2028 (%)
4 Historic Market Size
- 4.1 Global Plastic Pallets Market 2018 - 2022
- Historic Market Size - Data Table on Global Plastic Pallets Market 2018 - 2022 ($ million)
- 4.2 Material segment analysis 2018 - 2022
- Historic Market Size - Material Segment 2018 - 2022 ($ million)
- 4.3 Geography segment analysis 2018 - 2022
- Historic Market Size - Geography Segment 2018 - 2022 ($ million)
- 4.4 Country segment analysis 2018 - 2022
- Historic Market Size - Country Segment 2018 - 2022 ($ million)
5 Five Forces Analysis
- 5.1 Five forces summary
- Five forces analysis - Comparison between 2023 and 2028
- 5.2 Bargaining power of buyers
- Bargaining power of buyers - Impact of key factors 2023 and 2028
- 5.3 Bargaining power of suppliers
- Bargaining power of suppliers - Impact of key factors in 2023 and 2028
- 5.4 Threat of new entrants
- Threat of new entrants - Impact of key factors in 2023 and 2028
- 5.5 Threat of substitutes
- Threat of substitutes - Impact of key factors in 2023 and 2028
- 5.6 Threat of rivalry
- Threat of rivalry - Impact of key factors in 2023 and 2028
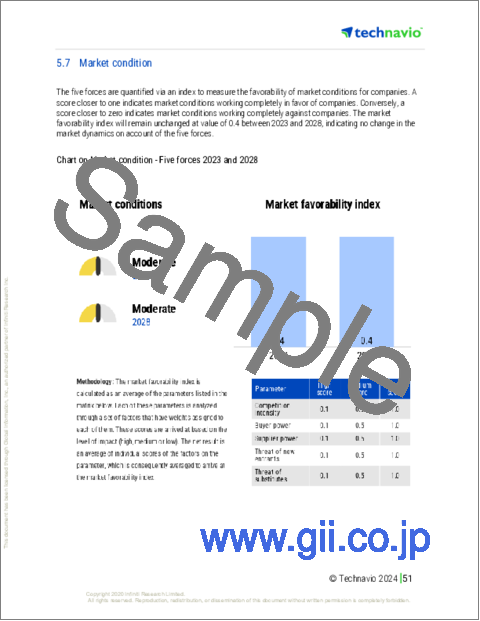
- 5.7 Market condition
- Chart on Market condition - Five forces 2023 and 2028
6 Market Segmentation by Material
- 6.1 Market segments
- Chart on Material - Market share 2023-2028 (%)
- Data Table on Material - Market share 2023-2028 (%)
- 6.2 Comparison by Material
- Chart on Comparison by Material
- Data Table on Comparison by Material
- 6.3 HDPE - Market size and forecast 2023-2028
- Chart on HDPE - Market size and forecast 2023-2028 ($ million)
- Data Table on HDPE - Market size and forecast 2023-2028 ($ million)
- Chart on HDPE - Year-over-year growth 2023-2028 (%)
- Data Table on HDPE - Year-over-year growth 2023-2028 (%)
- 6.4 PP - Market size and forecast 2023-2028
- Chart on PP - Market size and forecast 2023-2028 ($ million)
- Data Table on PP - Market size and forecast 2023-2028 ($ million)
- Chart on PP - Year-over-year growth 2023-2028 (%)
- Data Table on PP - Year-over-year growth 2023-2028 (%)
- 6.5 Market opportunity by Material
- Market opportunity by Material ($ million)
- Data Table on Market opportunity by Material ($ million)
7 Customer Landscape
- 7.1 Customer landscape overview
- Analysis of price sensitivity, lifecycle, customer purchase basket, adoption rates, and purchase criteria
8 Geographic Landscape
- 8.1 Geographic segmentation
- Chart on Market share By Geographical Landscape 2023-2028 (%)
- Data Table on Market share By Geographical Landscape 2023-2028 (%)
- 8.2 Geographic comparison
- Chart on Geographic comparison
- Data Table on Geographic comparison
- 8.3 APAC - Market size and forecast 2023-2028
- Chart on APAC - Market size and forecast 2023-2028 ($ million)
- Data Table on APAC - Market size and forecast 2023-2028 ($ million)
- Chart on APAC - Year-over-year growth 2023-2028 (%)
- Data Table on APAC - Year-over-year growth 2023-2028 (%)
- 8.4 Europe - Market size and forecast 2023-2028
- Chart on Europe - Market size and forecast 2023-2028 ($ million)
- Data Table on Europe - Market size and forecast 2023-2028 ($ million)
- Chart on Europe - Year-over-year growth 2023-2028 (%)
- Data Table on Europe - Year-over-year growth 2023-2028 (%)
- 8.5 North America - Market size and forecast 2023-2028
- Chart on North America - Market size and forecast 2023-2028 ($ million)
- Data Table on North America - Market size and forecast 2023-2028 ($ million)
- Chart on North America - Year-over-year growth 2023-2028 (%)
- Data Table on North America - Year-over-year growth 2023-2028 (%)
- 8.6 South America - Market size and forecast 2023-2028
- Chart on South America - Market size and forecast 2023-2028 ($ million)
- Data Table on South America - Market size and forecast 2023-2028 ($ million)
- Chart on South America - Year-over-year growth 2023-2028 (%)
- Data Table on South America - Year-over-year growth 2023-2028 (%)
- 8.7 Middle East and Africa - Market size and forecast 2023-2028
- Chart on Middle East and Africa - Market size and forecast 2023-2028 ($ million)
- Data Table on Middle East and Africa - Market size and forecast 2023-2028 ($ million)
- Chart on Middle East and Africa - Year-over-year growth 2023-2028 (%)
- Data Table on Middle East and Africa - Year-over-year growth 2023-2028 (%)
- 8.8 US - Market size and forecast 2023-2028
- Chart on US - Market size and forecast 2023-2028 ($ million)
- Data Table on US - Market size and forecast 2023-2028 ($ million)
- Chart on US - Year-over-year growth 2023-2028 (%)
- Data Table on US - Year-over-year growth 2023-2028 (%)
- 8.9 China - Market size and forecast 2023-2028
- Chart on China - Market size and forecast 2023-2028 ($ million)
- Data Table on China - Market size and forecast 2023-2028 ($ million)
- Chart on China - Year-over-year growth 2023-2028 (%)
- Data Table on China - Year-over-year growth 2023-2028 (%)
- 8.10 Japan - Market size and forecast 2023-2028
- Chart on Japan - Market size and forecast 2023-2028 ($ million)
- Data Table on Japan - Market size and forecast 2023-2028 ($ million)
- Chart on Japan - Year-over-year growth 2023-2028 (%)
- Data Table on Japan - Year-over-year growth 2023-2028 (%)
- 8.11 Germany - Market size and forecast 2023-2028
- Chart on Germany - Market size and forecast 2023-2028 ($ million)
- Data Table on Germany - Market size and forecast 2023-2028 ($ million)
- Chart on Germany - Year-over-year growth 2023-2028 (%)
- Data Table on Germany - Year-over-year growth 2023-2028 (%)
- 8.12 UK - Market size and forecast 2023-2028
- Chart on UK - Market size and forecast 2023-2028 ($ million)
- Data Table on UK - Market size and forecast 2023-2028 ($ million)
- Chart on UK - Year-over-year growth 2023-2028 (%)
- Data Table on UK - Year-over-year growth 2023-2028 (%)
- 8.13 Market opportunity By Geographical Landscape
- Market opportunity By Geographical Landscape ($ million)
- Data Tables on Market opportunity By Geographical Landscape ($ million)
9 Drivers, Challenges, and Opportunity/Restraints
- 9.1 Market drivers
- 9.2 Market challenges
- 9.3 Impact of drivers and challenges
- Impact of drivers and challenges in 2023 and 2028
- 9.4 Market opportunities/restraints
10 Competitive Landscape
- 10.1 Overview
- 10.2 Competitive Landscape
- Overview on criticality of inputs and factors of differentiation
- 10.3 Landscape disruption
- Overview on factors of disruption
- 10.4 Industry risks
- Impact of key risks on business
11 Competitive Analysis
- 11.1 Companies profiled
- Companies covered
- 11.2 Market positioning of companies
- Matrix on companies position and classification
- 11.3 Brambles Ltd.
- Brambles Ltd. - Overview
- Brambles Ltd. - Business segments
- Brambles Ltd. - Key offerings
- Brambles Ltd. - Segment focus
- 11.4 CABKA Group GmbH
- CABKA Group GmbH - Overview
- CABKA Group GmbH - Product / Service
- CABKA Group GmbH - Key news
- CABKA Group GmbH - Key offerings
- 11.5 CTC Plastics
- CTC Plastics - Overview
- CTC Plastics - Product / Service
- CTC Plastics - Key offerings
- 11.6 De Vierhouten Groep BV
- De Vierhouten Groep BV - Overview
- De Vierhouten Groep BV - Product / Service
- De Vierhouten Groep BV - Key offerings
- 11.7 DIC Corp.
- DIC Corp. - Overview
- DIC Corp. - Business segments
- DIC Corp. - Key news
- DIC Corp. - Key offerings
- DIC Corp. - Segment focus
- 11.8 Enlightening Pallet Industry Co. Ltd.
- Enlightening Pallet Industry Co. Ltd. - Overview
- Enlightening Pallet Industry Co. Ltd. - Product / Service
- Enlightening Pallet Industry Co. Ltd. - Key offerings
- 11.9 Greif Inc.
- Greif Inc. - Overview
- Greif Inc. - Business segments
- Greif Inc. - Key news
- Greif Inc. - Key offerings
- Greif Inc. - Segment focus
- 11.10 Greystone Logistics Inc.
- Greystone Logistics Inc. - Overview
- Greystone Logistics Inc. - Product / Service
- Greystone Logistics Inc. - Key offerings
- 11.11 Litco International Inc.
- Litco International Inc. - Overview
- Litco International Inc. - Product / Service
- Litco International Inc. - Key offerings
- 11.12 Loscam International Holdings Co. Ltd.
- Loscam International Holdings Co. Ltd. - Overview
- Loscam International Holdings Co. Ltd. - Product / Service
- Loscam International Holdings Co. Ltd. - Key offerings
- 11.13 Myers Industries Inc.
- Myers Industries Inc. - Overview
- Myers Industries Inc. - Business segments
- Myers Industries Inc. - Key offerings
- Myers Industries Inc. - Segment focus
- 11.14 Nefab AB
- Nefab AB - Overview
- Nefab AB - Product / Service
- Nefab AB - Key offerings
- 11.15 PGS Group
- PGS Group - Overview
- PGS Group - Product / Service
- PGS Group - Key offerings
- 11.16 Rehrig Pacific Co.
- Rehrig Pacific Co. - Overview
- Rehrig Pacific Co. - Product / Service
- Rehrig Pacific Co. - Key offerings
- 11.17 Schoeller Allibert
- Schoeller Allibert - Overview
- Schoeller Allibert - Product / Service
- Schoeller Allibert - Key offerings
12 Appendix
- 12.1 Scope of the report
- 12.2 Inclusions and exclusions checklist
- Inclusions checklist
- Exclusions checklist
- 12.3 Currency conversion rates for US$
- Currency conversion rates for US$
- 12.4 Research methodology
- Research methodology
- 12.5 Data procurement
- Information sources
- 12.6 Data validation
- Data validation
- 12.7 Validation techniques employed for market sizing
- Validation techniques employed for market sizing
- 12.8 Data synthesis
- Data synthesis
- 12.9 360 degree market analysis
- 360 degree market analysis
- 12.10 List of abbreviations
- List of abbreviations

