|
|
市場調査レポート
商品コード
1502345
アロニア・ベリーの世界市場 2024-2028Global aronia berries market 2024-2028 |
||||||
|
|||||||
カスタマイズ可能
|
|||||||


| アロニア・ベリーの世界市場 2024-2028 |
|
出版日: 2024年05月17日
発行: TechNavio
ページ情報: 英文 158 Pages
納期: 即納可能
|

全表示
- 概要
- 図表
- 目次
Technavio社は、アロニア・ベリー市場をモニターしており、2023年から2028年にかけて5億150万米ドル、予測期間中のCAGRは9.64%で成長すると予測しています。
当レポートでは、アロニア・ベリー市場の全体的な分析、市場規模・予測、動向、成長促進要因、課題、約25のベンダーを網羅したベンダー分析などを掲載しています。
現在の市場シナリオ、最新動向と促進要因、市場環境全体に関する最新分析を提供しています。市場は、アロニア・ベリーの健康効果、プライベートブランド数の増加、オンライン小売とeコマースの浸透の高まりによって牽引されています。
| 市場範囲 | |
|---|---|
| 基準年 | 2024 |
| 終了年 | 2028 |
| 予測期間 | 2024-2028 |
| 成長モメンタム | 加速 |
| 前年比2024年 | 8.57% |
| CAGR | 9.64% |
| 増分額 | 5億150万米ドル |
本調査では、今後数年間のアロニア・ベリー市場成長を牽引する主な要因の一つとして、植物性飲料に対する需要の高まりを挙げています。また、スーパーフードの需要の増加や都市型農業の人気の高まりは、市場の大きな需要につながります。
目次
第1章 エグゼクティブサマリー
- 市場概要
第2章 市場情勢
- 市場エコシステム
- 市場の特徴
- バリューチェーン分析
第3章 市場規模の評価
- 市場の定義
- 市場セグメント分析
- 市場規模 2023
- 市場の見通し 2023-2028
第4章 市場規模実績
- 世界アロニア・ベリー市場 2018-2022
- ソース別セグメント分析 2018-2022
- 流通チャネル別セグメント分析 2018-2022
- 地域別セグメント分析 2018-2022
- 国別セグメント分析 2018-2022
第5章 ファイブフォース分析
- ファイブフォースの要約
- 買い手の交渉力
- 供給企業の交渉力
- 新規参入業者の脅威
- 代替品の脅威
- 競争の脅威
- 市況
第6章 市場セグメンテーション:ソース別
- 市場セグメンテーション
- 比較:ソース別
- 従来型:市場規模と予測 2023-2028
- オーガニック:市場規模と予測 2023-2028
- 市場機会:ソース別
第7章 市場セグメンテーション:流通チャネル別
- 市場セグメンテーション
- 比較:流通チャネル別
- オフライン:市場規模と予測 2023-2028
- オンライン:市場規模と予測 2023-2028
- 市場機会:流通チャネル別
第8章 顧客情勢
- 顧客情勢の概要
第9章 地域別情勢
- 地域別セグメンテーション
- 地域別比較
- 欧州:市場規模と予測 2023-2028
- 北米:市場規模と予測 2023-2028
- アジア太平洋:市場規模と予測 2023-2028
- 南米:市場規模と予測 2023-2028
- 中東・アフリカ:市場規模と予測 2023-2028
- 米国:市場規模と予測 2023-2028
- 英国:市場規模と予測 2023-2028
- ドイツ:市場規模と予測 2023-2028
- 中国:市場規模と予測 2023-2028
- 日本:市場規模と予測 2023-2028
- 市場機会:地域別
第10章 促進要因・課題・機会・抑制要因
- 市場促進要因
- 市場の課題
- 促進要因と課題の影響
- 市場の機会・抑制要因
第11章 競合情勢
- 概要
- 競合情勢
- 混乱の状況
- 業界のリスク
第12章 競合分析
- 企業プロファイル
- 企業の市場ポジショニング
- ArmedinaUSA
- Bio Poland sp. z o.o.
- BioActor BV
- Brownwood Acres
- Erbology
- GreenField Sp zoo Spk
- J and J Aronia BC
- Maes Health and Wellness LLC
- Microstructure sp z oo
- OPG Medic
- PowerfulBerry.com
- PPHU Bio Juice Piotr Michalak
- Sawmill Hollow
- Schade Vineyard and Winery
- TECOFOOD sp
第13章 付録
Exhibits:
- Exhibits1: Executive Summary - Chart on Market Overview
- Exhibits2: Executive Summary - Data Table on Market Overview
- Exhibits3: Executive Summary - Chart on Global Market Characteristics
- Exhibits4: Executive Summary - Chart on Market by Geography
- Exhibits5: Executive Summary - Chart on Market Segmentation by Source
- Exhibits6: Executive Summary - Chart on Market Segmentation by Distribution Channel
- Exhibits7: Executive Summary - Chart on Incremental Growth
- Exhibits8: Executive Summary - Data Table on Incremental Growth
- Exhibits9: Executive Summary - Chart on Company Market Positioning
- Exhibits10: Parent Market
- Exhibits11: Data Table on - Parent Market
- Exhibits12: Market characteristics analysis
- Exhibits13: Value Chain Analysis
- Exhibits14: Offerings of companies included in the market definition
- Exhibits15: Market segments
- Exhibits16: Chart on Global - Market size and forecast 2023-2028 ($ million)
- Exhibits17: Data Table on Global - Market size and forecast 2023-2028 ($ million)
- Exhibits18: Chart on Global Market: Year-over-year growth 2023-2028 (%)
- Exhibits19: Data Table on Global Market: Year-over-year growth 2023-2028 (%)
- Exhibits20: Historic Market Size - Data Table on Global Aronia Berries Market 2018 - 2022 ($ million)
- Exhibits21: Historic Market Size - Source Segment 2018 - 2022 ($ million)
- Exhibits22: Historic Market Size - Distribution Channel Segment 2018 - 2022 ($ million)
- Exhibits23: Historic Market Size - Geography Segment 2018 - 2022 ($ million)
- Exhibits24: Historic Market Size - Country Segment 2018 - 2022 ($ million)
- Exhibits25: Five forces analysis - Comparison between 2023 and 2028
- Exhibits26: Bargaining power of buyers - Impact of key factors 2023 and 2028
- Exhibits27: Bargaining power of suppliers - Impact of key factors in 2023 and 2028
- Exhibits28: Threat of new entrants - Impact of key factors in 2023 and 2028
- Exhibits29: Threat of substitutes - Impact of key factors in 2023 and 2028
- Exhibits30: Threat of rivalry - Impact of key factors in 2023 and 2028
- Exhibits31: Chart on Market condition - Five forces 2023 and 2028
- Exhibits32: Chart on Source - Market share 2023-2028 (%)
- Exhibits33: Data Table on Source - Market share 2023-2028 (%)
- Exhibits34: Chart on Comparison by Source
- Exhibits35: Data Table on Comparison by Source
- Exhibits36: Chart on Conventional - Market size and forecast 2023-2028 ($ million)
- Exhibits37: Data Table on Conventional - Market size and forecast 2023-2028 ($ million)
- Exhibits38: Chart on Conventional - Year-over-year growth 2023-2028 (%)
- Exhibits39: Data Table on Conventional - Year-over-year growth 2023-2028 (%)
- Exhibits40: Chart on Organic - Market size and forecast 2023-2028 ($ million)
- Exhibits41: Data Table on Organic - Market size and forecast 2023-2028 ($ million)
- Exhibits42: Chart on Organic - Year-over-year growth 2023-2028 (%)
- Exhibits43: Data Table on Organic - Year-over-year growth 2023-2028 (%)
- Exhibits44: Market opportunity by Source ($ million)
- Exhibits45: Data Table on Market opportunity by Source ($ million)
- Exhibits46: Chart on Distribution Channel - Market share 2023-2028 (%)
- Exhibits47: Data Table on Distribution Channel - Market share 2023-2028 (%)
- Exhibits48: Chart on Comparison by Distribution Channel
- Exhibits49: Data Table on Comparison by Distribution Channel
- Exhibits50: Chart on Offline - Market size and forecast 2023-2028 ($ million)
- Exhibits51: Data Table on Offline - Market size and forecast 2023-2028 ($ million)
- Exhibits52: Chart on Offline - Year-over-year growth 2023-2028 (%)
- Exhibits53: Data Table on Offline - Year-over-year growth 2023-2028 (%)
- Exhibits54: Chart on Online - Market size and forecast 2023-2028 ($ million)
- Exhibits55: Data Table on Online - Market size and forecast 2023-2028 ($ million)
- Exhibits56: Chart on Online - Year-over-year growth 2023-2028 (%)
- Exhibits57: Data Table on Online - Year-over-year growth 2023-2028 (%)
- Exhibits58: Market opportunity by Distribution Channel ($ million)
- Exhibits59: Data Table on Market opportunity by Distribution Channel ($ million)
- Exhibits60: Analysis of price sensitivity, lifecycle, customer purchase basket, adoption rates, and purchase criteria
- Exhibits61: Chart on Market share By Geographical Landscape2023-2028 (%)
- Exhibits62: Data Table on Market share By Geographical Landscape2023-2028 (%)
- Exhibits63: Chart on Geographic comparison
- Exhibits64: Data Table on Geographic comparison
- Exhibits65: Chart on Europe - Market size and forecast 2023-2028 ($ million)
- Exhibits66: Data Table on Europe - Market size and forecast 2023-2028 ($ million)
- Exhibits67: Chart on Europe - Year-over-year growth 2023-2028 (%)
- Exhibits68: Data Table on Europe - Year-over-year growth 2023-2028 (%)
- Exhibits69: Chart on North America - Market size and forecast 2023-2028 ($ million)
- Exhibits70: Data Table on North America - Market size and forecast 2023-2028 ($ million)
- Exhibits71: Chart on North America - Year-over-year growth 2023-2028 (%)
- Exhibits72: Data Table on North America - Year-over-year growth 2023-2028 (%)
- Exhibits73: Chart on APAC - Market size and forecast 2023-2028 ($ million)
- Exhibits74: Data Table on APAC - Market size and forecast 2023-2028 ($ million)
- Exhibits75: Chart on APAC - Year-over-year growth 2023-2028 (%)
- Exhibits76: Data Table on APAC - Year-over-year growth 2023-2028 (%)
- Exhibits77: Chart on South America - Market size and forecast 2023-2028 ($ million)
- Exhibits78: Data Table on South America - Market size and forecast 2023-2028 ($ million)
- Exhibits79: Chart on South America - Year-over-year growth 2023-2028 (%)
- Exhibits80: Data Table on South America - Year-over-year growth 2023-2028 (%)
- Exhibits81: Chart on Middle East and Africa - Market size and forecast 2023-2028 ($ million)
- Exhibits82: Data Table on Middle East and Africa - Market size and forecast 2023-2028 ($ million)
- Exhibits83: Chart on Middle East and Africa - Year-over-year growth 2023-2028 (%)
- Exhibits84: Data Table on Middle East and Africa - Year-over-year growth 2023-2028 (%)
- Exhibits85: Chart on US - Market size and forecast 2023-2028 ($ million)
- Exhibits86: Data Table on US - Market size and forecast 2023-2028 ($ million)
- Exhibits87: Chart on US - Year-over-year growth 2023-2028 (%)
- Exhibits88: Data Table on US - Year-over-year growth 2023-2028 (%)
- Exhibits89: Chart on UK - Market size and forecast 2023-2028 ($ million)
- Exhibits90: Data Table on UK - Market size and forecast 2023-2028 ($ million)
- Exhibits91: Chart on UK - Year-over-year growth 2023-2028 (%)
- Exhibits92: Data Table on UK - Year-over-year growth 2023-2028 (%)
- Exhibits93: Chart on Germany - Market size and forecast 2023-2028 ($ million)
- Exhibits94: Data Table on Germany - Market size and forecast 2023-2028 ($ million)
- Exhibits95: Chart on Germany - Year-over-year growth 2023-2028 (%)
- Exhibits96: Data Table on Germany - Year-over-year growth 2023-2028 (%)
- Exhibits97: Chart on China - Market size and forecast 2023-2028 ($ million)
- Exhibits98: Data Table on China - Market size and forecast 2023-2028 ($ million)
- Exhibits99: Chart on China - Year-over-year growth 2023-2028 (%)
- Exhibits100: Data Table on China - Year-over-year growth 2023-2028 (%)
- Exhibits101: Chart on Japan - Market size and forecast 2023-2028 ($ million)
- Exhibits102: Data Table on Japan - Market size and forecast 2023-2028 ($ million)
- Exhibits103: Chart on Japan - Year-over-year growth 2023-2028 (%)
- Exhibits104: Data Table on Japan - Year-over-year growth 2023-2028 (%)
- Exhibits105: Market opportunity By Geographical Landscape($ million)
- Exhibits106: Data Tables on Market opportunity By Geographical Landscape($ million)
- Exhibits107: Impact of drivers and challenges in 2023 and 2028
- Exhibits108: Overview on criticality of inputs and factors of differentiation
- Exhibits109: Overview on factors of disruption
- Exhibits110: Impact of key risks on business
- Exhibits111: Companies covered
- Exhibits112: Matrix on companies position and classification
- Exhibits113: ArmedinaUSA - Overview
- Exhibits114: ArmedinaUSA - Product / Service
- Exhibits115: ArmedinaUSA - Key offerings
- Exhibits116: Bio Poland sp. z o.o. - Overview
- Exhibits117: Bio Poland sp. z o.o. - Product / Service
- Exhibits118: Bio Poland sp. z o.o. - Key offerings
- Exhibits119: BioActor BV - Overview
- Exhibits120: BioActor BV - Product / Service
- Exhibits121: BioActor BV - Key offerings
- Exhibits122: Brownwood Acres - Overview
- Exhibits123: Brownwood Acres - Product / Service
- Exhibits124: Brownwood Acres - Key offerings
- Exhibits125: Erbology - Overview
- Exhibits126: Erbology - Product / Service
- Exhibits127: Erbology - Key offerings
- Exhibits128: GreenField Sp zoo Spk - Overview
- Exhibits129: GreenField Sp zoo Spk - Product / Service
- Exhibits130: GreenField Sp zoo Spk - Key offerings
- Exhibits131: J and J Aronia BC - Overview
- Exhibits132: J and J Aronia BC - Product / Service
- Exhibits133: J and J Aronia BC - Key offerings
- Exhibits134: Maes Health and Wellness LLC - Overview
- Exhibits135: Maes Health and Wellness LLC - Product / Service
- Exhibits136: Maes Health and Wellness LLC - Key offerings
- Exhibits137: Microstructure sp z oo - Overview
- Exhibits138: Microstructure sp z oo - Product / Service
- Exhibits139: Microstructure sp z oo - Key offerings
- Exhibits140: OPG Medic - Overview
- Exhibits141: OPG Medic - Product / Service
- Exhibits142: OPG Medic - Key offerings
- Exhibits143: PowerfulBerry.com - Overview
- Exhibits144: PowerfulBerry.com - Product / Service
- Exhibits145: PowerfulBerry.com - Key offerings
- Exhibits146: PPHU Bio Juice Piotr Michalak - Overview
- Exhibits147: PPHU Bio Juice Piotr Michalak - Product / Service
- Exhibits148: PPHU Bio Juice Piotr Michalak - Key offerings
- Exhibits149: Sawmill Hollow - Overview
- Exhibits150: Sawmill Hollow - Product / Service
- Exhibits151: Sawmill Hollow - Key offerings
- Exhibits152: Schade Vineyard and Winery - Overview
- Exhibits153: Schade Vineyard and Winery - Product / Service
- Exhibits154: Schade Vineyard and Winery - Key offerings
- Exhibits155: TECOFOOD sp - Overview
- Exhibits156: TECOFOOD sp - Product / Service
- Exhibits157: TECOFOOD sp - Key offerings
- Exhibits158: Inclusions checklist
- Exhibits159: Exclusions checklist
- Exhibits160: Currency conversion rates for US$
- Exhibits161: Research methodology
- Exhibits162: Information sources
- Exhibits163: Data validation
- Exhibits164: Validation techniques employed for market sizing
- Exhibits165: Data synthesis
- Exhibits166: 360 degree market analysis
- Exhibits167: List of abbreviations
Technavio has been monitoring the aronia berries market and is forecast to grow by USD 501.5 mn during 2023-2028, accelerating at a CAGR of 9.64% during the forecast period. Our report on the aronia berries market provides a holistic analysis, market size and forecast, trends, growth drivers, and challenges, as well as vendor analysis covering around 25 vendors.
The report offers an up-to-date analysis regarding the current market scenario, the latest trends and drivers, and the overall market environment. The market is driven by health benefits of aronia berries, rise in number of private-label brands, and rising penetration of online retailing and e-commerce.
Technavio's aronia berries market is segmented as below:
| Market Scope | |
|---|---|
| Base Year | 2024 |
| End Year | 2028 |
| Series Year | 2024-2028 |
| Growth Momentum | Accelerate |
| YOY 2024 | 8.57% |
| CAGR | 9.64% |
| Incremental Value | $501.5mn |
By Source
- Conventional
- Organic
By Distribution Channel
- Offline
- Online
By Geography
- Europe
- North America
- APAC
- South America
- Middle East and Africa
This study identifies the growing demand for plant-based beverages as one of the prime reasons driving the aronia berries market growth during the next few years. Also, increasing demand for superfoods and rising popularity of urban farming will lead to sizable demand in the market.
Technavio presents a detailed picture of the market by the way of study, synthesis, and summation of data from multiple sources by an analysis of key parameters. Our report on the aronia berries market covers the following areas:
- Aronia berries market sizing
- Aronia berries market forecast
- Aronia berries market industry analysis
Technavio's robust vendor analysis is designed to help clients improve their market position, and in line with this, this report provides a detailed analysis of several leading aronia berries market vendors that include Aronia for life, Akron Apple and Aronia Inc., Akronia Valley LLC, ArmedinaUSA, Aronia Ireland Ltd., Bio Poland sp. z o.o., BioActor BV, Brownwood Acres, Erbology, GreenField Sp zoo Spk, J and J Aronia BC, Maes Health and Wellness LLC, Microstructure sp z oo, OPG Medic, PowerfulBerry.com, PPHU Bio Juice Piotr Michalak, Rabenhorst, Sawmill Hollow, Schade Vineyard and Winery, and TECOFOOD sp. Also, the aronia berries market analysis report includes information on upcoming trends and challenges that will influence market growth. This is to help companies strategize and leverage all forthcoming growth opportunities.
The study was conducted using an objective combination of primary and secondary information including inputs from key participants in the industry. The report contains a comprehensive market and vendor landscape in addition to an analysis of the key vendors.
Technavio presents a detailed picture of the market by the way of study, synthesis, and summation of data from multiple sources by an analysis of key parameters such as profit, pricing, competition, and promotions. It presents various market facets by identifying the key industry influencers. The data presented is comprehensive, reliable, and a result of extensive research - both primary and secondary. Technavio's market research reports provide a complete competitive landscape and an in-depth vendor selection methodology and analysis using qualitative and quantitative research to forecast accurate market growth.
Table of Contents
1 Executive Summary
- 1.1 Market overview
- Executive Summary - Chart on Market Overview
- Executive Summary - Data Table on Market Overview
- Executive Summary - Chart on Global Market Characteristics
- Executive Summary - Chart on Market by Geography
- Executive Summary - Chart on Market Segmentation by Source
- Executive Summary - Chart on Market Segmentation by Distribution Channel
- Executive Summary - Chart on Incremental Growth
- Executive Summary - Data Table on Incremental Growth
- Executive Summary - Chart on Company Market Positioning
2 Market Landscape
- 2.1 Market ecosystem
- Parent Market
- Data Table on - Parent Market
- 2.2 Market characteristics
- Market characteristics analysis
- 2.3 Value chain analysis
- Value Chain Analysis
3 Market Sizing
- 3.1 Market definition
- Offerings of companies included in the market definition
- 3.2 Market segment analysis
- Market segments
- 3.3 Market size 2023
- 3.4 Market outlook: Forecast for 2023-2028
- Chart on Global - Market size and forecast 2023-2028 ($ million)
- Data Table on Global - Market size and forecast 2023-2028 ($ million)
- Chart on Global Market: Year-over-year growth 2023-2028 (%)
- Data Table on Global Market: Year-over-year growth 2023-2028 (%)
4 Historic Market Size
- 4.1 Global Aronia Berries Market 2018 - 2022
- Historic Market Size - Data Table on Global Aronia Berries Market 2018 - 2022 ($ million)
- 4.2 Source segment analysis 2018 - 2022
- Historic Market Size - Source Segment 2018 - 2022 ($ million)
- 4.3 Distribution Channel segment analysis 2018 - 2022
- Historic Market Size - Distribution Channel Segment 2018 - 2022 ($ million)
- 4.4 Geography segment analysis 2018 - 2022
- Historic Market Size - Geography Segment 2018 - 2022 ($ million)
- 4.5 Country segment analysis 2018 - 2022
- Historic Market Size - Country Segment 2018 - 2022 ($ million)
5 Five Forces Analysis
- 5.1 Five forces summary
- Five forces analysis - Comparison between 2023 and 2028
- 5.2 Bargaining power of buyers
- Bargaining power of buyers - Impact of key factors 2023 and 2028
- 5.3 Bargaining power of suppliers
- Bargaining power of suppliers - Impact of key factors in 2023 and 2028
- 5.4 Threat of new entrants
- Threat of new entrants - Impact of key factors in 2023 and 2028
- 5.5 Threat of substitutes
- Threat of substitutes - Impact of key factors in 2023 and 2028
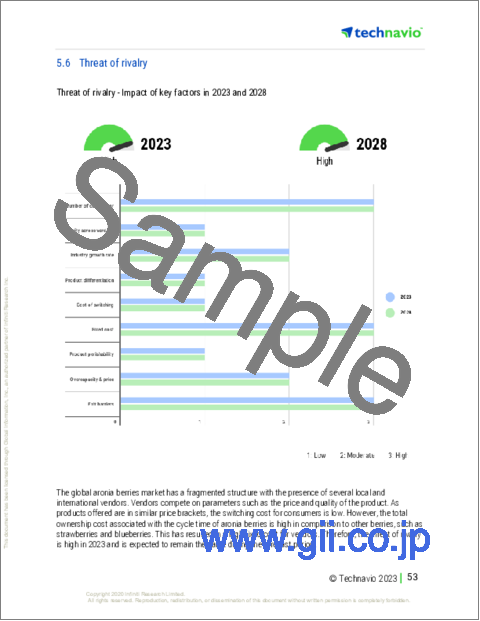
- 5.6 Threat of rivalry
- Threat of rivalry - Impact of key factors in 2023 and 2028
- 5.7 Market condition
- Chart on Market condition - Five forces 2023 and 2028
6 Market Segmentation by Source
- 6.1 Market segments
- Chart on Source - Market share 2023-2028 (%)
- Data Table on Source - Market share 2023-2028 (%)
- 6.2 Comparison by Source
- Chart on Comparison by Source
- Data Table on Comparison by Source
- 6.3 Conventional - Market size and forecast 2023-2028
- Chart on Conventional - Market size and forecast 2023-2028 ($ million)
- Data Table on Conventional - Market size and forecast 2023-2028 ($ million)
- Chart on Conventional - Year-over-year growth 2023-2028 (%)
- Data Table on Conventional - Year-over-year growth 2023-2028 (%)
- 6.4 Organic - Market size and forecast 2023-2028
- Chart on Organic - Market size and forecast 2023-2028 ($ million)
- Data Table on Organic - Market size and forecast 2023-2028 ($ million)
- Chart on Organic - Year-over-year growth 2023-2028 (%)
- Data Table on Organic - Year-over-year growth 2023-2028 (%)
- 6.5 Market opportunity by Source
- Market opportunity by Source ($ million)
- Data Table on Market opportunity by Source ($ million)
7 Market Segmentation by Distribution Channel
- 7.1 Market segments
- Chart on Distribution Channel - Market share 2023-2028 (%)
- Data Table on Distribution Channel - Market share 2023-2028 (%)
- 7.2 Comparison by Distribution Channel
- Chart on Comparison by Distribution Channel
- Data Table on Comparison by Distribution Channel
- 7.3 Offline - Market size and forecast 2023-2028
- Chart on Offline - Market size and forecast 2023-2028 ($ million)
- Data Table on Offline - Market size and forecast 2023-2028 ($ million)
- Chart on Offline - Year-over-year growth 2023-2028 (%)
- Data Table on Offline - Year-over-year growth 2023-2028 (%)
- 7.4 Online - Market size and forecast 2023-2028
- Chart on Online - Market size and forecast 2023-2028 ($ million)
- Data Table on Online - Market size and forecast 2023-2028 ($ million)
- Chart on Online - Year-over-year growth 2023-2028 (%)
- Data Table on Online - Year-over-year growth 2023-2028 (%)
- 7.5 Market opportunity by Distribution Channel
- Market opportunity by Distribution Channel ($ million)
- Data Table on Market opportunity by Distribution Channel ($ million)
8 Customer Landscape
- 8.1 Customer landscape overview
- Analysis of price sensitivity, lifecycle, customer purchase basket, adoption rates, and purchase criteria
9 Geographic Landscape
- 9.1 Geographic segmentation
- Chart on Market share By Geographical Landscape2023-2028 (%)
- Data Table on Market share By Geographical Landscape2023-2028 (%)
- 9.2 Geographic comparison
- Chart on Geographic comparison
- Data Table on Geographic comparison
- 9.3 Europe - Market size and forecast 2023-2028
- Chart on Europe - Market size and forecast 2023-2028 ($ million)
- Data Table on Europe - Market size and forecast 2023-2028 ($ million)
- Chart on Europe - Year-over-year growth 2023-2028 (%)
- Data Table on Europe - Year-over-year growth 2023-2028 (%)
- 9.4 North America - Market size and forecast 2023-2028
- Chart on North America - Market size and forecast 2023-2028 ($ million)
- Data Table on North America - Market size and forecast 2023-2028 ($ million)
- Chart on North America - Year-over-year growth 2023-2028 (%)
- Data Table on North America - Year-over-year growth 2023-2028 (%)
- 9.5 APAC - Market size and forecast 2023-2028
- Chart on APAC - Market size and forecast 2023-2028 ($ million)
- Data Table on APAC - Market size and forecast 2023-2028 ($ million)
- Chart on APAC - Year-over-year growth 2023-2028 (%)
- Data Table on APAC - Year-over-year growth 2023-2028 (%)
- 9.6 South America - Market size and forecast 2023-2028
- Chart on South America - Market size and forecast 2023-2028 ($ million)
- Data Table on South America - Market size and forecast 2023-2028 ($ million)
- Chart on South America - Year-over-year growth 2023-2028 (%)
- Data Table on South America - Year-over-year growth 2023-2028 (%)
- 9.7 Middle East and Africa - Market size and forecast 2023-2028
- Chart on Middle East and Africa - Market size and forecast 2023-2028 ($ million)
- Data Table on Middle East and Africa - Market size and forecast 2023-2028 ($ million)
- Chart on Middle East and Africa - Year-over-year growth 2023-2028 (%)
- Data Table on Middle East and Africa - Year-over-year growth 2023-2028 (%)
- 9.8 US - Market size and forecast 2023-2028
- Chart on US - Market size and forecast 2023-2028 ($ million)
- Data Table on US - Market size and forecast 2023-2028 ($ million)
- Chart on US - Year-over-year growth 2023-2028 (%)
- Data Table on US - Year-over-year growth 2023-2028 (%)
- 9.9 UK - Market size and forecast 2023-2028
- Chart on UK - Market size and forecast 2023-2028 ($ million)
- Data Table on UK - Market size and forecast 2023-2028 ($ million)
- Chart on UK - Year-over-year growth 2023-2028 (%)
- Data Table on UK - Year-over-year growth 2023-2028 (%)
- 9.10 Germany - Market size and forecast 2023-2028
- Chart on Germany - Market size and forecast 2023-2028 ($ million)
- Data Table on Germany - Market size and forecast 2023-2028 ($ million)
- Chart on Germany - Year-over-year growth 2023-2028 (%)
- Data Table on Germany - Year-over-year growth 2023-2028 (%)
- 9.11 China - Market size and forecast 2023-2028
- Chart on China - Market size and forecast 2023-2028 ($ million)
- Data Table on China - Market size and forecast 2023-2028 ($ million)
- Chart on China - Year-over-year growth 2023-2028 (%)
- Data Table on China - Year-over-year growth 2023-2028 (%)
- 9.12 Japan - Market size and forecast 2023-2028
- Chart on Japan - Market size and forecast 2023-2028 ($ million)
- Data Table on Japan - Market size and forecast 2023-2028 ($ million)
- Chart on Japan - Year-over-year growth 2023-2028 (%)
- Data Table on Japan - Year-over-year growth 2023-2028 (%)
- 9.13 Market opportunity by geography
- Market opportunity By Geographical Landscape($ million)
- Data Tables on Market opportunity By Geographical Landscape($ million)
10 Drivers, Challenges, and Opportunity/Restraints
- 10.1 Market drivers
- 10.2 Market challenges
- 10.3 Impact of drivers and challenges
- Impact of drivers and challenges in 2023 and 2028
- 10.4 Market opportunities/restraints
11 Competitive Landscape
- 11.1 Overview
- 11.2 Competitive Landscape
- Overview on criticality of inputs and factors of differentiation
- 11.3 Landscape disruption
- Overview on factors of disruption
- 11.4 Industry risks
- Impact of key risks on business
12 Competitive Analysis
- 12.1 Companies profiled
- Companies covered
- 12.2 Market positioning of companies
- Matrix on companies position and classification
- 12.3 ArmedinaUSA
- ArmedinaUSA - Overview
- ArmedinaUSA - Product / Service
- ArmedinaUSA - Key offerings
- 12.4 Bio Poland sp. z o.o.
- Bio Poland sp. z o.o. - Overview
- Bio Poland sp. z o.o. - Product / Service
- Bio Poland sp. z o.o. - Key offerings
- 12.5 BioActor BV
- BioActor BV - Overview
- BioActor BV - Product / Service
- BioActor BV - Key offerings
- 12.6 Brownwood Acres
- Brownwood Acres - Overview
- Brownwood Acres - Product / Service
- Brownwood Acres - Key offerings
- 12.7 Erbology
- Erbology - Overview
- Erbology - Product / Service
- Erbology - Key offerings
- 12.8 GreenField Sp zoo Spk
- GreenField Sp zoo Spk - Overview
- GreenField Sp zoo Spk - Product / Service
- GreenField Sp zoo Spk - Key offerings
- 12.9 J and J Aronia BC
- J and J Aronia BC - Overview
- J and J Aronia BC - Product / Service
- J and J Aronia BC - Key offerings
- 12.10 Maes Health and Wellness LLC
- Maes Health and Wellness LLC - Overview
- Maes Health and Wellness LLC - Product / Service
- Maes Health and Wellness LLC - Key offerings
- 12.11 Microstructure sp z oo
- Microstructure sp z oo - Overview
- Microstructure sp z oo - Product / Service
- Microstructure sp z oo - Key offerings
- 12.12 OPG Medic
- OPG Medic - Overview
- OPG Medic - Product / Service
- OPG Medic - Key offerings
- 12.13 PowerfulBerry.com
- PowerfulBerry.com - Overview
- PowerfulBerry.com - Product / Service
- PowerfulBerry.com - Key offerings
- 12.14 PPHU Bio Juice Piotr Michalak
- PPHU Bio Juice Piotr Michalak - Overview
- PPHU Bio Juice Piotr Michalak - Product / Service
- PPHU Bio Juice Piotr Michalak - Key offerings
- 12.15 Sawmill Hollow
- Sawmill Hollow - Overview
- Sawmill Hollow - Product / Service
- Sawmill Hollow - Key offerings
- 12.16 Schade Vineyard and Winery
- Schade Vineyard and Winery - Overview
- Schade Vineyard and Winery - Product / Service
- Schade Vineyard and Winery - Key offerings
- 12.17 TECOFOOD sp
- TECOFOOD sp - Overview
- TECOFOOD sp - Product / Service
- TECOFOOD sp - Key offerings
13 Appendix
- 13.1 Scope of the report
- 13.2 Inclusions and exclusions checklist
- Inclusions checklist
- Exclusions checklist
- 13.3 Currency conversion rates for US$
- Currency conversion rates for US$
- 13.4 Research methodology
- Research methodology
- 13.5 Data procurement
- Information sources
- 13.6 Data validation
- Data validation
- 13.7 Validation techniques employed for market sizing
- Validation techniques employed for market sizing
- 13.8 Data synthesis
- Data synthesis
- 13.9 360 degree market analysis
- 360 degree market analysis
- 13.10 List of abbreviations
- List of abbreviations

