|
|
市場調査レポート
商品コード
1559294
航空機用ブレーキシステムの世界市場、2024~2028年Global Aircraft Braking Systems Market 2024-2028 |
||||||
|
|||||||
カスタマイズ可能
|
|||||||

| 航空機用ブレーキシステムの世界市場、2024~2028年 |
|
出版日: 2024年08月16日
発行: TechNavio
ページ情報: 英文 174 Pages
納期: 即納可能
|

全表示
- 概要
- 図表
- 目次
航空機用ブレーキシステム市場、2024~2028年
航空機用ブレーキシステム市場は2023~2028年に19億5,710万米ドル、予測期間中のCAGRは8.09%で成長すると予測されます。この調査レポートは、航空機用ブレーキシステム市場の全体分析、市場規模・予測、動向、成長促進要因、課題、約25のベンダーを網羅したベンダー分析などを掲載しています。
現在の市場シナリオ、最新動向と促進要因、市場環境全体に関する最新分析を提供しています。民間航空機や一般航空機の需要拡大、航空機納入数の増加、スマートセンサー技術の採用などが市場を牽引しています。
| 市場範囲 | |
|---|---|
| 基準年 | 2024年 |
| 終了年 | 2028年 |
| 予測期間 | 2024~2028年 |
| 成長モメンタム | 加速 |
| 前年比[2024年] | 7.32% |
| CAGR | 8.09% |
| 増分額 | 19億5,710万米ドル |
本調査では、電動ブレーキシステムの市場開拓が今後数年間の航空機用ブレーキシステム市場成長を牽引する主要因の1つであるとしています。また、民間航空機のアップグレードを促す民間空域の近代化プログラムにより、新技術が台頭し、市場の大きな需要につながります。
目次
第1章 エグゼクティブサマリー
- 市場概要
第2章 市場情勢
- 市場エコシステム
- 市場の特徴
- バリューチェーン分析
第3章 市場規模の評価
- 市場の定義
- 市場セグメント分析
- 市場規模 2023年
- 市場の展望 2023~2028年
第4章 市場規模実績
- 航空機用ブレーキシステムの世界市場 2018~2022年
- 用途別セグメント分析 2018~2022年
- 部品セグメント分析 2018~2022年
- 地域別セグメント分析 2018~2022年
- 国別セグメント分析 2018~2022年
第5章 ファイブフォース分析
- ファイブフォースの要約
- 買い手の交渉力
- 供給企業の交渉力
- 新規参入業者の脅威
- 代替品の脅威
- 競争の脅威
- 市況
第6章 市場セグメンテーション:用途別
- 市場セグメンテーション
- 比較:用途別
- 商用航空:市場規模と予測 2023~2028年
- 軍事航空:市場規模と予測 2023~2028年
- 一般航空:市場規模と予測 2023~2028年
- 市場機会:用途別
第7章 市場セグメンテーション:コンポーネント別
- 市場セグメンテーション
- 比較:コンポーネント別
- パワーブレーキ:市場規模と予測 2023~2028年
- 独立ブレーキ:市場規模と予測 2023~2028年
- ブーストブレーキ:市場規模と予測 2023~2028年
- 市場機会:コンポーネント別
第8章 顧客情勢
- 顧客情勢概要
第9章 地域別情勢
- 地域別セグメンテーション
- 比較:地域別
- 北米:市場規模と予測 2023~2028年
- アジア太平洋:市場規模と予測 2023~2028年
- 欧州:市場規模と予測 2023~2028年
- 南米:市場規模と予測 2023~2028年
- 中東・アフリカ:市場規模と予測 2023~2028年
- 米国:市場規模と予測 2023~2028年
- 中国:市場規模と予測 2023~2028年
- フランス:市場規模と予測 2023~2028年
- 英国:市場規模と予測 2023~2028年
- ドイツ:市場規模と予測 2023~2028年
- 市場機会:地域情勢別
第10章 促進要因・課題・機会・抑制要因
- 市場促進要因
- 市場課題
- 促進要因と課題の影響
- 市場の機会・抑制要因
第11章 競合情勢
- 概要
- 競合情勢
- 混乱の状況
- 業界のリスク
第12章 競合分析
- 企業プロファイル
- 企業の市場ポジショニング
- Advent Aircraft Systems Inc.
- Aviation Products Systems Inc.
- BERINGER AERO
- Crane Holdings Co.
- GOLDfren USA
- Grove Aircraft Landing Gear Systems Inc.
- Honeywell International Inc.
- Jay Em Aerospace Inc.
- Matco Aircraft Landing Systems
- McFarlane Aviation Inc.
- Meggitt Plc
- Parker Hannifin Corp.
- RAPCO Inc.
- RTX Corp.
- Safran SA
第13章 付録
Exhibits:
- Exhibits1: Executive Summary - Chart on Market Overview
- Exhibits2: Executive Summary - Data Table on Market Overview
- Exhibits3: Executive Summary - Chart on Global Market Characteristics
- Exhibits4: Executive Summary - Chart on Market By Geographical Landscape
- Exhibits5: Executive Summary - Chart on Market Segmentation by Application
- Exhibits6: Executive Summary - Chart on Market Segmentation by Component
- Exhibits7: Executive Summary - Chart on Incremental Growth
- Exhibits8: Executive Summary - Data Table on Incremental Growth
- Exhibits9: Executive Summary - Chart on Company Market Positioning
- Exhibits10: Parent Market
- Exhibits11: Data Table on - Parent Market
- Exhibits12: Market characteristics analysis
- Exhibits13: Value Chain Analysis
- Exhibits14: Offerings of companies included in the market definition
- Exhibits15: Market segments
- Exhibits16: Chart on Global - Market size and forecast 2023-2028 ($ million)
- Exhibits17: Data Table on Global - Market size and forecast 2023-2028 ($ million)
- Exhibits18: Chart on Global Market: Year-over-year growth 2023-2028 (%)
- Exhibits19: Data Table on Global Market: Year-over-year growth 2023-2028 (%)
- Exhibits20: Historic Market Size - Data Table on Global Aircraft Braking Systems Market 2018 - 2022 ($ million)
- Exhibits21: Historic Market Size - Application Segment 2018 - 2022 ($ million)
- Exhibits22: Historic Market Size - Component Segment 2018 - 2022 ($ million)
- Exhibits23: Historic Market Size - Geography Segment 2018 - 2022 ($ million)
- Exhibits24: Historic Market Size - Country Segment 2018 - 2022 ($ million)
- Exhibits25: Five forces analysis - Comparison between 2023 and 2028
- Exhibits26: Bargaining power of buyers - Impact of key factors 2023 and 2028
- Exhibits27: Bargaining power of suppliers - Impact of key factors in 2023 and 2028
- Exhibits28: Threat of new entrants - Impact of key factors in 2023 and 2028
- Exhibits29: Threat of substitutes - Impact of key factors in 2023 and 2028
- Exhibits30: Threat of rivalry - Impact of key factors in 2023 and 2028
- Exhibits31: Chart on Market condition - Five forces 2023 and 2028
- Exhibits32: Chart on Application - Market share 2023-2028 (%)
- Exhibits33: Data Table on Application - Market share 2023-2028 (%)
- Exhibits34: Chart on Comparison by Application
- Exhibits35: Data Table on Comparison by Application
- Exhibits36: Chart on Commercial aviation - Market size and forecast 2023-2028 ($ million)
- Exhibits37: Data Table on Commercial aviation - Market size and forecast 2023-2028 ($ million)
- Exhibits38: Chart on Commercial aviation - Year-over-year growth 2023-2028 (%)
- Exhibits39: Data Table on Commercial aviation - Year-over-year growth 2023-2028 (%)
- Exhibits40: Chart on Military aviation - Market size and forecast 2023-2028 ($ million)
- Exhibits41: Data Table on Military aviation - Market size and forecast 2023-2028 ($ million)
- Exhibits42: Chart on Military aviation - Year-over-year growth 2023-2028 (%)
- Exhibits43: Data Table on Military aviation - Year-over-year growth 2023-2028 (%)
- Exhibits44: Chart on General aviation - Market size and forecast 2023-2028 ($ million)
- Exhibits45: Data Table on General aviation - Market size and forecast 2023-2028 ($ million)
- Exhibits46: Chart on General aviation - Year-over-year growth 2023-2028 (%)
- Exhibits47: Data Table on General aviation - Year-over-year growth 2023-2028 (%)
- Exhibits48: Market opportunity by Application ($ million)
- Exhibits49: Data Table on Market opportunity by Application ($ million)
- Exhibits50: Chart on Component - Market share 2023-2028 (%)
- Exhibits51: Data Table on Component - Market share 2023-2028 (%)
- Exhibits52: Chart on Comparison by Component
- Exhibits53: Data Table on Comparison by Component
- Exhibits54: Chart on Power brake - Market size and forecast 2023-2028 ($ million)
- Exhibits55: Data Table on Power brake - Market size and forecast 2023-2028 ($ million)
- Exhibits56: Chart on Power brake - Year-over-year growth 2023-2028 (%)
- Exhibits57: Data Table on Power brake - Year-over-year growth 2023-2028 (%)
- Exhibits58: Chart on Independent brake - Market size and forecast 2023-2028 ($ million)
- Exhibits59: Data Table on Independent brake - Market size and forecast 2023-2028 ($ million)
- Exhibits60: Chart on Independent brake - Year-over-year growth 2023-2028 (%)
- Exhibits61: Data Table on Independent brake - Year-over-year growth 2023-2028 (%)
- Exhibits62: Chart on Boosted brake - Market size and forecast 2023-2028 ($ million)
- Exhibits63: Data Table on Boosted brake - Market size and forecast 2023-2028 ($ million)
- Exhibits64: Chart on Boosted brake - Year-over-year growth 2023-2028 (%)
- Exhibits65: Data Table on Boosted brake - Year-over-year growth 2023-2028 (%)
- Exhibits66: Market opportunity by Component ($ million)
- Exhibits67: Data Table on Market opportunity by Component ($ million)
- Exhibits68: Analysis of price sensitivity, lifecycle, customer purchase basket, adoption rates, and purchase criteria
- Exhibits69: Chart on Market share By Geographical Landscape 2023-2028 (%)
- Exhibits70: Data Table on Market share By Geographical Landscape 2023-2028 (%)
- Exhibits71: Chart on Geographic comparison
- Exhibits72: Data Table on Geographic comparison
- Exhibits73: Chart on North America - Market size and forecast 2023-2028 ($ million)
- Exhibits74: Data Table on North America - Market size and forecast 2023-2028 ($ million)
- Exhibits75: Chart on North America - Year-over-year growth 2023-2028 (%)
- Exhibits76: Data Table on North America - Year-over-year growth 2023-2028 (%)
- Exhibits77: Chart on APAC - Market size and forecast 2023-2028 ($ million)
- Exhibits78: Data Table on APAC - Market size and forecast 2023-2028 ($ million)
- Exhibits79: Chart on APAC - Year-over-year growth 2023-2028 (%)
- Exhibits80: Data Table on APAC - Year-over-year growth 2023-2028 (%)
- Exhibits81: Chart on Europe - Market size and forecast 2023-2028 ($ million)
- Exhibits82: Data Table on Europe - Market size and forecast 2023-2028 ($ million)
- Exhibits83: Chart on Europe - Year-over-year growth 2023-2028 (%)
- Exhibits84: Data Table on Europe - Year-over-year growth 2023-2028 (%)
- Exhibits85: Chart on South America - Market size and forecast 2023-2028 ($ million)
- Exhibits86: Data Table on South America - Market size and forecast 2023-2028 ($ million)
- Exhibits87: Chart on South America - Year-over-year growth 2023-2028 (%)
- Exhibits88: Data Table on South America - Year-over-year growth 2023-2028 (%)
- Exhibits89: Chart on Middle East and Africa - Market size and forecast 2023-2028 ($ million)
- Exhibits90: Data Table on Middle East and Africa - Market size and forecast 2023-2028 ($ million)
- Exhibits91: Chart on Middle East and Africa - Year-over-year growth 2023-2028 (%)
- Exhibits92: Data Table on Middle East and Africa - Year-over-year growth 2023-2028 (%)
- Exhibits93: Chart on US - Market size and forecast 2023-2028 ($ million)
- Exhibits94: Data Table on US - Market size and forecast 2023-2028 ($ million)
- Exhibits95: Chart on US - Year-over-year growth 2023-2028 (%)
- Exhibits96: Data Table on US - Year-over-year growth 2023-2028 (%)
- Exhibits97: Chart on China - Market size and forecast 2023-2028 ($ million)
- Exhibits98: Data Table on China - Market size and forecast 2023-2028 ($ million)
- Exhibits99: Chart on China - Year-over-year growth 2023-2028 (%)
- Exhibits100: Data Table on China - Year-over-year growth 2023-2028 (%)
- Exhibits101: Chart on France - Market size and forecast 2023-2028 ($ million)
- Exhibits102: Data Table on France - Market size and forecast 2023-2028 ($ million)
- Exhibits103: Chart on France - Year-over-year growth 2023-2028 (%)
- Exhibits104: Data Table on France - Year-over-year growth 2023-2028 (%)
- Exhibits105: Chart on UK - Market size and forecast 2023-2028 ($ million)
- Exhibits106: Data Table on UK - Market size and forecast 2023-2028 ($ million)
- Exhibits107: Chart on UK - Year-over-year growth 2023-2028 (%)
- Exhibits108: Data Table on UK - Year-over-year growth 2023-2028 (%)
- Exhibits109: Chart on Germany - Market size and forecast 2023-2028 ($ million)
- Exhibits110: Data Table on Germany - Market size and forecast 2023-2028 ($ million)
- Exhibits111: Chart on Germany - Year-over-year growth 2023-2028 (%)
- Exhibits112: Data Table on Germany - Year-over-year growth 2023-2028 (%)
- Exhibits113: Market opportunity By Geographical Landscape ($ million)
- Exhibits114: Data Tables on Market opportunity By Geographical Landscape ($ million)
- Exhibits115: Impact of drivers and challenges in 2023 and 2028
- Exhibits116: Overview on criticality of inputs and factors of differentiation
- Exhibits117: Overview on factors of disruption
- Exhibits118: Impact of key risks on business
- Exhibits119: Companies covered
- Exhibits120: Matrix on companies position and classification
- Exhibits121: Advent Aircraft Systems Inc. - Overview
- Exhibits122: Advent Aircraft Systems Inc. - Product / Service
- Exhibits123: Advent Aircraft Systems Inc. - Key offerings
- Exhibits124: Aviation Products Systems Inc. - Overview
- Exhibits125: Aviation Products Systems Inc. - Product / Service
- Exhibits126: Aviation Products Systems Inc. - Key offerings
- Exhibits127: BERINGER AERO - Overview
- Exhibits128: BERINGER AERO - Product / Service
- Exhibits129: BERINGER AERO - Key offerings
- Exhibits130: Crane Holdings Co. - Overview
- Exhibits131: Crane Holdings Co. - Business segments
- Exhibits132: Crane Holdings Co. - Key news
- Exhibits133: Crane Holdings Co. - Key offerings
- Exhibits134: Crane Holdings Co. - Segment focus
- Exhibits135: GOLDfren USA - Overview
- Exhibits136: GOLDfren USA - Product / Service
- Exhibits137: GOLDfren USA - Key offerings
- Exhibits138: Grove Aircraft Landing Gear Systems Inc. - Overview
- Exhibits139: Grove Aircraft Landing Gear Systems Inc. - Product / Service
- Exhibits140: Grove Aircraft Landing Gear Systems Inc. - Key offerings
- Exhibits141: Honeywell International Inc. - Overview
- Exhibits142: Honeywell International Inc. - Business segments
- Exhibits143: Honeywell International Inc. - Key news
- Exhibits144: Honeywell International Inc. - Key offerings
- Exhibits145: Honeywell International Inc. - Segment focus
- Exhibits146: Jay Em Aerospace Inc. - Overview
- Exhibits147: Jay Em Aerospace Inc. - Product / Service
- Exhibits148: Jay Em Aerospace Inc. - Key offerings
- Exhibits149: Matco Aircraft Landing Systems - Overview
- Exhibits150: Matco Aircraft Landing Systems - Product / Service
- Exhibits151: Matco Aircraft Landing Systems - Key offerings
- Exhibits152: McFarlane Aviation Inc. - Overview
- Exhibits153: McFarlane Aviation Inc. - Product / Service
- Exhibits154: McFarlane Aviation Inc. - Key offerings
- Exhibits155: Meggitt Plc - Overview
- Exhibits156: Meggitt Plc - Business segments
- Exhibits157: Meggitt Plc - Key offerings
- Exhibits158: Meggitt Plc - Segment focus
- Exhibits159: Parker Hannifin Corp. - Overview
- Exhibits160: Parker Hannifin Corp. - Business segments
- Exhibits161: Parker Hannifin Corp. - Key news
- Exhibits162: Parker Hannifin Corp. - Key offerings
- Exhibits163: Parker Hannifin Corp. - Segment focus
- Exhibits164: RAPCO Inc. - Overview
- Exhibits165: RAPCO Inc. - Product / Service
- Exhibits166: RAPCO Inc. - Key offerings
- Exhibits167: RTX Corp. - Overview
- Exhibits168: RTX Corp. - Business segments
- Exhibits169: RTX Corp. - Key news
- Exhibits170: RTX Corp. - Key offerings
- Exhibits171: RTX Corp. - Segment focus
- Exhibits172: Safran SA - Overview
- Exhibits173: Safran SA - Business segments
- Exhibits174: Safran SA - Key news
- Exhibits175: Safran SA - Key offerings
- Exhibits176: Safran SA - Segment focus
- Exhibits177: Inclusions checklist
- Exhibits178: Exclusions checklist
- Exhibits179: Currency conversion rates for US$
- Exhibits180: Research methodology
- Exhibits181: Information sources
- Exhibits182: Data validation
- Exhibits183: Validation techniques employed for market sizing
- Exhibits184: Data synthesis
- Exhibits185: 360 degree market analysis
- Exhibits186: List of abbreviations
Aircraft Braking Systems Market 2024-2028
The aircraft braking systems market is forecasted to grow by USD 1957.1 mn during 2023-2028, accelerating at a CAGR of 8.09% during the forecast period. The report on the aircraft braking systems market provides a holistic analysis, market size and forecast, trends, growth drivers, and challenges, as well as vendor analysis covering around 25 vendors.
The report offers an up-to-date analysis regarding the current market scenario, the latest trends and drivers, and the overall market environment. The market is driven by growing demand for commercial and general aircraft, increase in aircraft deliveries, and adoption of smart sensor technologies.
| Market Scope | |
|---|---|
| Base Year | 2024 |
| End Year | 2028 |
| Series Year | 2024-2028 |
| Growth Momentum | Accelerate |
| YOY 2024 | 7.32% |
| CAGR | 8.09% |
| Incremental Value | $1957.1 mn |
Technavio's aircraft braking systems market is segmented as below:
By Application
- Commercial aviation
- Military aviation
- General aviation
By Component
- Power brake
- Independent brake
- Boosted brake
By Geographical Landscape
- North America
- APAC
- Europe
- South America
- Middle East and Africa
This study identifies the development of electric brake systems as one of the prime reasons driving the aircraft braking systems market growth during the next few years. Also, new technologies gaining ground and modernization programs for commercial airspace prompting upgrades of commercial aircraft will lead to sizable demand in the market.
The report on the aircraft braking systems market covers the following areas:
- Aircraft braking systems market sizing
- Aircraft braking systems market forecast
- Aircraft braking systems market industry analysis
The vendor analysis is designed to help clients improve their market position, and in line with this, this report provides a detailed analysis of several leading aircraft braking systems market vendors that include Advent Aircraft Systems Inc., Aviation Products Systems Inc., BERINGER AERO, Crane Holdings Co., GOLDfren USA, Grove Aircraft Landing Gear Systems Inc., Honeywell International Inc., Jay Em Aerospace Inc., Matco Aircraft Landing Systems, McFarlane Aviation Inc., Meggitt PLC, NMG Aerospace, Moog Inc., Parker Hannifin Corp., RAPCO Inc., RTX Corp., Safran SA, Sonex LLC, Tactair Fluid Controls Inc., and The Carlyle Johnson Machine Co. LLC. Also, the aircraft braking systems market analysis report includes information on upcoming trends and challenges that will influence market growth. This is to help companies strategize and leverage all forthcoming growth opportunities.
The study was conducted using an objective combination of primary and secondary information including inputs from key participants in the industry. The report contains a comprehensive market and vendor landscape in addition to an analysis of the key vendors.
The company presents a detailed picture of the market by the way of study, synthesis, and summation of data from multiple sources by an analysis of key parameters such as profit, pricing, competition, and promotions. It presents various market facets by identifying the key industry influencers. The data presented is comprehensive, reliable, and a result of extensive research - both primary and secondary. The market research reports provide a complete competitive landscape and an in-depth vendor selection methodology and analysis using qualitative and quantitative research to forecast the accurate market growth.
Table of Contents
1 Executive Summary
- 1.1 Market overview
- Executive Summary - Chart on Market Overview
- Executive Summary - Data Table on Market Overview
- Executive Summary - Chart on Global Market Characteristics
- Executive Summary - Chart on Market By Geographical Landscape
- Executive Summary - Chart on Market Segmentation by Application
- Executive Summary - Chart on Market Segmentation by Component
- Executive Summary - Chart on Incremental Growth
- Executive Summary - Data Table on Incremental Growth
- Executive Summary - Chart on Company Market Positioning
2 Market Landscape
- 2.1 Market ecosystem
- Parent Market
- Data Table on - Parent Market
- 2.2 Market characteristics
- Market characteristics analysis
- 2.3 Value chain analysis
- Value Chain Analysis
3 Market Sizing
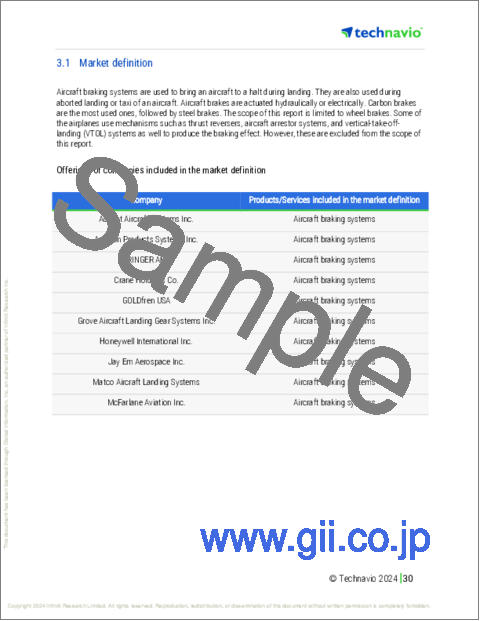
- 3.1 Market definition
- Offerings of companies included in the market definition
- 3.2 Market segment analysis
- Market segments
- 3.3 Market size 2023
- 3.4 Market outlook: Forecast for 2023-2028
- Chart on Global - Market size and forecast 2023-2028 ($ million)
- Data Table on Global - Market size and forecast 2023-2028 ($ million)
- Chart on Global Market: Year-over-year growth 2023-2028 (%)
- Data Table on Global Market: Year-over-year growth 2023-2028 (%)
4 Historic Market Size
- 4.1 Global Aircraft Braking Systems Market 2018 - 2022
- Historic Market Size - Data Table on Global Aircraft Braking Systems Market 2018 - 2022 ($ million)
- 4.2 Application segment analysis 2018 - 2022
- Historic Market Size - Application Segment 2018 - 2022 ($ million)
- 4.3 Component segment analysis 2018 - 2022
- Historic Market Size - Component Segment 2018 - 2022 ($ million)
- 4.4 Geography segment analysis 2018 - 2022
- Historic Market Size - Geography Segment 2018 - 2022 ($ million)
- 4.5 Country segment analysis 2018 - 2022
- Historic Market Size - Country Segment 2018 - 2022 ($ million)
5 Five Forces Analysis
- 5.1 Five forces summary
- Five forces analysis - Comparison between 2023 and 2028
- 5.2 Bargaining power of buyers
- Bargaining power of buyers - Impact of key factors 2023 and 2028
- 5.3 Bargaining power of suppliers
- Bargaining power of suppliers - Impact of key factors in 2023 and 2028
- 5.4 Threat of new entrants
- Threat of new entrants - Impact of key factors in 2023 and 2028
- 5.5 Threat of substitutes
- Threat of substitutes - Impact of key factors in 2023 and 2028
- 5.6 Threat of rivalry
- Threat of rivalry - Impact of key factors in 2023 and 2028
- 5.7 Market condition
- Chart on Market condition - Five forces 2023 and 2028
6 Market Segmentation by Application
- 6.1 Market segments
- Chart on Application - Market share 2023-2028 (%)
- Data Table on Application - Market share 2023-2028 (%)
- 6.2 Comparison by Application
- Chart on Comparison by Application
- Data Table on Comparison by Application
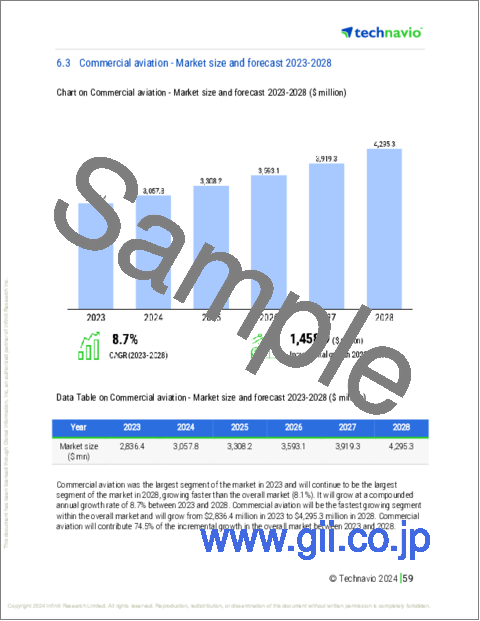
- 6.3 Commercial aviation - Market size and forecast 2023-2028
- Chart on Commercial aviation - Market size and forecast 2023-2028 ($ million)
- Data Table on Commercial aviation - Market size and forecast 2023-2028 ($ million)
- Chart on Commercial aviation - Year-over-year growth 2023-2028 (%)
- Data Table on Commercial aviation - Year-over-year growth 2023-2028 (%)
- 6.4 Military aviation - Market size and forecast 2023-2028
- Chart on Military aviation - Market size and forecast 2023-2028 ($ million)
- Data Table on Military aviation - Market size and forecast 2023-2028 ($ million)
- Chart on Military aviation - Year-over-year growth 2023-2028 (%)
- Data Table on Military aviation - Year-over-year growth 2023-2028 (%)
- 6.5 General aviation - Market size and forecast 2023-2028
- Chart on General aviation - Market size and forecast 2023-2028 ($ million)
- Data Table on General aviation - Market size and forecast 2023-2028 ($ million)
- Chart on General aviation - Year-over-year growth 2023-2028 (%)
- Data Table on General aviation - Year-over-year growth 2023-2028 (%)
- 6.6 Market opportunity by Application
- Market opportunity by Application ($ million)
- Data Table on Market opportunity by Application ($ million)
7 Market Segmentation by Component
- 7.1 Market segments
- Chart on Component - Market share 2023-2028 (%)
- Data Table on Component - Market share 2023-2028 (%)
- 7.2 Comparison by Component
- Chart on Comparison by Component
- Data Table on Comparison by Component
- 7.3 Power brake - Market size and forecast 2023-2028
- Chart on Power brake - Market size and forecast 2023-2028 ($ million)
- Data Table on Power brake - Market size and forecast 2023-2028 ($ million)
- Chart on Power brake - Year-over-year growth 2023-2028 (%)
- Data Table on Power brake - Year-over-year growth 2023-2028 (%)
- 7.4 Independent brake - Market size and forecast 2023-2028
- Chart on Independent brake - Market size and forecast 2023-2028 ($ million)
- Data Table on Independent brake - Market size and forecast 2023-2028 ($ million)
- Chart on Independent brake - Year-over-year growth 2023-2028 (%)
- Data Table on Independent brake - Year-over-year growth 2023-2028 (%)
- 7.5 Boosted brake - Market size and forecast 2023-2028
- Chart on Boosted brake - Market size and forecast 2023-2028 ($ million)
- Data Table on Boosted brake - Market size and forecast 2023-2028 ($ million)
- Chart on Boosted brake - Year-over-year growth 2023-2028 (%)
- Data Table on Boosted brake - Year-over-year growth 2023-2028 (%)
- 7.6 Market opportunity by Component
- Market opportunity by Component ($ million)
- Data Table on Market opportunity by Component ($ million)
8 Customer Landscape
- 8.1 Customer landscape overview
- Analysis of price sensitivity, lifecycle, customer purchase basket, adoption rates, and purchase criteria
9 Geographic Landscape
- 9.1 Geographic segmentation
- Chart on Market share By Geographical Landscape 2023-2028 (%)
- Data Table on Market share By Geographical Landscape 2023-2028 (%)
- 9.2 Geographic comparison
- Chart on Geographic comparison
- Data Table on Geographic comparison
- 9.3 North America - Market size and forecast 2023-2028
- Chart on North America - Market size and forecast 2023-2028 ($ million)
- Data Table on North America - Market size and forecast 2023-2028 ($ million)
- Chart on North America - Year-over-year growth 2023-2028 (%)
- Data Table on North America - Year-over-year growth 2023-2028 (%)
- 9.4 APAC - Market size and forecast 2023-2028
- Chart on APAC - Market size and forecast 2023-2028 ($ million)
- Data Table on APAC - Market size and forecast 2023-2028 ($ million)
- Chart on APAC - Year-over-year growth 2023-2028 (%)
- Data Table on APAC - Year-over-year growth 2023-2028 (%)
- 9.5 Europe - Market size and forecast 2023-2028
- Chart on Europe - Market size and forecast 2023-2028 ($ million)
- Data Table on Europe - Market size and forecast 2023-2028 ($ million)
- Chart on Europe - Year-over-year growth 2023-2028 (%)
- Data Table on Europe - Year-over-year growth 2023-2028 (%)
- 9.6 South America - Market size and forecast 2023-2028
- Chart on South America - Market size and forecast 2023-2028 ($ million)
- Data Table on South America - Market size and forecast 2023-2028 ($ million)
- Chart on South America - Year-over-year growth 2023-2028 (%)
- Data Table on South America - Year-over-year growth 2023-2028 (%)
- 9.7 Middle East and Africa - Market size and forecast 2023-2028
- Chart on Middle East and Africa - Market size and forecast 2023-2028 ($ million)
- Data Table on Middle East and Africa - Market size and forecast 2023-2028 ($ million)
- Chart on Middle East and Africa - Year-over-year growth 2023-2028 (%)
- Data Table on Middle East and Africa - Year-over-year growth 2023-2028 (%)
- 9.8 US - Market size and forecast 2023-2028
- Chart on US - Market size and forecast 2023-2028 ($ million)
- Data Table on US - Market size and forecast 2023-2028 ($ million)
- Chart on US - Year-over-year growth 2023-2028 (%)
- Data Table on US - Year-over-year growth 2023-2028 (%)
- 9.9 China - Market size and forecast 2023-2028
- Chart on China - Market size and forecast 2023-2028 ($ million)
- Data Table on China - Market size and forecast 2023-2028 ($ million)
- Chart on China - Year-over-year growth 2023-2028 (%)
- Data Table on China - Year-over-year growth 2023-2028 (%)
- 9.10 France - Market size and forecast 2023-2028
- Chart on France - Market size and forecast 2023-2028 ($ million)
- Data Table on France - Market size and forecast 2023-2028 ($ million)
- Chart on France - Year-over-year growth 2023-2028 (%)
- Data Table on France - Year-over-year growth 2023-2028 (%)
- 9.11 UK - Market size and forecast 2023-2028
- Chart on UK - Market size and forecast 2023-2028 ($ million)
- Data Table on UK - Market size and forecast 2023-2028 ($ million)
- Chart on UK - Year-over-year growth 2023-2028 (%)
- Data Table on UK - Year-over-year growth 2023-2028 (%)
- 9.12 Germany - Market size and forecast 2023-2028
- Chart on Germany - Market size and forecast 2023-2028 ($ million)
- Data Table on Germany - Market size and forecast 2023-2028 ($ million)
- Chart on Germany - Year-over-year growth 2023-2028 (%)
- Data Table on Germany - Year-over-year growth 2023-2028 (%)
- 9.13 Market opportunity By Geographical Landscape
- Market opportunity By Geographical Landscape ($ million)
- Data Tables on Market opportunity By Geographical Landscape ($ million)
10 Drivers, Challenges, and Opportunity/Restraints
- 10.1 Market drivers
- 10.2 Market challenges
- 10.3 Impact of drivers and challenges
- Impact of drivers and challenges in 2023 and 2028
- 10.4 Market opportunities/restraints
11 Competitive Landscape
- 11.1 Overview
- 11.2 Competitive Landscape
- Overview on criticality of inputs and factors of differentiation
- 11.3 Landscape disruption
- Overview on factors of disruption
- 11.4 Industry risks
- Impact of key risks on business
12 Competitive Analysis
- 12.1 Companies profiled
- Companies covered
- 12.2 Market positioning of companies
- Matrix on companies position and classification
- 12.3 Advent Aircraft Systems Inc.
- Advent Aircraft Systems Inc. - Overview
- Advent Aircraft Systems Inc. - Product / Service
- Advent Aircraft Systems Inc. - Key offerings
- 12.4 Aviation Products Systems Inc.
- Aviation Products Systems Inc. - Overview
- Aviation Products Systems Inc. - Product / Service
- Aviation Products Systems Inc. - Key offerings
- 12.5 BERINGER AERO
- BERINGER AERO - Overview
- BERINGER AERO - Product / Service
- BERINGER AERO - Key offerings
- 12.6 Crane Holdings Co.
- Crane Holdings Co. - Overview
- Crane Holdings Co. - Business segments
- Crane Holdings Co. - Key news
- Crane Holdings Co. - Key offerings
- Crane Holdings Co. - Segment focus
- 12.7 GOLDfren USA
- GOLDfren USA - Overview
- GOLDfren USA - Product / Service
- GOLDfren USA - Key offerings
- 12.8 Grove Aircraft Landing Gear Systems Inc.
- Grove Aircraft Landing Gear Systems Inc. - Overview
- Grove Aircraft Landing Gear Systems Inc. - Product / Service
- Grove Aircraft Landing Gear Systems Inc. - Key offerings
- 12.9 Honeywell International Inc.
- Honeywell International Inc. - Overview
- Honeywell International Inc. - Business segments
- Honeywell International Inc. - Key news
- Honeywell International Inc. - Key offerings
- Honeywell International Inc. - Segment focus
- 12.10 Jay Em Aerospace Inc.
- Jay Em Aerospace Inc. - Overview
- Jay Em Aerospace Inc. - Product / Service
- Jay Em Aerospace Inc. - Key offerings
- 12.11 Matco Aircraft Landing Systems
- Matco Aircraft Landing Systems - Overview
- Matco Aircraft Landing Systems - Product / Service
- Matco Aircraft Landing Systems - Key offerings
- 12.12 McFarlane Aviation Inc.
- McFarlane Aviation Inc. - Overview
- McFarlane Aviation Inc. - Product / Service
- McFarlane Aviation Inc. - Key offerings
- 12.13 Meggitt Plc
- Meggitt Plc - Overview
- Meggitt Plc - Business segments
- Meggitt Plc - Key offerings
- Meggitt Plc - Segment focus
- 12.14 Parker Hannifin Corp.
- Parker Hannifin Corp. - Overview
- Parker Hannifin Corp. - Business segments
- Parker Hannifin Corp. - Key news
- Parker Hannifin Corp. - Key offerings
- Parker Hannifin Corp. - Segment focus
- 12.15 RAPCO Inc.
- RAPCO Inc. - Overview
- RAPCO Inc. - Product / Service
- RAPCO Inc. - Key offerings
- 12.16 RTX Corp.
- RTX Corp. - Overview
- RTX Corp. - Business segments
- RTX Corp. - Key news
- RTX Corp. - Key offerings
- RTX Corp. - Segment focus
- 12.17 Safran SA
- Safran SA - Overview
- Safran SA - Business segments
- Safran SA - Key news
- Safran SA - Key offerings
- Safran SA - Segment focus
13 Appendix
- 13.1 Scope of the report
- 13.2 Inclusions and exclusions checklist
- Inclusions checklist
- Exclusions checklist
- 13.3 Currency conversion rates for US$
- Currency conversion rates for US$
- 13.4 Research methodology
- Research methodology
- 13.5 Data procurement
- Information sources
- 13.6 Data validation
- Data validation
- 13.7 Validation techniques employed for market sizing
- Validation techniques employed for market sizing
- 13.8 Data synthesis
- Data synthesis
- 13.9 360 degree market analysis
- 360 degree market analysis
- 13.10 List of abbreviations
- List of abbreviations

