|
|
市場調査レポート
商品コード
1516254
核使用済み燃料の世界市場 2024-2028Global nuclear spent fuel market 2024-2028 |
||||||
|
|||||||
カスタマイズ可能
|
|||||||

| 核使用済み燃料の世界市場 2024-2028 |
|
出版日: 2024年06月12日
発行: TechNavio
ページ情報: 英文 151 Pages
納期: 即納可能
|

全表示
- 概要
- 図表
- 目次
核使用済み燃料市場は、2023年から2028年にかけて12億1,680万米ドル、予測期間中のCAGRは2.08%で成長すると予測されています。
当レポートでは、核使用済み燃料市場の全体的な分析、市場規模・予測、動向、成長促進要因、課題、約25のベンダーを網羅したベンダー分析などを掲載しています。
現在の市場シナリオ、最新動向と促進要因、市場環境全体に関する最新分析を提供しています。クリーンエネルギー技術への注目の高まり、核使用済み燃料管理を支持する政府規制、再生可能エネルギー重視の高まりなどが市場を牽引しています。
| 市場範囲 | |
|---|---|
| 基準年 | 2024 |
| 終了年 | 2028 |
| 予測期間 | 2024-2028 |
| 成長モメンタム | 加速 |
| 前年比2024年 | 2.04% |
| CAGR | 2.08% |
| 増分額 | 12億1,680万米ドル |
本調査では、今後数年間の核使用済み燃料市場成長を牽引する主要因の1つとして原子力発電所の停止を挙げています。また、深地層処分の人気の高まりと原子力安全のための国際協力は、市場の大きな需要につながります。
目次
第1章 エグゼクティブサマリー
- 市場概要
第2章 市場情勢
- 市場エコシステム
- 市場の特徴
- バリューチェーン分析
第3章 市場規模の評価
- 市場の定義
- 市場セグメント分析
- 市場規模 2023
- 市場の見通し 2023-2028
第4章 市場規模実績
- 世界核使用済み燃料市場 2018-2022
- タイプ別セグメント分析 2018-2022
- 地域別セグメント分析 2018-2022
- 国別セグメント分析 2018-2022
第5章 ファイブフォース分析
- ファイブフォースの要約
- 買い手の交渉力
- 供給企業の交渉力
- 新規参入業者の脅威
- 代替品の脅威
- 競争の脅威
- 市況
第6章 市場セグメンテーション:タイプ別
- 市場セグメンテーション
- 比較:タイプ別
- 湿式保管:市場規模と予測 2023-2028
- 乾燥保管:市場規模と予測 2023-2028
- 市場機会:タイプ別
第7章 顧客情勢
- 顧客情勢の概要
第8章 地域別情勢
- 地域別セグメンテーション
- 地域別比較
- アジア太平洋:市場規模と予測 2023-2028
- 欧州:市場規模と予測 2023-2028
- 北米:市場規模と予測 2023-2028
- 中東・アフリカ:市場規模と予測 2023-2028
- 南米:市場規模と予測 2023-2028
- 中国:市場規模と予測 2023-2028
- 日本:市場規模と予測 2023-2028
- 米国:市場規模と予測 2023-2028
- フランス:市場規模と予測 2023-2028
- 韓国:市場規模と予測 2023-2028
- 市場機会:地域別
第9章 促進要因・課題・機会・抑制要因
- 市場促進要因
- 市場の課題
- 促進要因と課題の影響
- 市場の機会・抑制要因
第10章 競合情勢
- 概要
- 競合情勢
- 混乱の状況
- 業界のリスク
第11章 競合分析
- 企業プロファイル
- 企業の市場ポジショニング
- AECOM
- Babcock International Group Plc
- Bechtel Corp.
- BHI Energy
- Ecology Services Inc.
- Mitsubishi Heavy Industries Ltd.
- OCL Corp.
- Orano
- SKODA JS AS
- Veolia Environnement SA
第12章 付録
Exhibits:
- Exhibits1: Executive Summary - Chart on Market Overview
- Exhibits2: Executive Summary - Data Table on Market Overview
- Exhibits3: Executive Summary - Chart on Global Market Characteristics
- Exhibits4: Executive Summary - Chart on Market by Geography
- Exhibits5: Executive Summary - Chart on Market Segmentation by Type
- Exhibits6: Executive Summary - Chart on Incremental Growth
- Exhibits7: Executive Summary - Data Table on Incremental Growth
- Exhibits8: Executive Summary - Chart on Company Market Positioning
- Exhibits9: Parent Market
- Exhibits10: Data Table on - Parent Market
- Exhibits11: Market characteristics analysis
- Exhibits12: Value Chain Analysis
- Exhibits13: Offerings of companies included in the market definition
- Exhibits14: Market segments
- Exhibits15: Chart on Global - Market size and forecast 2023-2028 ($ million)
- Exhibits16: Data Table on Global - Market size and forecast 2023-2028 ($ million)
- Exhibits17: Chart on Global Market: Year-over-year growth 2023-2028 (%)
- Exhibits18: Data Table on Global Market: Year-over-year growth 2023-2028 (%)
- Exhibits19: Historic Market Size - Data Table on Global Nuclear Spent Fuel Market 2018 - 2022 ($ million)
- Exhibits20: Historic Market Size - Type Segment 2018 - 2022 ($ million)
- Exhibits21: Historic Market Size - Geography Segment 2018 - 2022 ($ million)
- Exhibits22: Historic Market Size - Country Segment 2018 - 2022 ($ million)
- Exhibits23: Five forces analysis - Comparison between 2023 and 2028
- Exhibits24: Bargaining power of buyers - Impact of key factors 2023 and 2028
- Exhibits25: Bargaining power of suppliers - Impact of key factors in 2023 and 2028
- Exhibits26: Threat of new entrants - Impact of key factors in 2023 and 2028
- Exhibits27: Threat of substitutes - Impact of key factors in 2023 and 2028
- Exhibits28: Threat of rivalry - Impact of key factors in 2023 and 2028
- Exhibits29: Chart on Market condition - Five forces 2023 and 2028
- Exhibits30: Chart on Type - Market share 2023-2028 (%)
- Exhibits31: Data Table on Type - Market share 2023-2028 (%)
- Exhibits32: Chart on Comparison by Type
- Exhibits33: Data Table on Comparison by Type
- Exhibits34: Chart on Wet storage - Market size and forecast 2023-2028 ($ million)
- Exhibits35: Data Table on Wet storage - Market size and forecast 2023-2028 ($ million)
- Exhibits36: Chart on Wet storage - Year-over-year growth 2023-2028 (%)
- Exhibits37: Data Table on Wet storage - Year-over-year growth 2023-2028 (%)
- Exhibits38: Chart on Dry storage - Market size and forecast 2023-2028 ($ million)
- Exhibits39: Data Table on Dry storage - Market size and forecast 2023-2028 ($ million)
- Exhibits40: Chart on Dry storage - Year-over-year growth 2023-2028 (%)
- Exhibits41: Data Table on Dry storage - Year-over-year growth 2023-2028 (%)
- Exhibits42: Market opportunity by Type ($ million)
- Exhibits43: Data Table on Market opportunity by Type ($ million)
- Exhibits44: Analysis of price sensitivity, lifecycle, customer purchase basket, adoption rates, and purchase criteria
- Exhibits45: Chart on Market share by geography 2023-2028 (%)
- Exhibits46: Data Table on Market share by geography 2023-2028 (%)
- Exhibits47: Chart on Geographic comparison
- Exhibits48: Data Table on Geographic comparison
- Exhibits49: Chart on APAC - Market size and forecast 2023-2028 ($ million)
- Exhibits50: Data Table on APAC - Market size and forecast 2023-2028 ($ million)
- Exhibits51: Chart on APAC - Year-over-year growth 2023-2028 (%)
- Exhibits52: Data Table on APAC - Year-over-year growth 2023-2028 (%)
- Exhibits53: Chart on Europe - Market size and forecast 2023-2028 ($ million)
- Exhibits54: Data Table on Europe - Market size and forecast 2023-2028 ($ million)
- Exhibits55: Chart on Europe - Year-over-year growth 2023-2028 (%)
- Exhibits56: Data Table on Europe - Year-over-year growth 2023-2028 (%)
- Exhibits57: Chart on North America - Market size and forecast 2023-2028 ($ million)
- Exhibits58: Data Table on North America - Market size and forecast 2023-2028 ($ million)
- Exhibits59: Chart on North America - Year-over-year growth 2023-2028 (%)
- Exhibits60: Data Table on North America - Year-over-year growth 2023-2028 (%)
- Exhibits61: Chart on Middle East and Africa - Market size and forecast 2023-2028 ($ million)
- Exhibits62: Data Table on Middle East and Africa - Market size and forecast 2023-2028 ($ million)
- Exhibits63: Chart on Middle East and Africa - Year-over-year growth 2023-2028 (%)
- Exhibits64: Data Table on Middle East and Africa - Year-over-year growth 2023-2028 (%)
- Exhibits65: Chart on South America - Market size and forecast 2023-2028 ($ million)
- Exhibits66: Data Table on South America - Market size and forecast 2023-2028 ($ million)
- Exhibits67: Chart on South America - Year-over-year growth 2023-2028 (%)
- Exhibits68: Data Table on South America - Year-over-year growth 2023-2028 (%)
- Exhibits69: Chart on China - Market size and forecast 2023-2028 ($ million)
- Exhibits70: Data Table on China - Market size and forecast 2023-2028 ($ million)
- Exhibits71: Chart on China - Year-over-year growth 2023-2028 (%)
- Exhibits72: Data Table on China - Year-over-year growth 2023-2028 (%)
- Exhibits73: Chart on Japan - Market size and forecast 2023-2028 ($ million)
- Exhibits74: Data Table on Japan - Market size and forecast 2023-2028 ($ million)
- Exhibits75: Chart on Japan - Year-over-year growth 2023-2028 (%)
- Exhibits76: Data Table on Japan - Year-over-year growth 2023-2028 (%)
- Exhibits77: Chart on US - Market size and forecast 2023-2028 ($ million)
- Exhibits78: Data Table on US - Market size and forecast 2023-2028 ($ million)
- Exhibits79: Chart on US - Year-over-year growth 2023-2028 (%)
- Exhibits80: Data Table on US - Year-over-year growth 2023-2028 (%)
- Exhibits81: Chart on France - Market size and forecast 2023-2028 ($ million)
- Exhibits82: Data Table on France - Market size and forecast 2023-2028 ($ million)
- Exhibits83: Chart on France - Year-over-year growth 2023-2028 (%)
- Exhibits84: Data Table on France - Year-over-year growth 2023-2028 (%)
- Exhibits85: Chart on South Korea - Market size and forecast 2023-2028 ($ million)
- Exhibits86: Data Table on South Korea - Market size and forecast 2023-2028 ($ million)
- Exhibits87: Chart on South Korea - Year-over-year growth 2023-2028 (%)
- Exhibits88: Data Table on South Korea - Year-over-year growth 2023-2028 (%)
- Exhibits89: Market opportunity by geography ($ million)
- Exhibits90: Data Tables on Market opportunity by geography ($ million)
- Exhibits91: Impact of drivers and challenges in 2023 and 2028
- Exhibits92: Overview on criticality of inputs and factors of differentiation
- Exhibits93: Overview on factors of disruption
- Exhibits94: Impact of key risks on business
- Exhibits95: Companies covered
- Exhibits96: Matrix on companies position and classification
- Exhibits97: AECOM - Overview
- Exhibits98: AECOM - Business segments
- Exhibits99: AECOM - Key news
- Exhibits100: AECOM - Key offerings
- Exhibits101: AECOM - Segment focus
- Exhibits102: Babcock International Group Plc - Overview
- Exhibits103: Babcock International Group Plc - Business segments
- Exhibits104: Babcock International Group Plc - Key news
- Exhibits105: Babcock International Group Plc - Key offerings
- Exhibits106: Babcock International Group Plc - Segment focus
- Exhibits107: Bechtel Corp. - Overview
- Exhibits108: Bechtel Corp. - Product / Service
- Exhibits109: Bechtel Corp. - Key news
- Exhibits110: Bechtel Corp. - Key offerings
- Exhibits111: BHI Energy - Overview
- Exhibits112: BHI Energy - Product / Service
- Exhibits113: BHI Energy - Key offerings
- Exhibits114: Ecology Services Inc. - Overview
- Exhibits115: Ecology Services Inc. - Product / Service
- Exhibits116: Ecology Services Inc. - Key offerings
- Exhibits117: Mitsubishi Heavy Industries Ltd. - Overview
- Exhibits118: Mitsubishi Heavy Industries Ltd. - Business segments
- Exhibits119: Mitsubishi Heavy Industries Ltd. - Key news
- Exhibits120: Mitsubishi Heavy Industries Ltd. - Key offerings
- Exhibits121: Mitsubishi Heavy Industries Ltd. - Segment focus
- Exhibits122: OCL Corp. - Overview
- Exhibits123: OCL Corp. - Product / Service
- Exhibits124: OCL Corp. - Key offerings
- Exhibits125: Orano - Overview
- Exhibits126: Orano - Business segments
- Exhibits127: Orano - Key offerings
- Exhibits128: Orano - Segment focus
- Exhibits129: SKODA JS AS - Overview
- Exhibits130: SKODA JS AS - Product / Service
- Exhibits131: SKODA JS AS - Key offerings
- Exhibits132: Veolia Environnement SA - Overview
- Exhibits133: Veolia Environnement SA - Business segments
- Exhibits134: Veolia Environnement SA - Key news
- Exhibits135: Veolia Environnement SA - Key offerings
- Exhibits136: Veolia Environnement SA - Segment focus
- Exhibits137: Inclusions checklist
- Exhibits138: Exclusions checklist
- Exhibits139: Currency conversion rates for US$
- Exhibits140: Research methodology
- Exhibits141: Information sources
- Exhibits142: Data validation
- Exhibits143: Validation techniques employed for market sizing
- Exhibits144: Data synthesis
- Exhibits145: 360 degree market analysis
- Exhibits146: List of abbreviations
The nuclear spent fuel market is forecasted to grow by USD 1216.8 mn during 2023-2028, accelerating at a CAGR of 2.08% during the forecast period. The report on the nuclear spent fuel market provides a holistic analysis, market size and forecast, trends, growth drivers, and challenges, as well as vendor analysis covering around 25 vendors.
The report offers an up-to-date analysis regarding the current market scenario, the latest trends and drivers, and the overall market environment. The market is driven by rising focus on clean energy technologies, government regulations favoring nuclear spent fuel management, and growing emphasis on renewable energy.
Technavio's nuclear spent fuel market is segmented as below:
| Market Scope | |
|---|---|
| Base Year | 2024 |
| End Year | 2028 |
| Series Year | 2024-2028 |
| Growth Momentum | Accelerate |
| YOY 2024 | 2.04% |
| CAGR | 2.08% |
| Incremental Value | $1216.8mn |
By Type
- Wet storage
- Dry storage
By Geography
- APAC
- Europe
- North America
- Middle East and Africa
- South America
This study identifies the shut down of nuclear power plants as one of the prime reasons driving the nuclear spent fuel market growth during the next few years. Also, growing popularity of deep geological disposal and international cooperation for nuclear safety will lead to sizable demand in the market.
The report on the nuclear spent fuel market covers the following areas:
- Nuclear spent fuel market sizing
- Nuclear spent fuel market forecast
- Nuclear spent fuel market industry analysis
The robust vendor analysis is designed to help clients improve their market position, and in line with this, this report provides a detailed analysis of several leading nuclear spent fuel market vendors that include AECOM, Ansaldo Energia Spa, Augean Plc, Babcock International Group Plc, Bechtel Corp., BHI Energy, Ecology Services Inc., EnergySolutions Inc., Fluor Corp., GNS Gesellschaft fur Nuklear Service mbH, Hitachi Zosen Corp., Holtec International, Mitsubishi Heavy Industries Ltd., OCL Corp., Orano, SKODA JS AS, Svensk Karnbranslehantering AB, Veolia Environnement SA, Waste Control Specialists LLC, and Westinghouse Electric Co. LLC. Also, the nuclear spent fuel market analysis report includes information on upcoming trends and challenges that will influence market growth. This is to help companies strategize and leverage all forthcoming growth opportunities.
The study was conducted using an objective combination of primary and secondary information including inputs from key participants in the industry. The report contains a comprehensive market and vendor landscape in addition to an analysis of the key vendors.
The publisher presents a detailed picture of the market by the way of study, synthesis, and summation of data from multiple sources by an analysis of key parameters such as profit, pricing, competition, and promotions. It presents various market facets by identifying the key industry influencers. The data presented is comprehensive, reliable, and a result of extensive research - both primary and secondary. The market research reports provide a complete competitive landscape and an in-depth vendor selection methodology and analysis using qualitative and quantitative research to forecast the accurate market growth.
Table of Contents
1 Executive Summary
- 1.1 Market overview
- Executive Summary - Chart on Market Overview
- Executive Summary - Data Table on Market Overview
- Executive Summary - Chart on Global Market Characteristics
- Executive Summary - Chart on Market by Geography
- Executive Summary - Chart on Market Segmentation by Type
- Executive Summary - Chart on Incremental Growth
- Executive Summary - Data Table on Incremental Growth
- Executive Summary - Chart on Company Market Positioning
2 Market Landscape
- 2.1 Market ecosystem
- Parent Market
- Data Table on - Parent Market
- 2.2 Market characteristics
- Market characteristics analysis
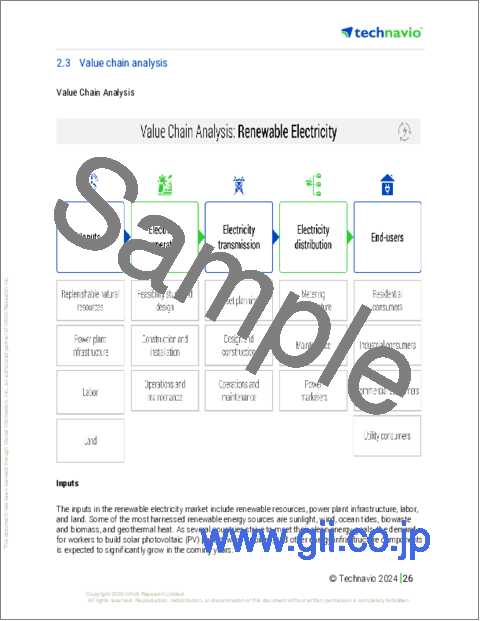
- 2.3 Value chain analysis
- Value Chain Analysis
3 Market Sizing
- 3.1 Market definition
- Offerings of companies included in the market definition
- 3.2 Market segment analysis
- Market segments
- 3.3 Market size 2023
- 3.4 Market outlook: Forecast for 2023-2028
- Chart on Global - Market size and forecast 2023-2028 ($ million)
- Data Table on Global - Market size and forecast 2023-2028 ($ million)
- Chart on Global Market: Year-over-year growth 2023-2028 (%)
- Data Table on Global Market: Year-over-year growth 2023-2028 (%)
4 Historic Market Size
- 4.1 Global Nuclear Spent Fuel Market 2018 - 2022
- Historic Market Size - Data Table on Global Nuclear Spent Fuel Market 2018 - 2022 ($ million)
- 4.2 Type segment analysis 2018 - 2022
- Historic Market Size - Type Segment 2018 - 2022 ($ million)
- 4.3 Geography segment analysis 2018 - 2022
- Historic Market Size - Geography Segment 2018 - 2022 ($ million)
- 4.4 Country segment analysis 2018 - 2022
- Historic Market Size - Country Segment 2018 - 2022 ($ million)
5 Five Forces Analysis
- 5.1 Five forces summary
- Five forces analysis - Comparison between 2023 and 2028
- 5.2 Bargaining power of buyers
- Bargaining power of buyers - Impact of key factors 2023 and 2028
- 5.3 Bargaining power of suppliers
- Bargaining power of suppliers - Impact of key factors in 2023 and 2028
- 5.4 Threat of new entrants
- Threat of new entrants - Impact of key factors in 2023 and 2028
- 5.5 Threat of substitutes
- Threat of substitutes - Impact of key factors in 2023 and 2028
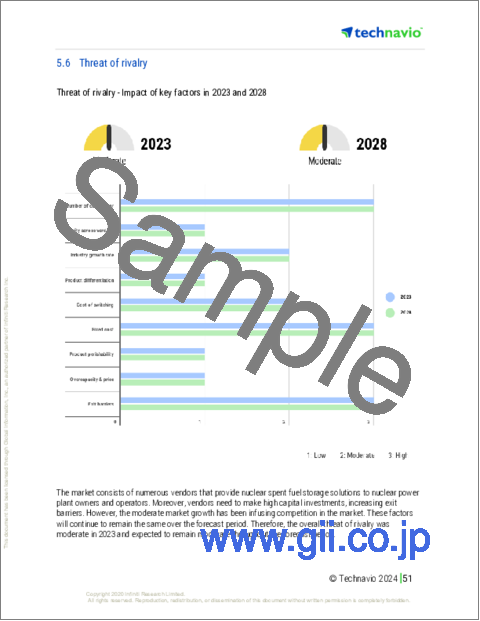
- 5.6 Threat of rivalry
- Threat of rivalry - Impact of key factors in 2023 and 2028
- 5.7 Market condition
- Chart on Market condition - Five forces 2023 and 2028
6 Market Segmentation by Type
- 6.1 Market segments
- Chart on Type - Market share 2023-2028 (%)
- Data Table on Type - Market share 2023-2028 (%)
- 6.2 Comparison by Type
- Chart on Comparison by Type
- Data Table on Comparison by Type
- 6.3 Wet storage - Market size and forecast 2023-2028
- Chart on Wet storage - Market size and forecast 2023-2028 ($ million)
- Data Table on Wet storage - Market size and forecast 2023-2028 ($ million)
- Chart on Wet storage - Year-over-year growth 2023-2028 (%)
- Data Table on Wet storage - Year-over-year growth 2023-2028 (%)
- 6.4 Dry storage - Market size and forecast 2023-2028
- Chart on Dry storage - Market size and forecast 2023-2028 ($ million)
- Data Table on Dry storage - Market size and forecast 2023-2028 ($ million)
- Chart on Dry storage - Year-over-year growth 2023-2028 (%)
- Data Table on Dry storage - Year-over-year growth 2023-2028 (%)
- 6.5 Market opportunity by Type
- Market opportunity by Type ($ million)
- Data Table on Market opportunity by Type ($ million)
7 Customer Landscape
- 7.1 Customer landscape overview
- Analysis of price sensitivity, lifecycle, customer purchase basket, adoption rates, and purchase criteria
8 Geographic Landscape
- 8.1 Geographic segmentation
- Chart on Market share by geography 2023-2028 (%)
- Data Table on Market share by geography 2023-2028 (%)
- 8.2 Geographic comparison
- Chart on Geographic comparison
- Data Table on Geographic comparison
- 8.3 APAC - Market size and forecast 2023-2028
- Chart on APAC - Market size and forecast 2023-2028 ($ million)
- Data Table on APAC - Market size and forecast 2023-2028 ($ million)
- Chart on APAC - Year-over-year growth 2023-2028 (%)
- Data Table on APAC - Year-over-year growth 2023-2028 (%)
- 8.4 Europe - Market size and forecast 2023-2028
- Chart on Europe - Market size and forecast 2023-2028 ($ million)
- Data Table on Europe - Market size and forecast 2023-2028 ($ million)
- Chart on Europe - Year-over-year growth 2023-2028 (%)
- Data Table on Europe - Year-over-year growth 2023-2028 (%)
- 8.5 North America - Market size and forecast 2023-2028
- Chart on North America - Market size and forecast 2023-2028 ($ million)
- Data Table on North America - Market size and forecast 2023-2028 ($ million)
- Chart on North America - Year-over-year growth 2023-2028 (%)
- Data Table on North America - Year-over-year growth 2023-2028 (%)
- 8.6 Middle East and Africa - Market size and forecast 2023-2028
- Chart on Middle East and Africa - Market size and forecast 2023-2028 ($ million)
- Data Table on Middle East and Africa - Market size and forecast 2023-2028 ($ million)
- Chart on Middle East and Africa - Year-over-year growth 2023-2028 (%)
- Data Table on Middle East and Africa - Year-over-year growth 2023-2028 (%)
- 8.7 South America - Market size and forecast 2023-2028
- Chart on South America - Market size and forecast 2023-2028 ($ million)
- Data Table on South America - Market size and forecast 2023-2028 ($ million)
- Chart on South America - Year-over-year growth 2023-2028 (%)
- Data Table on South America - Year-over-year growth 2023-2028 (%)
- 8.8 China - Market size and forecast 2023-2028
- Chart on China - Market size and forecast 2023-2028 ($ million)
- Data Table on China - Market size and forecast 2023-2028 ($ million)
- Chart on China - Year-over-year growth 2023-2028 (%)
- Data Table on China - Year-over-year growth 2023-2028 (%)
- 8.9 Japan - Market size and forecast 2023-2028
- Chart on Japan - Market size and forecast 2023-2028 ($ million)
- Data Table on Japan - Market size and forecast 2023-2028 ($ million)
- Chart on Japan - Year-over-year growth 2023-2028 (%)
- Data Table on Japan - Year-over-year growth 2023-2028 (%)
- 8.10 US - Market size and forecast 2023-2028
- Chart on US - Market size and forecast 2023-2028 ($ million)
- Data Table on US - Market size and forecast 2023-2028 ($ million)
- Chart on US - Year-over-year growth 2023-2028 (%)
- Data Table on US - Year-over-year growth 2023-2028 (%)
- 8.11 France - Market size and forecast 2023-2028
- Chart on France - Market size and forecast 2023-2028 ($ million)
- Data Table on France - Market size and forecast 2023-2028 ($ million)
- Chart on France - Year-over-year growth 2023-2028 (%)
- Data Table on France - Year-over-year growth 2023-2028 (%)
- 8.12 South Korea - Market size and forecast 2023-2028
- Chart on South Korea - Market size and forecast 2023-2028 ($ million)
- Data Table on South Korea - Market size and forecast 2023-2028 ($ million)
- Chart on South Korea - Year-over-year growth 2023-2028 (%)
- Data Table on South Korea - Year-over-year growth 2023-2028 (%)
- 8.13 Market opportunity by geography
- Market opportunity by geography ($ million)
- Data Tables on Market opportunity by geography ($ million)
9 Drivers, Challenges, and Opportunity/Restraints
- 9.1 Market drivers
- 9.2 Market challenges
- 9.3 Impact of drivers and challenges
- Impact of drivers and challenges in 2023 and 2028
- 9.4 Market opportunities/restraints
10 Competitive Landscape
- 10.1 Overview
- 10.2 Competitive Landscape
- Overview on criticality of inputs and factors of differentiation
- 10.3 Landscape disruption
- Overview on factors of disruption
- 10.4 Industry risks
- Impact of key risks on business
11 Competitive Analysis
- 11.1 Companies profiled
- Companies covered
- 11.2 Market positioning of companies
- Matrix on companies position and classification
- 11.3 AECOM
- AECOM - Overview
- AECOM - Business segments
- AECOM - Key news
- AECOM - Key offerings
- AECOM - Segment focus
- 11.4 Babcock International Group Plc
- Babcock International Group Plc - Overview
- Babcock International Group Plc - Business segments
- Babcock International Group Plc - Key news
- Babcock International Group Plc - Key offerings
- Babcock International Group Plc - Segment focus
- 11.5 Bechtel Corp.
- Bechtel Corp. - Overview
- Bechtel Corp. - Product / Service
- Bechtel Corp. - Key news
- Bechtel Corp. - Key offerings
- 11.6 BHI Energy
- BHI Energy - Overview
- BHI Energy - Product / Service
- BHI Energy - Key offerings
- 11.7 Ecology Services Inc.
- Ecology Services Inc. - Overview
- Ecology Services Inc. - Product / Service
- Ecology Services Inc. - Key offerings
- 11.8 Mitsubishi Heavy Industries Ltd.
- Mitsubishi Heavy Industries Ltd. - Overview
- Mitsubishi Heavy Industries Ltd. - Business segments
- Mitsubishi Heavy Industries Ltd. - Key news
- Mitsubishi Heavy Industries Ltd. - Key offerings
- Mitsubishi Heavy Industries Ltd. - Segment focus
- 11.9 OCL Corp.
- OCL Corp. - Overview
- OCL Corp. - Product / Service
- OCL Corp. - Key offerings
- 11.10 Orano
- Orano - Overview
- Orano - Business segments
- Orano - Key offerings
- Orano - Segment focus
- 11.11 SKODA JS AS
- SKODA JS AS - Overview
- SKODA JS AS - Product / Service
- SKODA JS AS - Key offerings
- 11.12 Veolia Environnement SA
- Veolia Environnement SA - Overview
- Veolia Environnement SA - Business segments
- Veolia Environnement SA - Key news
- Veolia Environnement SA - Key offerings
- Veolia Environnement SA - Segment focus
12 Appendix
- 12.1 Scope of the report
- 12.2 Inclusions and exclusions checklist
- Inclusions checklist
- Exclusions checklist
- 12.3 Currency conversion rates for US$
- Currency conversion rates for US$
- 12.4 Research methodology
- Research methodology
- 12.5 Data procurement
- Information sources
- 12.6 Data validation
- Data validation
- 12.7 Validation techniques employed for market sizing
- Validation techniques employed for market sizing
- 12.8 Data synthesis
- Data synthesis
- 12.9 360 degree market analysis
- 360 degree market analysis
- 12.10 List of abbreviations
- List of abbreviations
