|
|
市場調査レポート
商品コード
1653029
ベリーの世界市場 2025~2029年Global Berries Market 2025-2029 |
||||||

|
|||||||
カスタマイズ可能
|
|||||||


| ベリーの世界市場 2025~2029年 |
|
出版日: 2025年01月30日
発行: TechNavio
ページ情報: 英文 205 Pages
納期: 即納可能
|

全表示
- 概要
- 目次
ベリー市場は2024~2029年に126億9,690万米ドル、予測期間中のCAGRは6.2%で成長すると予測されます。
当レポートでは、ベリー市場の全体的な分析、市場規模・予測、動向、成長促進要因、課題、約25のベンダーを網羅したベンダー分析などを掲載しています。
現在の市場シナリオ、最新動向と促進要因、市場環境全体に関する最新分析を提供しています。市場は、ベリーを摂取することの利点に関する認知度の向上やプロモーション、新製品の発売、小売の拡大などが牽引しています。
| 市場範囲 | |
|---|---|
| 基準年 | 2025年 |
| 終了年 | 2029年 |
| 予測期間 | 2025~2029年 |
| 成長モメンタム | 加速 |
| 前年比[2025年] | 6.1% |
| CAGR | 6.2% |
| 増分額 | 126億9,690万米ドル |
本調査は、産業の主要参加者からのインプットを含め、一次情報と二次情報を客観的に組み合わせて実施しました。本レポートには、主要企業の分析に加え、包括的な市場規模データ、地域分析によるセグメント、ベンダー情勢が含まれています。レポートには過去データと予測データがあります。
本調査では、今後数年間のベリー市場の成長を促進する主要要因の1つとして、プライベートブランド(PB)の台頭を挙げています。また、ベリーの新しい包装動向や革新的なラベリングは、市場の大きな需要につながると考えられます。
目次
第1章 エグゼクティブサマリー
- 市場概要
第2章 Technavio分析
- 価格・ライフサイクル・顧客購入バスケット・採用率・購入基準の分析
- インプットの重要性と差別化の要因
- 混乱の要因
- 促進要因と課題の影響
第3章 市場情勢
- 市場エコシステム
- 市場の特徴
- バリューチェーン分析
第4章 市場規模
- 市場の定義
- 市場セグメント分析
- 市場規模 2024年
- 市場の展望 2024~2029年
第5章 市場規模実績
- ベリーの世界市場 2019~2023年
- 用途別セグメント分析 2019~2023年
- タイプ別セグメント分析 2019~2023年
- 地域別セグメント分析 2019~2023年
- 国別セグメント分析 2019~2023年
第6章 定性分析
- AIの影響:ベリーの世界市場
第7章 ファイブフォース分析
- ファイブフォースの要約
- 買い手の交渉力
- 供給企業の交渉力
- 新規参入業者の脅威
- 代替品の脅威
- 競争の脅威
- 市況
第8章 市場セグメンテーション:用途別
- 市場セグメント
- 比較:用途別
- 飲食品:市場規模と予測 2024~2029年
- パーソナルケア:市場規模と予測 2024~2029年
- その他:市場規模と予測 2024~2029年
- 市場機会:用途別
第9章 市場セグメンテーション:タイプ別
- 市場セグメント
- 比較:タイプ別
- イチゴ:市場規模と予測 2024~2029年
- ブルーベリー:市場規模と予測 2024~2029年
- ラズベリー:市場規模と予測 2024~2029年
- その他:市場規模と予測 2024~2029年
- 市場機会:タイプ別
第10章 顧客情勢
- 顧客情勢概要
第11章 地域別情勢
- 地域別セグメンテーション
- 比較:地域別
- 欧州:市場規模と予測 2024~2029年
- 北米:市場規模と予測 2024~2029年
- アジア太平洋:市場規模と予測 2024~2029年
- 南米:市場規模と予測 2024~2029年
- 中東・アフリカ:市場規模と予測 2024~2029年
- 米国:市場規模と予測 2024~2029年
- 英国:市場規模と予測 2024~2029年
- ドイツ:市場規模と予測 2024~2029年
- フランス:市場規模と予測 2024~2029年
- 中国:市場規模と予測 2024~2029年
- チリ:市場規模と予測 2024~2029年
- 日本:市場規模と予測 2024~2029年
- 韓国:市場規模と予測 2024~2029年
- ポーランド:市場規模と予測 2024~2029年
- メキシコ:市場規模と予測 2024~2029年
- 地域情勢による市場機会
第12章 促進要因・課題・機会・抑制要因
- 市場促進要因
- 市場課題
- 促進要因と課題の影響
- 市場機会・抑制要因
第13章 競合情勢
- 概要
- 競合情勢
- 混乱の状況
- 産業のリスク
第14章 競合分析
- 企業プロファイル
- 企業ランキング指数
- 企業の市場ポジショニング
- AGRANA Beteiligungs AG
- BerryWorld Ltd.
- Brothers International Food LLC
- California Giant Inc
- Coast Berry Co. Ltd.
- Dole plc
- Driscolls Inc.
- Elite Agro LLC
- Family Tree Farms
- Fresgarrido SL
- Haygrove Ltd.
- Sun Belle Inc.
- SunOpta Inc.
- Uren Food Group Ltd.
- Wish Farms Inc.
第15章 付録
The berries market is forecasted to grow by USD 12696.9 million during 2024-2029, accelerating at a CAGR of 6.2% during the forecast period. The report on the berries market provides a holistic analysis, market size and forecast, trends, growth drivers, and challenges, as well as vendor analysis covering around 25 vendors.
The report offers an up-to-date analysis regarding the current market scenario, the latest trends and drivers, and the overall market environment. The market is driven by growing awareness and promotion of benefits of consuming berries, new product launches, and expansion in retail landscape.
| Market Scope | |
|---|---|
| Base Year | 2025 |
| End Year | 2029 |
| Series Year | 2025-2029 |
| Growth Momentum | Accelerate |
| YOY 2025 | 6.1% |
| CAGR | 6.2% |
| Incremental Value | $12696.9 mn |
The study was conducted using an objective combination of primary and secondary information including inputs from key participants in the industry. The report contains a comprehensive market size data, segment with regional analysis and vendor landscape in addition to an analysis of the key companies. Reports have historic and forecast data.
Technavio's berries market is segmented as below:
By Application
- Food and beverages
- Personal care
- Others
By Type
- Strawberries
- Blueberries
- Raspberries
- Others
By Geographical Landscape
- Europe
- North America
- APAC
- South America
- Middle East and Africa
This study identifies the increasing prominence of private-label brands as one of the prime reasons driving the berries market growth during the next few years. Also, new packaging trends and innovative labeling for berries will lead to sizable demand in the market.
The report on the berries market covers the following areas:
- Berries Market sizing
- Berries Market forecast
- Berries Market industry analysis
The robust vendor analysis is designed to help clients improve their market position, and in line with this, this report provides a detailed analysis of several leading berries market vendors that include AGRANA Beteiligungs AG, BerryWorld Ltd., Brothers International Food LLC, California Giant Inc, Coast Berry Co. Ltd., Dole PLC, Driscolls Inc., Elite Agro LLC, Family Tree Farms, Fresgarrido SL, Haygrove Ltd., Mountain Blue Farms Pty Ltd., Rainier Fruit Co., Royal Ridge Fruits, SAT Plus Berries, Sun Belle Inc., SunOpta Inc., Uren Food Group Ltd., and Wish Farms Inc.. Also, the berries market analysis report includes information on upcoming trends and challenges that will influence market growth. This is to help companies strategize and leverage all forthcoming growth opportunities.
The publisher presents a detailed picture of the market by the way of study, synthesis, and summation of data from multiple sources by an analysis of key parameters such as profit, pricing, competition, and promotions. It presents various market facets by identifying the key industry influencers. The data presented is comprehensive, reliable, and a result of extensive primary and secondary research. The market research reports provide a complete competitive landscape and an in-depth vendor selection methodology and analysis using qualitative and quantitative research to forecast accurate market growth.
Table of Contents
1 Executive Summary
- 1.1 Market overview
- Executive Summary - Chart on Market Overview
- Executive Summary - Data Table on Market Overview
- Executive Summary - Chart on Global Market Characteristics
- Executive Summary - Chart on Market By Geographical Landscape
- Executive Summary - Chart on Market Segmentation by Application
- Executive Summary - Chart on Market Segmentation by Type
- Executive Summary - Chart on Incremental Growth
- Executive Summary - Data Table on Incremental Growth
- Executive Summary - Chart on Company Market Positioning
2 Technavio Analysis
- 2.1 Analysis of price sensitivity, lifecycle, customer purchase basket, adoption rates, and purchase criteria
- Analysis of price sensitivity, lifecycle, customer purchase basket, adoption rates, and purchase criteria
- 2.2 Criticality of inputs and Factors of differentiation
- Overview on criticality of inputs and factors of differentiation
- 2.3 Factors of disruption
- Overview on factors of disruption
- 2.4 Impact of drivers and challenges
- Impact of drivers and challenges in 2024 and 2029
3 Market Landscape
- 3.1 Market ecosystem
- Parent Market
- Data Table on - Parent Market
- 3.2 Market characteristics
- Market characteristics analysis
- 3.3 Value chain analysis
- Value chain analysis
4 Market Sizing
- 4.1 Market definition
- Offerings of companies included in the market definition
- 4.2 Market segment analysis
- Market segments
- 4.3 Market size 2024
- 4.4 Market outlook: Forecast for 2024-2029
- Chart on Global - Market size and forecast 2024-2029 ($ million)
- Data Table on Global - Market size and forecast 2024-2029 ($ million)
- Chart on Global Market: Year-over-year growth 2024-2029 (%)
- Data Table on Global Market: Year-over-year growth 2024-2029 (%)
5 Historic Market Size
- 5.1 Global Berries Market 2019 - 2023
- Historic Market Size - Data Table on Global Berries Market 2019 - 2023 ($ million)
- 5.2 Application segment analysis 2019 - 2023
- Historic Market Size - Application Segment 2019 - 2023 ($ million)
- 5.3 Type segment analysis 2019 - 2023
- Historic Market Size - Type Segment 2019 - 2023 ($ million)
- 5.4 Geography segment analysis 2019 - 2023
- Historic Market Size - Geography Segment 2019 - 2023 ($ million)
- 5.5 Country segment analysis 2019 - 2023
- Historic Market Size - Country Segment 2019 - 2023 ($ million)
6 Qualitative Analysis
- 6.1 The AI impact on Global Berries Market
7 Five Forces Analysis
- 7.1 Five forces summary
- Five forces analysis - Comparison between 2024 and 2029
- 7.2 Bargaining power of buyers
- Bargaining power of buyers - Impact of key factors 2024 and 2029
- 7.3 Bargaining power of suppliers
- Bargaining power of suppliers - Impact of key factors in 2024 and 2029
- 7.4 Threat of new entrants
- Threat of new entrants - Impact of key factors in 2024 and 2029
- 7.5 Threat of substitutes
- Threat of substitutes - Impact of key factors in 2024 and 2029
- 7.6 Threat of rivalry
- Threat of rivalry - Impact of key factors in 2024 and 2029
- 7.7 Market condition
- Chart on Market condition - Five forces 2024 and 2029
8 Market Segmentation by Application
- 8.1 Market segments
- Chart on Application - Market share 2024-2029 (%)
- Data Table on Application - Market share 2024-2029 (%)
- 8.2 Comparison by Application
- Chart on Comparison by Application
- Data Table on Comparison by Application
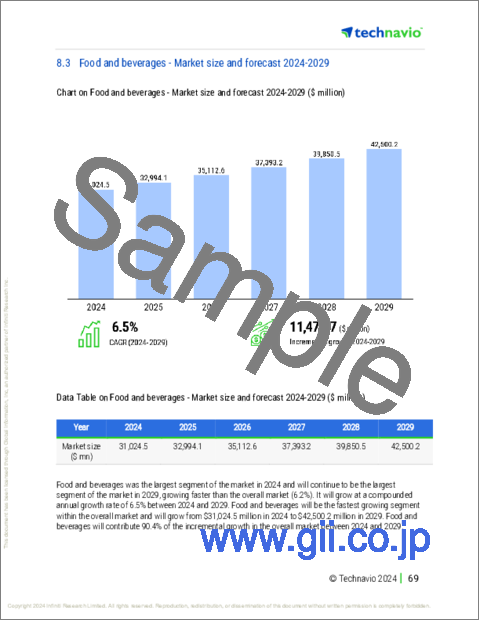
- 8.3 Food and beverages - Market size and forecast 2024-2029
- Chart on Food and beverages - Market size and forecast 2024-2029 ($ million)
- Data Table on Food and beverages - Market size and forecast 2024-2029 ($ million)
- Chart on Food and beverages - Year-over-year growth 2024-2029 (%)
- Data Table on Food and beverages - Year-over-year growth 2024-2029 (%)
- 8.4 Personal care - Market size and forecast 2024-2029
- Chart on Personal care - Market size and forecast 2024-2029 ($ million)
- Data Table on Personal care - Market size and forecast 2024-2029 ($ million)
- Chart on Personal care - Year-over-year growth 2024-2029 (%)
- Data Table on Personal care - Year-over-year growth 2024-2029 (%)
- 8.5 Others - Market size and forecast 2024-2029
- Chart on Others - Market size and forecast 2024-2029 ($ million)
- Data Table on Others - Market size and forecast 2024-2029 ($ million)
- Chart on Others - Year-over-year growth 2024-2029 (%)
- Data Table on Others - Year-over-year growth 2024-2029 (%)
- 8.6 Market opportunity by Application
- Market opportunity by Application ($ million)
- Data Table on Market opportunity by Application ($ million)
9 Market Segmentation by Type
- 9.1 Market segments
- Chart on Type - Market share 2024-2029 (%)
- Data Table on Type - Market share 2024-2029 (%)
- 9.2 Comparison by Type
- Chart on Comparison by Type
- Data Table on Comparison by Type
- 9.3 Strawberries - Market size and forecast 2024-2029
- Chart on Strawberries - Market size and forecast 2024-2029 ($ million)
- Data Table on Strawberries - Market size and forecast 2024-2029 ($ million)
- Chart on Strawberries - Year-over-year growth 2024-2029 (%)
- Data Table on Strawberries - Year-over-year growth 2024-2029 (%)
- 9.4 Blueberries - Market size and forecast 2024-2029
- Chart on Blueberries - Market size and forecast 2024-2029 ($ million)
- Data Table on Blueberries - Market size and forecast 2024-2029 ($ million)
- Chart on Blueberries - Year-over-year growth 2024-2029 (%)
- Data Table on Blueberries - Year-over-year growth 2024-2029 (%)
- 9.5 Raspberries - Market size and forecast 2024-2029
- Chart on Raspberries - Market size and forecast 2024-2029 ($ million)
- Data Table on Raspberries - Market size and forecast 2024-2029 ($ million)
- Chart on Raspberries - Year-over-year growth 2024-2029 (%)
- Data Table on Raspberries - Year-over-year growth 2024-2029 (%)
- 9.6 Others - Market size and forecast 2024-2029
- Chart on Others - Market size and forecast 2024-2029 ($ million)
- Data Table on Others - Market size and forecast 2024-2029 ($ million)
- Chart on Others - Year-over-year growth 2024-2029 (%)
- Data Table on Others - Year-over-year growth 2024-2029 (%)
- 9.7 Market opportunity by Type
- Market opportunity by Type ($ million)
- Data Table on Market opportunity by Type ($ million)
10 Customer Landscape
- 10.1 Customer landscape overview
- Analysis of price sensitivity, lifecycle, customer purchase basket, adoption rates, and purchase criteria
11 Geographic Landscape
- 11.1 Geographic segmentation
- Chart on Market share By Geographical Landscape 2024-2029 (%)
- Data Table on Market share By Geographical Landscape 2024-2029 (%)
- 11.2 Geographic comparison
- Chart on Geographic comparison
- Data Table on Geographic comparison
- 11.3 Europe - Market size and forecast 2024-2029
- Chart on Europe - Market size and forecast 2024-2029 ($ million)
- Data Table on Europe - Market size and forecast 2024-2029 ($ million)
- Chart on Europe - Year-over-year growth 2024-2029 (%)
- Data Table on Europe - Year-over-year growth 2024-2029 (%)
- 11.4 North America - Market size and forecast 2024-2029
- Chart on North America - Market size and forecast 2024-2029 ($ million)
- Data Table on North America - Market size and forecast 2024-2029 ($ million)
- Chart on North America - Year-over-year growth 2024-2029 (%)
- Data Table on North America - Year-over-year growth 2024-2029 (%)
- 11.5 APAC - Market size and forecast 2024-2029
- Chart on APAC - Market size and forecast 2024-2029 ($ million)
- Data Table on APAC - Market size and forecast 2024-2029 ($ million)
- Chart on APAC - Year-over-year growth 2024-2029 (%)
- Data Table on APAC - Year-over-year growth 2024-2029 (%)
- 11.6 South America - Market size and forecast 2024-2029
- Chart on South America - Market size and forecast 2024-2029 ($ million)
- Data Table on South America - Market size and forecast 2024-2029 ($ million)
- Chart on South America - Year-over-year growth 2024-2029 (%)
- Data Table on South America - Year-over-year growth 2024-2029 (%)
- 11.7 Middle East and Africa - Market size and forecast 2024-2029
- Chart on Middle East and Africa - Market size and forecast 2024-2029 ($ million)
- Data Table on Middle East and Africa - Market size and forecast 2024-2029 ($ million)
- Chart on Middle East and Africa - Year-over-year growth 2024-2029 (%)
- Data Table on Middle East and Africa - Year-over-year growth 2024-2029 (%)
- 11.8 US - Market size and forecast 2024-2029
- Chart on US - Market size and forecast 2024-2029 ($ million)
- Data Table on US - Market size and forecast 2024-2029 ($ million)
- Chart on US - Year-over-year growth 2024-2029 (%)
- Data Table on US - Year-over-year growth 2024-2029 (%)
- 11.9 UK - Market size and forecast 2024-2029
- Chart on UK - Market size and forecast 2024-2029 ($ million)
- Data Table on UK - Market size and forecast 2024-2029 ($ million)
- Chart on UK - Year-over-year growth 2024-2029 (%)
- Data Table on UK - Year-over-year growth 2024-2029 (%)
- 11.10 Germany - Market size and forecast 2024-2029
- Chart on Germany - Market size and forecast 2024-2029 ($ million)
- Data Table on Germany - Market size and forecast 2024-2029 ($ million)
- Chart on Germany - Year-over-year growth 2024-2029 (%)
- Data Table on Germany - Year-over-year growth 2024-2029 (%)
- 11.11 France - Market size and forecast 2024-2029
- Chart on France - Market size and forecast 2024-2029 ($ million)
- Data Table on France - Market size and forecast 2024-2029 ($ million)
- Chart on France - Year-over-year growth 2024-2029 (%)
- Data Table on France - Year-over-year growth 2024-2029 (%)
- 11.12 China - Market size and forecast 2024-2029
- Chart on China - Market size and forecast 2024-2029 ($ million)
- Data Table on China - Market size and forecast 2024-2029 ($ million)
- Chart on China - Year-over-year growth 2024-2029 (%)
- Data Table on China - Year-over-year growth 2024-2029 (%)
- 11.13 Chile - Market size and forecast 2024-2029
- Chart on Chile - Market size and forecast 2024-2029 ($ million)
- Data Table on Chile - Market size and forecast 2024-2029 ($ million)
- Chart on Chile - Year-over-year growth 2024-2029 (%)
- Data Table on Chile - Year-over-year growth 2024-2029 (%)
- 11.14 Japan - Market size and forecast 2024-2029
- Chart on Japan - Market size and forecast 2024-2029 ($ million)
- Data Table on Japan - Market size and forecast 2024-2029 ($ million)
- Chart on Japan - Year-over-year growth 2024-2029 (%)
- Data Table on Japan - Year-over-year growth 2024-2029 (%)
- 11.15 South Korea - Market size and forecast 2024-2029
- Chart on South Korea - Market size and forecast 2024-2029 ($ million)
- Data Table on South Korea - Market size and forecast 2024-2029 ($ million)
- Chart on South Korea - Year-over-year growth 2024-2029 (%)
- Data Table on South Korea - Year-over-year growth 2024-2029 (%)
- 11.16 Poland - Market size and forecast 2024-2029
- Chart on Poland - Market size and forecast 2024-2029 ($ million)
- Data Table on Poland - Market size and forecast 2024-2029 ($ million)
- Chart on Poland - Year-over-year growth 2024-2029 (%)
- Data Table on Poland - Year-over-year growth 2024-2029 (%)
- 11.17 Mexico - Market size and forecast 2024-2029
- Chart on Mexico - Market size and forecast 2024-2029 ($ million)
- Data Table on Mexico - Market size and forecast 2024-2029 ($ million)
- Chart on Mexico - Year-over-year growth 2024-2029 (%)
- Data Table on Mexico - Year-over-year growth 2024-2029 (%)
- 11.18 Market opportunity By Geographical Landscape
- Market opportunity By Geographical Landscape ($ million)
- Data Tables on Market opportunity By Geographical Landscape ($ million)
12 Drivers, Challenges, and Opportunity/Restraints
- 12.1 Market drivers
- 12.2 Market challenges
- 12.3 Impact of drivers and challenges
- Impact of drivers and challenges in 2024 and 2029
- 12.4 Market opportunities/restraints
13 Competitive Landscape
- 13.1 Overview
- 13.2 Competitive Landscape
- Overview on criticality of inputs and factors of differentiation
- 13.3 Landscape disruption
- Overview on factors of disruption
- 13.4 Industry risks
- Impact of key risks on business
14 Competitive Analysis
- 14.1 Companies profiled
- Companies covered
- 14.2 Company ranking index
- Company ranking index
- 14.3 Market positioning of companies
- Matrix on companies position and classification
- 14.4 AGRANA Beteiligungs AG
- AGRANA Beteiligungs AG - Overview
- AGRANA Beteiligungs AG - Business segments
- AGRANA Beteiligungs AG - Key news
- AGRANA Beteiligungs AG - Key offerings
- AGRANA Beteiligungs AG - Segment focus
- SWOT
- 14.5 BerryWorld Ltd.
- BerryWorld Ltd. - Overview
- BerryWorld Ltd. - Product / Service
- BerryWorld Ltd. - Key offerings
- SWOT
- 14.6 Brothers International Food LLC
- Brothers International Food LLC - Overview
- Brothers International Food LLC - Product / Service
- Brothers International Food LLC - Key offerings
- SWOT
- 14.7 California Giant Inc
- California Giant Inc - Overview
- California Giant Inc - Product / Service
- California Giant Inc - Key offerings
- SWOT
- 14.8 Coast Berry Co. Ltd.
- Coast Berry Co. Ltd. - Overview
- Coast Berry Co. Ltd. - Product / Service
- Coast Berry Co. Ltd. - Key offerings
- SWOT
- 14.9 Dole plc
- Dole plc - Overview
- Dole plc - Business segments
- Dole plc - Key offerings
- Dole plc - Segment focus
- SWOT
- 14.10 Driscolls Inc.
- Driscolls Inc. - Overview
- Driscolls Inc. - Product / Service
- Driscolls Inc. - Key offerings
- SWOT
- 14.11 Elite Agro LLC
- Elite Agro LLC - Overview
- Elite Agro LLC - Product / Service
- Elite Agro LLC - Key offerings
- SWOT
- 14.12 Family Tree Farms
- Family Tree Farms - Overview
- Family Tree Farms - Product / Service
- Family Tree Farms - Key offerings
- SWOT
- 14.13 Fresgarrido SL
- Fresgarrido SL - Overview
- Fresgarrido SL - Product / Service
- Fresgarrido SL - Key offerings
- SWOT
- 14.14 Haygrove Ltd.
- Haygrove Ltd. - Overview
- Haygrove Ltd. - Product / Service
- Haygrove Ltd. - Key offerings
- SWOT
- 14.15 Sun Belle Inc.
- Sun Belle Inc. - Overview
- Sun Belle Inc. - Product / Service
- Sun Belle Inc. - Key offerings
- SWOT
- 14.16 SunOpta Inc.
- SunOpta Inc. - Overview
- SunOpta Inc. - Business segments
- SunOpta Inc. - Key news
- SunOpta Inc. - Key offerings
- SunOpta Inc. - Segment focus
- SWOT
- 14.17 Uren Food Group Ltd.
- Uren Food Group Ltd. - Overview
- Uren Food Group Ltd. - Product / Service
- Uren Food Group Ltd. - Key offerings
- SWOT
- 14.18 Wish Farms Inc.
- Wish Farms Inc. - Overview
- Wish Farms Inc. - Product / Service
- Wish Farms Inc. - Key offerings
- SWOT
15 Appendix
- 15.1 Scope of the report
- 15.2 Inclusions and exclusions checklist
- Inclusions checklist
- Exclusions checklist
- 15.3 Currency conversion rates for US$
- Currency conversion rates for US$
- 15.4 Research methodology
- Research methodology
- 15.5 Data procurement
- Information sources
- 15.6 Data validation
- Data validation
- 15.7 Validation techniques employed for market sizing
- Validation techniques employed for market sizing
- 15.8 Data synthesis
- Data synthesis
- 15.9 360 degree market analysis
- 360 degree market analysis
- 15.10 List of abbreviations
- List of abbreviations
