|
|
市場調査レポート
商品コード
1915389
世界のフィットネス・レクリエーションスポーツセンター市場2026-2030年Global Fitness And Recreational Sports Centers Market 2026-2030 |
||||||
|
|||||||
カスタマイズ可能
|
|||||||

| 世界のフィットネス・レクリエーションスポーツセンター市場2026-2030年 |
|
出版日: 2026年01月19日
発行: TechNavio
ページ情報: 英文 292 Pages
納期: 即納可能
|

概要
世界のフィットネスおよびレクリエーションスポーツセンター市場は、2025年から2030年の間に1,071億6,180万米ドルの成長が見込まれ、予測期間中のCAGRは9.2%と予測されています。
本報告書では、世界のフィットネスおよびレクリエーションスポーツセンター市場に関する包括的な分析、市場規模と予測、動向、成長要因、課題、ならびに約25社のベンダー分析を提供しております。
本レポートは、現在の市場状況、最新の動向と促進要因、市場環境全般に関する最新の分析を提供します。市場の成長は、健康とウェルネスへの意識の高まりによる会員数の増加、企業のウェルネス施策による需要拡大、生活習慣病の増加傾向によって牽引されています。
本調査は、業界の主要関係者からの情報を含む、一次情報と二次情報の客観的な組み合わせを用いて実施されました。本レポートには、主要企業の分析に加え、包括的な市場規模データ、地域別分析を伴うセグメント、ベンダー情勢が含まれています。レポートには過去データと予測データが掲載されています。
| 市場範囲 | |
|---|---|
| 基準年 | 2026年 |
| 終了年 | 2030年 |
| 予測期間 | 2026-2030 |
| 成長モメンタム | 加速 |
| 前年比2026年 | 9.1% |
| CAGR | 9.2% |
| 増分額 | 1,071億6,180万米ドル |
本調査では、VRおよびARを活用した没入型ワークアウトが主流のフィットネス市場に参入していることが、今後数年間における世界のフィットネス・レクリエーションスポーツセンター市場の成長を牽引する主要な要因の一つであると特定しております。また、従来のフィットネスや筋力トレーニングに付随する総合的なウェルネスサービス、および機能ゾーンが施設の焦点となることで、市場において相当な需要が生じると予想されます。
目次
第1章 エグゼクティブサマリー
第2章 Technavio分析
- 価格・ライフサイクル・顧客購入バスケット・採用率・購入基準の分析
- インプットの重要性と差別化の要因
- 混乱の要因
- 促進要因と課題の影響
第3章 市場情勢
- 市場エコシステム
- 市場の特徴
- バリューチェーン分析
第4章 市場規模
- 市場の定義
- 市場セグメント分析
- 市場規模 2025
- 市場の見通し 2025-2030
第5章 市場規模実績
- 世界のフィットネス・レクリエーションスポーツセンター市場 2020-2024
- エンドユーザーセグメント分析 2020-2024
- 年齢層別セグメント分析 2020-2024
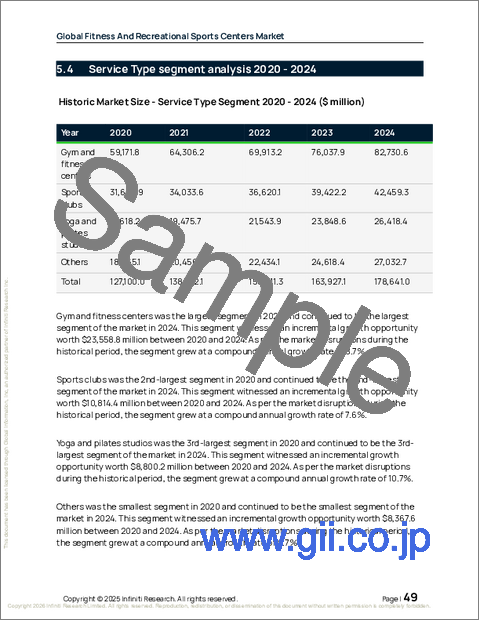
- サービスタイプセグメント分析 2020-2024
- 地域別セグメント分析 2020-2024
- 国別セグメント分析 2020-2024
第6章 定性分析
- AIがもたらす影響世界のフィットネス・レクリエーションスポーツセンター市場
第7章 ファイブフォース分析
- ファイブフォースの要約
- 買い手の交渉力
- 供給企業の交渉力
- 新規参入業者の脅威
- 代替品の脅威
- 競争の脅威
- 市況
第8章 市場セグメンテーション:エンドユーザー別
- 比較:エンドユーザー別
- 男性
- 女性
- 市場機会:エンドユーザー別
第9章 市場セグメンテーション:年齢層別
- 比較:年齢層別
- 35歳以下
- 35~54歳
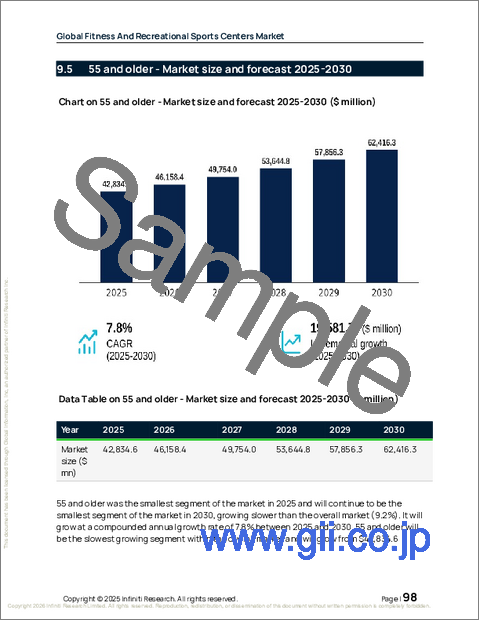
- 55歳以上
- 市場機会:年齢層別
第10章 市場セグメンテーション:サービスタイプ別
- 比較:サービスタイプ別
- ジムおよびフィットネスセンター
- スポーツクラブ
- ヨガ・ピラティススタジオ
- その他
- 市場機会:サービスタイプ別
第11章 顧客情勢
第12章 地域別情勢
- 地域別セグメンテーション
- 地域別比較
- 北米
- 米国
- カナダ
- メキシコ
- アジア太平洋
- 中国
- インド
- 日本
- 韓国
- オーストラリア
- インドネシア
- 欧州
- ドイツ
- 英国
- スペイン
- フランス
- イタリア
- オランダ
- 中東・アフリカ
- アラブ首長国連邦
- サウジアラビア
- 南アフリカ
- イスラエル
- トルコ
- 南米
- ブラジル
- アルゼンチン
- コロンビア
- 市場機会:地域別
第13章 促進要因・課題・機会
- 市場促進要因
- 市場の課題
- 促進要因と課題の影響
- 市場機会
第14章 競合情勢
- 概要
- 競合情勢
- 混乱の状況
- 業界のリスク
第15章 競合分析
- 企業プロファイル
- 企業ランキング指標
- 企業の市場ポジショニング
- 24 Hour Fitness USA LLC
- Anytime Fitness Franchisor LLC
- Crunch LLC
- Curves NA Inc.
- David Lloyd Leisure Ltd.
- Equinox Holdings Inc.
- FIT House of Brands
- Golds Gym Club Holding LLC
- Life Time Inc.
- Planet Fitness Inc.
- RSG Group GmbH
- Snap Fitness Inc
- The Gym Group
- Ultimate Fitness Group LLC
- Virgin Active Ltd.
