|
|
市場調査レポート
商品コード
1627081
プロテインサプリメントの世界市場 2024-2028年Global Protein Supplements Market 2024-2028 |
||||||

|
|||||||
カスタマイズ可能
|
|||||||


| プロテインサプリメントの世界市場 2024-2028年 |
|
出版日: 2024年08月12日
発行: TechNavio
ページ情報: 英文 175 Pages
納期: 即納可能
|

全表示
- 概要
- 図表
- 目次
プロテインサプリメント市場 2024-2028年
プロテインサプリメント市場は2023-2028年に129億米ドル、予測期間中のCAGRは8.89%で成長すると予測されます。当レポートでは、プロテインサプリメント市場の全体的な分析、市場規模・予測、動向、成長促進要因、課題、約25のベンダーを網羅したベンダー分析などを掲載しています。
現在の市場シナリオ、最新動向と促進要因、市場環境全体に関する最新分析を提供しています。市場は、スポーツやフィットネス活動への関心の高まり、疾病の可能性の低減と生活の質の向上、高齢化人口の増加によって牽引されています。
| 市場範囲 | |
|---|---|
| 基準年 | 2024 |
| 終了年 | 2028 |
| 予測期間 | 2024-2028 |
| 成長モメンタム | 加速 |
| 前年比2024年 | 8.23% |
| CAGR | 8.89% |
| 増分額 | 129億米ドル |
本調査では、有名人やスポーツ選手によるプロテインサプリメントの推奨が、今後数年間のプロテインサプリメント市場成長を牽引する主な要因の一つであるとしています。また、植物由来のプロテインサプリメントやクリーンラベル、透明包装のプロテインサプリメントの台頭は、市場の大きな需要につながります。
目次
第1章 エグゼクティブサマリー
- 市場概要
第2章 市場情勢
- 市場エコシステム
- 市場の特徴
- バリューチェーン分析
第3章 市場規模
- 市場の定義
- 市場セグメント分析
- 市場規模 2023
- 市場の見通し 2023-2028
第4章 市場規模実績
- プロテインサプリメントの世界市場 2018-2022
- 供給源別セグメント分析 2018-2022
- 流通チャネル別セグメント分析 2018-2022
- 地域別セグメント分析 2018-2022
- 国別セグメント分析 2018-2022
第5章 ファイブフォース分析
- ファイブフォースの要約
- 買い手の交渉力
- 供給企業の交渉力
- 新規参入業者の脅威
- 代替品の脅威
- 競争の脅威
- 市況
第6章 市場セグメンテーション:供給源別
- 市場セグメント
- 比較:供給源別
- 動物由来:市場規模と予測 2023-2028
- 植物由来:市場規模と予測 2023-2028
- 市場機会:供給源別
第7章 市場セグメンテーション:流通チャネル別
- 市場セグメント
- 比較:流通チャネル別
- 小売店:市場規模と予測 2023-2028
- オンラインストア:市場規模と予測 2023-2028
- 市場機会:流通チャネル別
第8章 顧客情勢
- 顧客情勢の概要
第9章 地域別情勢
- 地域別セグメンテーション
- 地域別比較
- 北米:市場規模と予測 2023-2028
- 欧州:市場規模と予測 2023-2028
- アジア太平洋:市場規模と予測 2023-2028
- 南米:市場規模と予測 2023-2028
- 中東・アフリカ:市場規模と予測 2023-2028
- 米国:市場規模と予測 2023-2028
- 中国:市場規模と予測 2023-2028
- フランス:市場規模と予測 2023-2028
- ドイツ:市場規模と予測 2023-2028
- ロシア:市場規模と予測 2023-2028
- 市場機会:地域情勢別
第10章 促進要因・課題・機会・抑制要因
- 市場促進要因
- 市場の課題
- 促進要因と課題の影響
- 市場の機会・抑制要因
第11章 競合情勢
- 概要
- 競合情勢
- 混乱の状況
- 業界のリスク
第12章 競合分析
- 企業プロファイル
- 企業の市場ポジショニング
- Abbott Laboratories
- Amway Corp.
- BioTech USA Korlatolt Felelossegu Tarsasag
- Darling Ingredients Inc.
- Gelita AG
- Glanbia plc
- GlaxoSmithKline Plc
- Herbalife International of America Inc.
- Iovate Health Sciences International Inc.
- Meiji Holdings Co. Ltd.
- Nestle SA
- PepsiCo Inc.
- Post Holdings Inc.
- THG Plc
- Weider Global Nutrition LLC
第13章 付録
Exhibits:
- Exhibits1: Executive Summary - Chart on Market Overview
- Exhibits2: Executive Summary - Data Table on Market Overview
- Exhibits3: Executive Summary - Chart on Global Market Characteristics
- Exhibits4: Executive Summary - Chart on Market By Geographical Landscape
- Exhibits5: Executive Summary - Chart on Market Segmentation by Source
- Exhibits6: Executive Summary - Chart on Market Segmentation by Distribution Channel
- Exhibits7: Executive Summary - Chart on Incremental Growth
- Exhibits8: Executive Summary - Data Table on Incremental Growth
- Exhibits9: Executive Summary - Chart on Company Market Positioning
- Exhibits10: Parent Market
- Exhibits11: Data Table on - Parent Market
- Exhibits12: Market characteristics analysis
- Exhibits13: Value Chain Analysis
- Exhibits14: Offerings of companies included in the market definition
- Exhibits15: Market segments
- Exhibits16: Chart on Global - Market size and forecast 2023-2028 ($ billion)
- Exhibits17: Data Table on Global - Market size and forecast 2023-2028 ($ billion)
- Exhibits18: Chart on Global Market: Year-over-year growth 2023-2028 (%)
- Exhibits19: Data Table on Global Market: Year-over-year growth 2023-2028 (%)
- Exhibits20: Historic Market Size - Data Table on Global Protein Supplements Market 2018 - 2022 ($ billion)
- Exhibits21: Historic Market Size - Source Segment 2018 - 2022 ($ billion)
- Exhibits22: Historic Market Size - Distribution Channel Segment 2018 - 2022 ($ billion)
- Exhibits23: Historic Market Size - Geography Segment 2018 - 2022 ($ billion)
- Exhibits24: Historic Market Size - Country Segment 2018 - 2022 ($ billion)
- Exhibits25: Five forces analysis - Comparison between 2023 and 2028
- Exhibits26: Bargaining power of buyers - Impact of key factors 2023 and 2028
- Exhibits27: Bargaining power of suppliers - Impact of key factors in 2023 and 2028
- Exhibits28: Threat of new entrants - Impact of key factors in 2023 and 2028
- Exhibits29: Threat of substitutes - Impact of key factors in 2023 and 2028
- Exhibits30: Threat of rivalry - Impact of key factors in 2023 and 2028
- Exhibits31: Chart on Market condition - Five forces 2023 and 2028
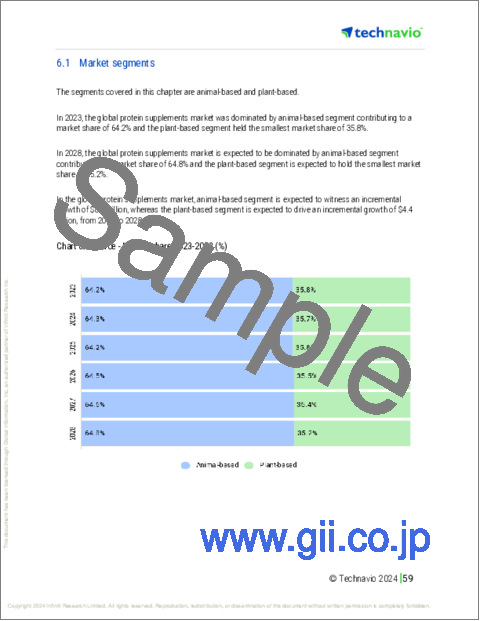
- Exhibits32: Chart on Source - Market share 2023-2028 (%)
- Exhibits33: Data Table on Source - Market share 2023-2028 (%)
- Exhibits34: Chart on Comparison by Source
- Exhibits35: Data Table on Comparison by Source
- Exhibits36: Chart on Animal-based - Market size and forecast 2023-2028 ($ billion)
- Exhibits37: Data Table on Animal-based - Market size and forecast 2023-2028 ($ billion)
- Exhibits38: Chart on Animal-based - Year-over-year growth 2023-2028 (%)
- Exhibits39: Data Table on Animal-based - Year-over-year growth 2023-2028 (%)
- Exhibits40: Chart on Plant-based - Market size and forecast 2023-2028 ($ billion)
- Exhibits41: Data Table on Plant-based - Market size and forecast 2023-2028 ($ billion)
- Exhibits42: Chart on Plant-based - Year-over-year growth 2023-2028 (%)
- Exhibits43: Data Table on Plant-based - Year-over-year growth 2023-2028 (%)
- Exhibits44: Market opportunity by Source ($ billion)
- Exhibits45: Data Table on Market opportunity by Source ($ billion)
- Exhibits46: Chart on Distribution Channel - Market share 2023-2028 (%)
- Exhibits47: Data Table on Distribution Channel - Market share 2023-2028 (%)
- Exhibits48: Chart on Comparison by Distribution Channel
- Exhibits49: Data Table on Comparison by Distribution Channel
- Exhibits50: Chart on Retail outlets - Market size and forecast 2023-2028 ($ billion)
- Exhibits51: Data Table on Retail outlets - Market size and forecast 2023-2028 ($ billion)
- Exhibits52: Chart on Retail outlets - Year-over-year growth 2023-2028 (%)
- Exhibits53: Data Table on Retail outlets - Year-over-year growth 2023-2028 (%)
- Exhibits54: Chart on Online stores - Market size and forecast 2023-2028 ($ billion)
- Exhibits55: Data Table on Online stores - Market size and forecast 2023-2028 ($ billion)
- Exhibits56: Chart on Online stores - Year-over-year growth 2023-2028 (%)
- Exhibits57: Data Table on Online stores - Year-over-year growth 2023-2028 (%)
- Exhibits58: Market opportunity by Distribution Channel ($ billion)
- Exhibits59: Data Table on Market opportunity by Distribution Channel ($ billion)
- Exhibits60: Analysis of price sensitivity, lifecycle, customer purchase basket, adoption rates, and purchase criteria
- Exhibits61: Chart on Market share By Geographical Landscape 2023-2028 (%)
- Exhibits62: Data Table on Market share By Geographical Landscape 2023-2028 (%)
- Exhibits63: Chart on Geographic comparison
- Exhibits64: Data Table on Geographic comparison
- Exhibits65: Chart on North America - Market size and forecast 2023-2028 ($ billion)
- Exhibits66: Data Table on North America - Market size and forecast 2023-2028 ($ billion)
- Exhibits67: Chart on North America - Year-over-year growth 2023-2028 (%)
- Exhibits68: Data Table on North America - Year-over-year growth 2023-2028 (%)
- Exhibits69: Chart on Europe - Market size and forecast 2023-2028 ($ billion)
- Exhibits70: Data Table on Europe - Market size and forecast 2023-2028 ($ billion)
- Exhibits71: Chart on Europe - Year-over-year growth 2023-2028 (%)
- Exhibits72: Data Table on Europe - Year-over-year growth 2023-2028 (%)
- Exhibits73: Chart on APAC - Market size and forecast 2023-2028 ($ billion)
- Exhibits74: Data Table on APAC - Market size and forecast 2023-2028 ($ billion)
- Exhibits75: Chart on APAC - Year-over-year growth 2023-2028 (%)
- Exhibits76: Data Table on APAC - Year-over-year growth 2023-2028 (%)
- Exhibits77: Chart on South America - Market size and forecast 2023-2028 ($ billion)
- Exhibits78: Data Table on South America - Market size and forecast 2023-2028 ($ billion)
- Exhibits79: Chart on South America - Year-over-year growth 2023-2028 (%)
- Exhibits80: Data Table on South America - Year-over-year growth 2023-2028 (%)
- Exhibits81: Chart on Middle East and Africa - Market size and forecast 2023-2028 ($ billion)
- Exhibits82: Data Table on Middle East and Africa - Market size and forecast 2023-2028 ($ billion)
- Exhibits83: Chart on Middle East and Africa - Year-over-year growth 2023-2028 (%)
- Exhibits84: Data Table on Middle East and Africa - Year-over-year growth 2023-2028 (%)
- Exhibits85: Chart on US - Market size and forecast 2023-2028 ($ billion)
- Exhibits86: Data Table on US - Market size and forecast 2023-2028 ($ billion)
- Exhibits87: Chart on US - Year-over-year growth 2023-2028 (%)
- Exhibits88: Data Table on US - Year-over-year growth 2023-2028 (%)
- Exhibits89: Chart on China - Market size and forecast 2023-2028 ($ billion)
- Exhibits90: Data Table on China - Market size and forecast 2023-2028 ($ billion)
- Exhibits91: Chart on China - Year-over-year growth 2023-2028 (%)
- Exhibits92: Data Table on China - Year-over-year growth 2023-2028 (%)
- Exhibits93: Chart on France - Market size and forecast 2023-2028 ($ billion)
- Exhibits94: Data Table on France - Market size and forecast 2023-2028 ($ billion)
- Exhibits95: Chart on France - Year-over-year growth 2023-2028 (%)
- Exhibits96: Data Table on France - Year-over-year growth 2023-2028 (%)
- Exhibits97: Chart on Germany - Market size and forecast 2023-2028 ($ billion)
- Exhibits98: Data Table on Germany - Market size and forecast 2023-2028 ($ billion)
- Exhibits99: Chart on Germany - Year-over-year growth 2023-2028 (%)
- Exhibits100: Data Table on Germany - Year-over-year growth 2023-2028 (%)
- Exhibits101: Chart on Russia - Market size and forecast 2023-2028 ($ billion)
- Exhibits102: Data Table on Russia - Market size and forecast 2023-2028 ($ billion)
- Exhibits103: Chart on Russia - Year-over-year growth 2023-2028 (%)
- Exhibits104: Data Table on Russia - Year-over-year growth 2023-2028 (%)
- Exhibits105: Market opportunity By Geographical Landscape ($ billion)
- Exhibits106: Data Tables on Market opportunity By Geographical Landscape ($ billion)
- Exhibits107: Impact of drivers and challenges in 2023 and 2028
- Exhibits108: Overview on criticality of inputs and factors of differentiation
- Exhibits109: Overview on factors of disruption
- Exhibits110: Impact of key risks on business
- Exhibits111: Companies covered
- Exhibits112: Matrix on companies position and classification
- Exhibits113: Abbott Laboratories - Overview
- Exhibits114: Abbott Laboratories - Business segments
- Exhibits115: Abbott Laboratories - Key news
- Exhibits116: Abbott Laboratories - Key offerings
- Exhibits117: Abbott Laboratories - Segment focus
- Exhibits118: Amway Corp. - Overview
- Exhibits119: Amway Corp. - Product / Service
- Exhibits120: Amway Corp. - Key news
- Exhibits121: Amway Corp. - Key offerings
- Exhibits122: BioTech USA Korlatolt Felelossegu Tarsasag - Overview
- Exhibits123: BioTech USA Korlatolt Felelossegu Tarsasag - Product / Service
- Exhibits124: BioTech USA Korlatolt Felelossegu Tarsasag - Key offerings
- Exhibits125: Darling Ingredients Inc. - Overview
- Exhibits126: Darling Ingredients Inc. - Business segments
- Exhibits127: Darling Ingredients Inc. - Key news
- Exhibits128: Darling Ingredients Inc. - Key offerings
- Exhibits129: Darling Ingredients Inc. - Segment focus
- Exhibits130: Gelita AG - Overview
- Exhibits131: Gelita AG - Product / Service
- Exhibits132: Gelita AG - Key offerings
- Exhibits133: Glanbia plc - Overview
- Exhibits134: Glanbia plc - Business segments
- Exhibits135: Glanbia plc - Key news
- Exhibits136: Glanbia plc - Key offerings
- Exhibits137: Glanbia plc - Segment focus
- Exhibits138: GlaxoSmithKline Plc - Overview
- Exhibits139: GlaxoSmithKline Plc - Business segments
- Exhibits140: GlaxoSmithKline Plc - Key news
- Exhibits141: GlaxoSmithKline Plc - Key offerings
- Exhibits142: GlaxoSmithKline Plc - Segment focus
- Exhibits143: Herbalife International of America Inc. - Overview
- Exhibits144: Herbalife International of America Inc. - Product / Service
- Exhibits145: Herbalife International of America Inc. - Key news
- Exhibits146: Herbalife International of America Inc. - Key offerings
- Exhibits147: Iovate Health Sciences International Inc. - Overview
- Exhibits148: Iovate Health Sciences International Inc. - Product / Service
- Exhibits149: Iovate Health Sciences International Inc. - Key offerings
- Exhibits150: Meiji Holdings Co. Ltd. - Overview
- Exhibits151: Meiji Holdings Co. Ltd. - Business segments
- Exhibits152: Meiji Holdings Co. Ltd. - Key news
- Exhibits153: Meiji Holdings Co. Ltd. - Key offerings
- Exhibits154: Meiji Holdings Co. Ltd. - Segment focus
- Exhibits155: Nestle SA - Overview
- Exhibits156: Nestle SA - Business segments
- Exhibits157: Nestle SA - Key news
- Exhibits158: Nestle SA - Key offerings
- Exhibits159: Nestle SA - Segment focus
- Exhibits160: PepsiCo Inc. - Overview
- Exhibits161: PepsiCo Inc. - Business segments
- Exhibits162: PepsiCo Inc. - Key news
- Exhibits163: PepsiCo Inc. - Key offerings
- Exhibits164: PepsiCo Inc. - Segment focus
- Exhibits165: Post Holdings Inc. - Overview
- Exhibits166: Post Holdings Inc. - Business segments
- Exhibits167: Post Holdings Inc. - Key news
- Exhibits168: Post Holdings Inc. - Key offerings
- Exhibits169: Post Holdings Inc. - Segment focus
- Exhibits170: THG Plc - Overview
- Exhibits171: THG Plc - Product / Service
- Exhibits172: THG Plc - Key offerings
- Exhibits173: Weider Global Nutrition LLC - Overview
- Exhibits174: Weider Global Nutrition LLC - Product / Service
- Exhibits175: Weider Global Nutrition LLC - Key offerings
- Exhibits176: Inclusions checklist
- Exhibits177: Exclusions checklist
- Exhibits178: Currency conversion rates for US$
- Exhibits179: Research methodology
- Exhibits180: Information sources
- Exhibits181: Data validation
- Exhibits182: Validation techniques employed for market sizing
- Exhibits183: Data synthesis
- Exhibits184: 360 degree market analysis
- Exhibits185: List of abbreviations
Protein Supplements Market 2024-2028
The protein supplements market is forecasted to grow by USD 12.9 bn during 2023-2028, accelerating at a CAGR of 8.89% during the forecast period. The report on the protein supplements market provides a holistic analysis, market size and forecast, trends, growth drivers, and challenges, as well as vendor analysis covering around 25 vendors.
The report offers an up-to-date analysis regarding the current market scenario, the latest trends and drivers, and the overall market environment. The market is driven by growing interest in sports and fitness activities, reduced chances of diseases and improved quality of life, and growing aging population.
| Market Scope | |
|---|---|
| Base Year | 2024 |
| End Year | 2028 |
| Series Year | 2024-2028 |
| Growth Momentum | Accelerate |
| YOY 2024 | 8.23% |
| CAGR | 8.89% |
| Incremental Value | $12.9 bn |
Technavio's protein supplements market is segmented as below:
By Source
- Animal-based
- Plant-based
By Distribution Channel
- Retail outlets
- Online stores
By Geographical Landscape
- North America
- Europe
- APAC
- South America
- Middle East and Africa
This study identifies the endorsements of protein supplements by celebrities and sportspersons as one of the prime reasons driving the protein supplements market growth during the next few years. Also, rise of plant-based protein supplements and clean label and transparency in packaging protein supplements will lead to sizable demand in the market.
The report on the protein supplements market covers the following areas:
- Protein Supplements Market sizing
- Protein Supplements Market forecast
- Protein Supplements Market industry analysis
The robust vendor analysis is designed to help clients improve their market position, and in line with this, this report provides a detailed analysis of several leading protein supplements market vendors that include Abbott Laboratories, Amway Corp., BioTech USA Korlatolt Felelossegu Tarsasag, Darling Ingredients Inc., Gelita AG, Glanbia plc, GlaxoSmithKline Plc, Herbalife International of America Inc., Iovate Health Sciences International Inc., Makers Nutrition LLC, Meiji Holdings Co. Ltd., Nestle SA, NOW Health Group Inc., PepsiCo Inc., Post Holdings Inc., Purus Labs, THG Plc, Transparent Labs, Vitaco Ltd., and Weider Global Nutrition LLC. Also, the protein supplements market analysis report includes information on upcoming trends and challenges that will influence market growth. This is to help companies strategize and leverage all forthcoming growth opportunities.
The study was conducted using an objective combination of primary and secondary information including inputs from key participants in the industry. The report contains a comprehensive market and vendor landscape in addition to an analysis of the key vendors.
The publisher presents a detailed picture of the market by the way of study, synthesis, and summation of data from multiple sources by an analysis of key parameters such as profit, pricing, competition, and promotions. It presents various market facets by identifying the key industry influencers. The data presented is comprehensive, reliable, and a result of extensive primary and secondary research. The market research reports provide a complete competitive landscape and an in-depth vendor selection methodology and analysis using qualitative and quantitative research to forecast accurate market growth.
Table of Contents
1 Executive Summary
- 1.1 Market overview
- Executive Summary - Chart on Market Overview
- Executive Summary - Data Table on Market Overview
- Executive Summary - Chart on Global Market Characteristics
- Executive Summary - Chart on Market By Geographical Landscape
- Executive Summary - Chart on Market Segmentation by Source
- Executive Summary - Chart on Market Segmentation by Distribution Channel
- Executive Summary - Chart on Incremental Growth
- Executive Summary - Data Table on Incremental Growth
- Executive Summary - Chart on Company Market Positioning
2 Market Landscape
- 2.1 Market ecosystem
- Parent Market
- Data Table on - Parent Market
- 2.2 Market characteristics
- Market characteristics analysis
- 2.3 Value chain analysis
- Value Chain Analysis
3 Market Sizing
- 3.1 Market definition
- Offerings of companies included in the market definition
- 3.2 Market segment analysis
- Market segments
- 3.3 Market size 2023
- 3.4 Market outlook: Forecast for 2023-2028
- Chart on Global - Market size and forecast 2023-2028 ($ billion)
- Data Table on Global - Market size and forecast 2023-2028 ($ billion)
- Chart on Global Market: Year-over-year growth 2023-2028 (%)
- Data Table on Global Market: Year-over-year growth 2023-2028 (%)
4 Historic Market Size
- 4.1 Global Protein Supplements Market 2018 - 2022
- Historic Market Size - Data Table on Global Protein Supplements Market 2018 - 2022 ($ billion)
- 4.2 Source segment analysis 2018 - 2022
- Historic Market Size - Source Segment 2018 - 2022 ($ billion)
- 4.3 Distribution Channel segment analysis 2018 - 2022
- Historic Market Size - Distribution Channel Segment 2018 - 2022 ($ billion)
- 4.4 Geography segment analysis 2018 - 2022
- Historic Market Size - Geography Segment 2018 - 2022 ($ billion)
- 4.5 Country segment analysis 2018 - 2022
- Historic Market Size - Country Segment 2018 - 2022 ($ billion)
5 Five Forces Analysis
- 5.1 Five forces summary
- Five forces analysis - Comparison between 2023 and 2028
- 5.2 Bargaining power of buyers
- Bargaining power of buyers - Impact of key factors 2023 and 2028
- 5.3 Bargaining power of suppliers
- Bargaining power of suppliers - Impact of key factors in 2023 and 2028
- 5.4 Threat of new entrants
- Threat of new entrants - Impact of key factors in 2023 and 2028
- 5.5 Threat of substitutes
- Threat of substitutes - Impact of key factors in 2023 and 2028
- 5.6 Threat of rivalry
- Threat of rivalry - Impact of key factors in 2023 and 2028
- 5.7 Market condition
- Chart on Market condition - Five forces 2023 and 2028
6 Market Segmentation by Source
- 6.1 Market segments
- Chart on Source - Market share 2023-2028 (%)
- Data Table on Source - Market share 2023-2028 (%)
- 6.2 Comparison by Source
- Chart on Comparison by Source
- Data Table on Comparison by Source
- 6.3 Animal-based - Market size and forecast 2023-2028
- Chart on Animal-based - Market size and forecast 2023-2028 ($ billion)
- Data Table on Animal-based - Market size and forecast 2023-2028 ($ billion)
- Chart on Animal-based - Year-over-year growth 2023-2028 (%)
- Data Table on Animal-based - Year-over-year growth 2023-2028 (%)
- 6.4 Plant-based - Market size and forecast 2023-2028
- Chart on Plant-based - Market size and forecast 2023-2028 ($ billion)
- Data Table on Plant-based - Market size and forecast 2023-2028 ($ billion)
- Chart on Plant-based - Year-over-year growth 2023-2028 (%)
- Data Table on Plant-based - Year-over-year growth 2023-2028 (%)
- 6.5 Market opportunity by Source
- Market opportunity by Source ($ billion)
- Data Table on Market opportunity by Source ($ billion)
7 Market Segmentation by Distribution Channel
- 7.1 Market segments
- Chart on Distribution Channel - Market share 2023-2028 (%)
- Data Table on Distribution Channel - Market share 2023-2028 (%)
- 7.2 Comparison by Distribution Channel
- Chart on Comparison by Distribution Channel
- Data Table on Comparison by Distribution Channel
- 7.3 Retail outlets - Market size and forecast 2023-2028
- Chart on Retail outlets - Market size and forecast 2023-2028 ($ billion)
- Data Table on Retail outlets - Market size and forecast 2023-2028 ($ billion)
- Chart on Retail outlets - Year-over-year growth 2023-2028 (%)
- Data Table on Retail outlets - Year-over-year growth 2023-2028 (%)
- 7.4 Online stores - Market size and forecast 2023-2028
- Chart on Online stores - Market size and forecast 2023-2028 ($ billion)
- Data Table on Online stores - Market size and forecast 2023-2028 ($ billion)
- Chart on Online stores - Year-over-year growth 2023-2028 (%)
- Data Table on Online stores - Year-over-year growth 2023-2028 (%)
- 7.5 Market opportunity by Distribution Channel
- Market opportunity by Distribution Channel ($ billion)
- Data Table on Market opportunity by Distribution Channel ($ billion)
8 Customer Landscape
- 8.1 Customer landscape overview
- Analysis of price sensitivity, lifecycle, customer purchase basket, adoption rates, and purchase criteria
9 Geographic Landscape
- 9.1 Geographic segmentation
- Chart on Market share By Geographical Landscape 2023-2028 (%)
- Data Table on Market share By Geographical Landscape 2023-2028 (%)
- 9.2 Geographic comparison
- Chart on Geographic comparison
- Data Table on Geographic comparison
- 9.3 North America - Market size and forecast 2023-2028
- Chart on North America - Market size and forecast 2023-2028 ($ billion)
- Data Table on North America - Market size and forecast 2023-2028 ($ billion)
- Chart on North America - Year-over-year growth 2023-2028 (%)
- Data Table on North America - Year-over-year growth 2023-2028 (%)
- 9.4 Europe - Market size and forecast 2023-2028
- Chart on Europe - Market size and forecast 2023-2028 ($ billion)
- Data Table on Europe - Market size and forecast 2023-2028 ($ billion)
- Chart on Europe - Year-over-year growth 2023-2028 (%)
- Data Table on Europe - Year-over-year growth 2023-2028 (%)
- 9.5 APAC - Market size and forecast 2023-2028
- Chart on APAC - Market size and forecast 2023-2028 ($ billion)
- Data Table on APAC - Market size and forecast 2023-2028 ($ billion)
- Chart on APAC - Year-over-year growth 2023-2028 (%)
- Data Table on APAC - Year-over-year growth 2023-2028 (%)
- 9.6 South America - Market size and forecast 2023-2028
- Chart on South America - Market size and forecast 2023-2028 ($ billion)
- Data Table on South America - Market size and forecast 2023-2028 ($ billion)
- Chart on South America - Year-over-year growth 2023-2028 (%)
- Data Table on South America - Year-over-year growth 2023-2028 (%)
- 9.7 Middle East and Africa - Market size and forecast 2023-2028
- Chart on Middle East and Africa - Market size and forecast 2023-2028 ($ billion)
- Data Table on Middle East and Africa - Market size and forecast 2023-2028 ($ billion)
- Chart on Middle East and Africa - Year-over-year growth 2023-2028 (%)
- Data Table on Middle East and Africa - Year-over-year growth 2023-2028 (%)
- 9.8 US - Market size and forecast 2023-2028
- Chart on US - Market size and forecast 2023-2028 ($ billion)
- Data Table on US - Market size and forecast 2023-2028 ($ billion)
- Chart on US - Year-over-year growth 2023-2028 (%)
- Data Table on US - Year-over-year growth 2023-2028 (%)
- 9.9 China - Market size and forecast 2023-2028
- Chart on China - Market size and forecast 2023-2028 ($ billion)
- Data Table on China - Market size and forecast 2023-2028 ($ billion)
- Chart on China - Year-over-year growth 2023-2028 (%)
- Data Table on China - Year-over-year growth 2023-2028 (%)
- 9.10 France - Market size and forecast 2023-2028
- Chart on France - Market size and forecast 2023-2028 ($ billion)
- Data Table on France - Market size and forecast 2023-2028 ($ billion)
- Chart on France - Year-over-year growth 2023-2028 (%)
- Data Table on France - Year-over-year growth 2023-2028 (%)
- 9.11 Germany - Market size and forecast 2023-2028
- Chart on Germany - Market size and forecast 2023-2028 ($ billion)
- Data Table on Germany - Market size and forecast 2023-2028 ($ billion)
- Chart on Germany - Year-over-year growth 2023-2028 (%)
- Data Table on Germany - Year-over-year growth 2023-2028 (%)
- 9.12 Russia - Market size and forecast 2023-2028
- Chart on Russia - Market size and forecast 2023-2028 ($ billion)
- Data Table on Russia - Market size and forecast 2023-2028 ($ billion)
- Chart on Russia - Year-over-year growth 2023-2028 (%)
- Data Table on Russia - Year-over-year growth 2023-2028 (%)
- 9.13 Market opportunity By Geographical Landscape
- Market opportunity By Geographical Landscape ($ billion)
- Data Tables on Market opportunity By Geographical Landscape ($ billion)
10 Drivers, Challenges, and Opportunity/Restraints
- 10.1 Market drivers
- 10.2 Market challenges
- 10.3 Impact of drivers and challenges
- Impact of drivers and challenges in 2023 and 2028
- 10.4 Market opportunities/restraints
11 Competitive Landscape
- 11.1 Overview
- 11.2 Competitive Landscape
- Overview on criticality of inputs and factors of differentiation
- 11.3 Landscape disruption
- Overview on factors of disruption
- 11.4 Industry risks
- Impact of key risks on business
12 Competitive Analysis
- 12.1 Companies profiled
- Companies covered
- 12.2 Market positioning of companies
- Matrix on companies position and classification
- 12.3 Abbott Laboratories
- Abbott Laboratories - Overview
- Abbott Laboratories - Business segments
- Abbott Laboratories - Key news
- Abbott Laboratories - Key offerings
- Abbott Laboratories - Segment focus
- 12.4 Amway Corp.
- Amway Corp. - Overview
- Amway Corp. - Product / Service
- Amway Corp. - Key news
- Amway Corp. - Key offerings
- 12.5 BioTech USA Korlatolt Felelossegu Tarsasag
- BioTech USA Korlatolt Felelossegu Tarsasag - Overview
- BioTech USA Korlatolt Felelossegu Tarsasag - Product / Service
- BioTech USA Korlatolt Felelossegu Tarsasag - Key offerings
- 12.6 Darling Ingredients Inc.
- Darling Ingredients Inc. - Overview
- Darling Ingredients Inc. - Business segments
- Darling Ingredients Inc. - Key news
- Darling Ingredients Inc. - Key offerings
- Darling Ingredients Inc. - Segment focus
- 12.7 Gelita AG
- Gelita AG - Overview
- Gelita AG - Product / Service
- Gelita AG - Key offerings
- 12.8 Glanbia plc
- Glanbia plc - Overview
- Glanbia plc - Business segments
- Glanbia plc - Key news
- Glanbia plc - Key offerings
- Glanbia plc - Segment focus
- 12.9 GlaxoSmithKline Plc
- GlaxoSmithKline Plc - Overview
- GlaxoSmithKline Plc - Business segments
- GlaxoSmithKline Plc - Key news
- GlaxoSmithKline Plc - Key offerings
- GlaxoSmithKline Plc - Segment focus
- 12.10 Herbalife International of America Inc.
- Herbalife International of America Inc. - Overview
- Herbalife International of America Inc. - Product / Service
- Herbalife International of America Inc. - Key news
- Herbalife International of America Inc. - Key offerings
- 12.11 Iovate Health Sciences International Inc.
- Iovate Health Sciences International Inc. - Overview
- Iovate Health Sciences International Inc. - Product / Service
- Iovate Health Sciences International Inc. - Key offerings
- 12.12 Meiji Holdings Co. Ltd.
- Meiji Holdings Co. Ltd. - Overview
- Meiji Holdings Co. Ltd. - Business segments
- Meiji Holdings Co. Ltd. - Key news
- Meiji Holdings Co. Ltd. - Key offerings
- Meiji Holdings Co. Ltd. - Segment focus
- 12.13 Nestle SA
- Nestle SA - Overview
- Nestle SA - Business segments
- Nestle SA - Key news
- Nestle SA - Key offerings
- Nestle SA - Segment focus
- 12.14 PepsiCo Inc.
- PepsiCo Inc. - Overview
- PepsiCo Inc. - Business segments
- PepsiCo Inc. - Key news
- PepsiCo Inc. - Key offerings
- PepsiCo Inc. - Segment focus
- 12.15 Post Holdings Inc.
- Post Holdings Inc. - Overview
- Post Holdings Inc. - Business segments
- Post Holdings Inc. - Key news
- Post Holdings Inc. - Key offerings
- Post Holdings Inc. - Segment focus
- 12.16 THG Plc
- THG Plc - Overview
- THG Plc - Product / Service
- THG Plc - Key offerings
- 12.17 Weider Global Nutrition LLC
- Weider Global Nutrition LLC - Overview
- Weider Global Nutrition LLC - Product / Service
- Weider Global Nutrition LLC - Key offerings
13 Appendix
- 13.1 Scope of the report
- 13.2 Inclusions and exclusions checklist
- Inclusions checklist
- Exclusions checklist
- 13.3 Currency conversion rates for US$
- Currency conversion rates for US$
- 13.4 Research methodology
- Research methodology
- 13.5 Data procurement
- Information sources
- 13.6 Data validation
- Data validation
- 13.7 Validation techniques employed for market sizing
- Validation techniques employed for market sizing
- 13.8 Data synthesis
- Data synthesis
- 13.9 360 degree market analysis
- 360 degree market analysis
- 13.10 List of abbreviations
- List of abbreviations
