|
|
市場調査レポート
商品コード
1936697
世界のミールキット市場2026-2030年Global Meal Kit Market 2026-2030 |
||||||
|
|||||||
カスタマイズ可能
|
|||||||

| 世界のミールキット市場2026-2030年 |
|
出版日: 2026年02月11日
発行: TechNavio
ページ情報: 英文 281 Pages
納期: 即納可能
|

概要
世界のミールキット市場は、2025年から2030年にかけて176億3,050万米ドルの成長が見込まれ、予測期間中のCAGRは13.2%と予測されています。
本報告書では、世界のミールキット市場に関する包括的な分析、市場規模と予測、動向、成長要因、課題に加え、約25社のベンダー分析を提供しております。
本レポートは、現在の市場状況、最新の動向と促進要因、市場環境全般に関する最新の分析を提供します。市場の成長は、パーソナライゼーションとAI駆動型料理カスタマイズの戦略的進化、超便利な加熱調理済み食品とサブスクリプション不要モデルの主流化、持続可能性要件の高まりと循環型包装の革新によって牽引されています。
本調査は、業界の主要関係者からの情報を含む一次情報と二次情報を客観的に組み合わせて実施されました。本レポートには、主要企業の分析に加え、包括的な市場規模データ、地域別分析を伴うセグメント、ベンダー情勢が含まれています。レポートには過去データと予測データが掲載されています。
| 市場範囲 | |
|---|---|
| 基準年 | 2026年 |
| 対象年度 | 2030年 |
| 予測期間 | 2026-2030 |
| 成長モメンタム | 加速 |
| 前年比2026年 | 11.9% |
| CAGR | 13.2% |
| 増分額 | 176億3,050万米ドル |
本調査では、今後数年間における世界のミールキット市場成長を牽引する主要要因の一つとして、オンデマンドの柔軟性への移行と定期購入の平均化解消を挙げております。また、ナック化(nackification)や小型栄養モジュールの普及、持続可能なコールドチェーン技術と天候適応型物流の統合が進むことで、市場において相当な需要が見込まれます。
目次
第1章 エグゼクティブサマリー
第2章 Technavio分析
- 価格・ライフサイクル・顧客購入バスケット・採用率・購入基準の分析
- インプットの重要性と差別化の要因
- 混乱の要因
- 促進要因と課題の影響
第3章 市場情勢
- 市場エコシステム
- 市場の特徴
- バリューチェーン分析
第4章 市場規模
- 市場の定義
- 市場セグメント分析
- 市場規模 2025
- 市場の見通し 2025-2030
第5章 市場規模実績
- 世界のミールキット市場 2020-2024
- 製品セグメント分析 2020-2024
- 流通チャネルセグメント分析 2020-2024
- タイプセグメント分析 2020-2024
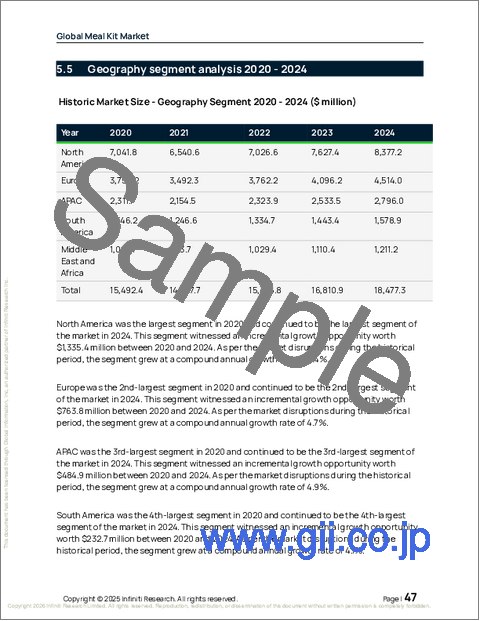
- 地域別セグメント分析 2020-2024
- 国別セグメント分析 2020-2024
第6章 定性分析
- AIの影響:世界のミールキット市場
第7章 ファイブフォース分析
- ファイブフォースの要約
- 買い手の交渉力
- 供給企業の交渉力
- 新規参入業者の脅威
- 代替品の脅威
- 競争の脅威
- 市況
第8章 市場セグメンテーション:製品別
- 比較:製品別
- 非菜食主義者向け
- ベジタリアン
- 市場機会:製品別
第9章 市場セグメンテーション:流通チャネル別
- 比較:流通チャネル別
- オンライン
- 店頭販売
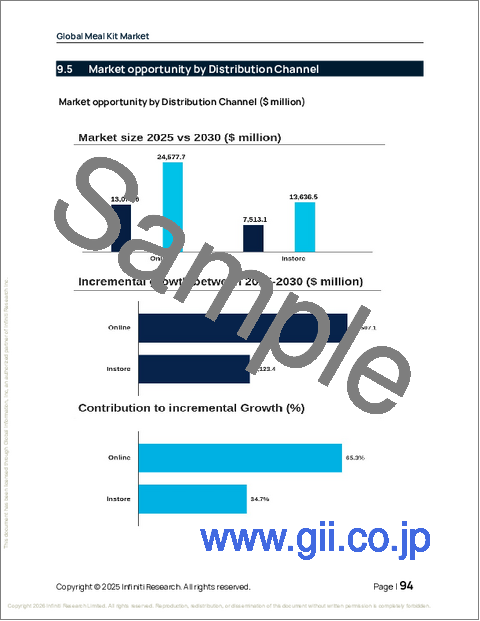
- 市場機会:流通チャネル別
第10章 市場セグメンテーション:タイプ別
- 比較:タイプ別
- 調理して食べる
- 温めて食べる
- 市場機会:タイプ別
第11章 顧客情勢
第12章 地域別情勢
- 地域別セグメンテーション
- 地域別比較
- 北米
- 米国
- カナダ
- メキシコ
- 欧州
- ドイツ
- 英国
- フランス
- イタリア
- スペイン
- オランダ
- アジア太平洋
- 中国
- インド
- 日本
- 韓国
- オーストラリア
- インドネシア
- 南米
- ブラジル
- アルゼンチン
- コロンビア
- 中東・アフリカ
- アラブ首長国連邦
- サウジアラビア
- 南アフリカ
- エジプト
- ナイジェリア
- 市場機会:地域別
第13章 促進要因・課題・機会
- 市場促進要因
- 市場の課題
- 促進要因と課題の影響
- 市場機会
第14章 競合情勢
- 概要
- 競合情勢
- 混乱の状況
- 業界のリスク
第15章 競合分析
- 企業プロファイル
- 企業ランキング指標
- 企業の市場ポジショニング
- Albertsons Companies Inc.
- Blue Apron LLC
- CookUnity Inc
- Epicured
- EveryPlate
- Gobble Inc.
- Gourmet Meal Delivery LLC
- Green Chef
- Hungryroot Inc
- Marley Spoon Inc.
- Oisix ra daichi Inc.
- Relish Labs LLC
- Riverford Organic Farmers Ltd.
- Sun Basket Inc.
- The Kroger Co.

