|
|
市場調査レポート
商品コード
1792185
眼科用デバイスの世界市場 2025-2029Global Ophthalmology Devices Market 2025-2029 |
||||||

|
|||||||
カスタマイズ可能
|
|||||||


| 眼科用デバイスの世界市場 2025-2029 |
|
出版日: 2025年08月08日
発行: TechNavio
ページ情報: 英文 234 Pages
納期: 即納可能
|

全表示
- 概要
- 図表
- 目次
眼科用デバイス市場は2024-2029年に165億6,580万米ドル、予測期間中のCAGRは7.4%で成長すると予測されます。
当レポートでは、眼科用デバイス市場の全体的な分析、市場規模・予測、動向、成長促進要因、課題、約25のベンダーを網羅したベンダー分析などを掲載しています。
現在の市場シナリオ、最新動向と促進要因、市場環境全体に関する最新分析を提供しています。市場は、眼科疾患の有病率の増加、眼科用デバイスの技術進歩、認知度向上と顧客トレーニングのためのイニシアティブの増加によって牽引されています。
| 市場範囲 | |
|---|---|
| 基準年 | 2025 |
| 終了年 | 2029 |
| 予測期間 | 2025-2029 |
| 成長モメンタム | 加速 |
| 前年比 | 6.6% |
| CAGR | 7.4% |
| 増分額 | 165億6,580万米ドル |
本調査は、業界の主要参加者からのインプットを含め、一次情報と二次情報を客観的に組み合わせて実施しました。レポートには、主要企業の分析に加え、包括的な市場規模データ、地域別分析によるセグメント、ベンダー情勢が含まれています。レポートは過去データと予測データを掲載しています。
本調査では、今後数年間における眼科用デバイス市場の成長を促進する主な理由の一つとして、低コストの眼科手術を目的とした医療ツーリズムの増加を挙げています。また、新興市場でのプレゼンス強化や戦略的提携、合併・買収に注力するベンダーの増加も、市場の大きな需要につながると思われます。
目次
第1章 エグゼクティブサマリー
- 市場概要
第2章 Technavio分析
- 価格・ライフサイクル・顧客購入バスケット・採用率・購入基準の分析
- インプットの重要性と差別化の要因
- 混乱の要因
- 促進要因と課題の影響
第3章 市場情勢
- 市場エコシステム
- 市場の特徴
- バリューチェーン分析
第4章 市場規模
- 市場の定義
- 市場セグメント分析
- 市場規模 2024
- 市場の見通し 2024-2029
第5章 市場規模実績
- 眼科用デバイスの世界市場 2019-2023
- 製品別セグメント分析 2019-2023
- エンドユーザー別セグメント分析 2019-2023
- 用途別セグメント分析 2019-2023
- 地域別セグメント分析 2019-2023
- 国別セグメント分析 2019-2023
第6章 定性分析
- AIの影響:眼科用デバイスの世界市場
第7章 ファイブフォース分析
- ファイブフォースの要約
- 買い手の交渉力
- 供給企業の交渉力
- 新規参入業者の脅威
- 代替品の脅威
- 競争の脅威
- 市況
第8章 市場セグメンテーション:製品別
- 市場セグメント
- 比較:製品別
- 視力ケア:市場規模と予測 2024-2029
- 眼科手術機器:市場規模と予測 2024-2029
- 眼科診断装置:市場規模と予測 2024-2029
- 市場機会:製品別
第9章 市場セグメンテーション:エンドユーザー別
- 市場セグメント
- 比較:エンドユーザー別
- 病院と眼科:市場規模と予測 2024-2029
- 学術調査室:市場規模と予測 2024-2029
- その他:市場規模と予測 2024-2029
- 市場機会:エンドユーザー別
第10章 市場セグメンテーション:用途別
- 市場セグメント
- 比較:用途別
- 白内障手術:市場規模と予測 2024-2029
- 診断とモニタリング:市場規模と予測 2024-2029
- 緑内障治療:市場規模と予測 2024-2029
- 硝子体網膜疾患の管理:市場規模と予測 2024-2029
- 屈折異常矯正:市場規模と予測 2024-2029
- 市場機会:用途別
第11章 顧客情勢
- 顧客情勢の概要
第12章 地域別情勢
- 地域別セグメンテーション
- 地域別比較
- 北米:市場規模と予測 2024-2029
- 欧州:市場規模と予測 2024-2029
- アジア:市場規模と予測 2024-2029
- 世界のその他の地域:市場規模と予測 2024-2029
- 米国:市場規模と予測 2024-2029
- 英国:市場規模と予測 2024-2029
- 中国:市場規模と予測 2024-2029
- ドイツ:市場規模と予測 2024-2029
- カナダ:市場規模と予測 2024-2029
- 日本:市場規模と予測 2024-2029
- フランス:市場規模と予測 2024-2029
- インド:市場規模と予測 2024-2029
- イタリア:市場規模と予測 2024-2029
- スペイン:市場規模と予測 2024-2029
- 市場機会:地域情勢別
第13章 促進要因・課題・機会・抑制要因
- 市場促進要因
- 市場の課題
- 促進要因と課題の影響
- 市場の機会・抑制要因
第14章 競合情勢
- 概要
- 競合情勢
- 混乱の状況
- 業界のリスク
第15章 競合分析
- 企業プロファイル
- 企業ランキング指数
- 企業の市場ポジショニング
- Alcon Inc.
- Bausch Health Companies Inc.
- Carl Zeiss AG
- Danaher Corp.
- Digital Diagnostics Inc.
- EssilorLuxottica
- EyeQue Corp.
- Glaukos Corp.
- HOYA CORP.
- IRIDEX Corp.
- Johnson and Johnson Services Inc.
- Lumenis Be Ltd.
- LUMIBIRD SA
- NIDEK Co. Ltd.
- The Cooper Companies Inc.
第16章 付録
Exhibits:
- Exhibits1: Executive Summary - Chart on Market Overview
- Exhibits2: Executive Summary - Data Table on Market Overview
- Exhibits3: Executive Summary - Chart on Global Market Characteristics
- Exhibits4: Executive Summary - Chart on Market By Geographical Landscape
- Exhibits5: Executive Summary - Chart on Market Segmentation by Product
- Exhibits6: Executive Summary - Chart on Market Segmentation by End-user
- Exhibits7: Executive Summary - Chart on Market Segmentation by Application
- Exhibits8: Executive Summary - Chart on Incremental Growth
- Exhibits9: Executive Summary - Data Table on Incremental Growth
- Exhibits10: Executive Summary - Chart on Company Market Positioning
- Exhibits11: Analysis of price sensitivity, lifecycle, customer purchase basket, adoption rates, and purchase criteria
- Exhibits12: Overview on criticality of inputs and factors of differentiation
- Exhibits13: Overview on factors of disruption
- Exhibits14: Impact of drivers and challenges in 2024 and 2029
- Exhibits15: Parent Market
- Exhibits16: Data Table on - Parent Market
- Exhibits17: Market characteristics analysis
- Exhibits18: Value chain analysis
- Exhibits19: Offerings of companies included in the market definition
- Exhibits20: Market segments
- Exhibits21: Chart on Global - Market size and forecast 2024-2029 ($ million)
- Exhibits22: Data Table on Global - Market size and forecast 2024-2029 ($ million)
- Exhibits23: Chart on Global Market: Year-over-year growth 2024-2029 (%)
- Exhibits24: Data Table on Global Market: Year-over-year growth 2024-2029 (%)
- Exhibits25: Historic Market Size - Data Table on Global Ophthalmology Devices Market 2019 - 2023 ($ million)
- Exhibits26: Historic Market Size - Product Segment 2019 - 2023 ($ million)
- Exhibits27: Historic Market Size - End-user Segment 2019 - 2023 ($ million)
- Exhibits28: Historic Market Size - Application Segment 2019 - 2023 ($ million)
- Exhibits29: Historic Market Size - Geography Segment 2019 - 2023 ($ million)
- Exhibits30: Historic Market Size - Country Segment 2019 - 2023 ($ million)
- Exhibits31: Five forces analysis - Comparison between 2024 and 2029
- Exhibits32: Bargaining power of buyers - Impact of key factors 2024 and 2029
- Exhibits33: Bargaining power of suppliers - Impact of key factors in 2024 and 2029
- Exhibits34: Threat of new entrants - Impact of key factors in 2024 and 2029
- Exhibits35: Threat of substitutes - Impact of key factors in 2024 and 2029
- Exhibits36: Threat of rivalry - Impact of key factors in 2024 and 2029
- Exhibits37: Chart on Market condition - Five forces 2024 and 2029
- Exhibits38: Chart on Product - Market share 2024-2029 (%)
- Exhibits39: Data Table on Product - Market share 2024-2029 (%)
- Exhibits40: Chart on Comparison by Product
- Exhibits41: Data Table on Comparison by Product
- Exhibits42: Chart on Vision care - Market size and forecast 2024-2029 ($ million)
- Exhibits43: Data Table on Vision care - Market size and forecast 2024-2029 ($ million)
- Exhibits44: Chart on Vision care - Year-over-year growth 2024-2029 (%)
- Exhibits45: Data Table on Vision care - Year-over-year growth 2024-2029 (%)
- Exhibits46: Chart on Ophthalmology surgical devices - Market size and forecast 2024-2029 ($ million)
- Exhibits47: Data Table on Ophthalmology surgical devices - Market size and forecast 2024-2029 ($ million)
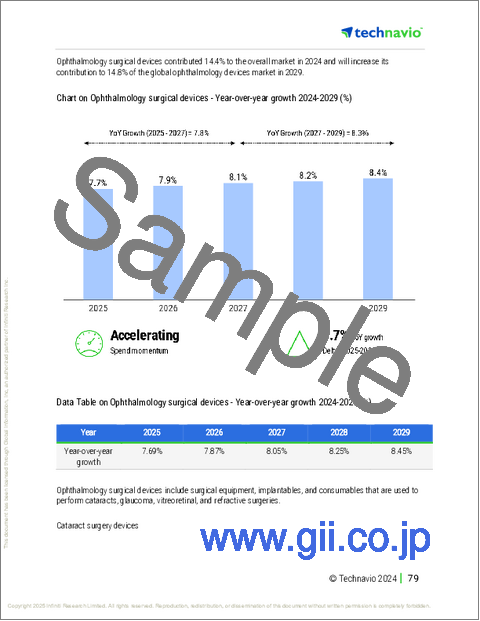
- Exhibits48: Chart on Ophthalmology surgical devices - Year-over-year growth 2024-2029 (%)
- Exhibits49: Data Table on Ophthalmology surgical devices - Year-over-year growth 2024-2029 (%)
- Exhibits50: Chart on Ophthalmology diagnostic devices - Market size and forecast 2024-2029 ($ million)
- Exhibits51: Data Table on Ophthalmology diagnostic devices - Market size and forecast 2024-2029 ($ million)
- Exhibits52: Chart on Ophthalmology diagnostic devices - Year-over-year growth 2024-2029 (%)
- Exhibits53: Data Table on Ophthalmology diagnostic devices - Year-over-year growth 2024-2029 (%)
- Exhibits54: Market opportunity by Product ($ million)
- Exhibits55: Data Table on Market opportunity by Product ($ million)
- Exhibits56: Chart on End-user - Market share 2024-2029 (%)
- Exhibits57: Data Table on End-user - Market share 2024-2029 (%)
- Exhibits58: Chart on Comparison by End-user
- Exhibits59: Data Table on Comparison by End-user
- Exhibits60: Chart on Hospitals and eye clinics - Market size and forecast 2024-2029 ($ million)
- Exhibits61: Data Table on Hospitals and eye clinics - Market size and forecast 2024-2029 ($ million)
- Exhibits62: Chart on Hospitals and eye clinics - Year-over-year growth 2024-2029 (%)
- Exhibits63: Data Table on Hospitals and eye clinics - Year-over-year growth 2024-2029 (%)
- Exhibits64: Chart on Academic and research laboratories - Market size and forecast 2024-2029 ($ million)
- Exhibits65: Data Table on Academic and research laboratories - Market size and forecast 2024-2029 ($ million)
- Exhibits66: Chart on Academic and research laboratories - Year-over-year growth 2024-2029 (%)
- Exhibits67: Data Table on Academic and research laboratories - Year-over-year growth 2024-2029 (%)
- Exhibits68: Chart on Others - Market size and forecast 2024-2029 ($ million)
- Exhibits69: Data Table on Others - Market size and forecast 2024-2029 ($ million)
- Exhibits70: Chart on Others - Year-over-year growth 2024-2029 (%)
- Exhibits71: Data Table on Others - Year-over-year growth 2024-2029 (%)
- Exhibits72: Market opportunity by End-user ($ million)
- Exhibits73: Data Table on Market opportunity by End-user ($ million)
- Exhibits74: Chart on Application - Market share 2024-2029 (%)
- Exhibits75: Data Table on Application - Market share 2024-2029 (%)
- Exhibits76: Chart on Comparison by Application
- Exhibits77: Data Table on Comparison by Application
- Exhibits78: Chart on Cataract surgery - Market size and forecast 2024-2029 ($ million)
- Exhibits79: Data Table on Cataract surgery - Market size and forecast 2024-2029 ($ million)
- Exhibits80: Chart on Cataract surgery - Year-over-year growth 2024-2029 (%)
- Exhibits81: Data Table on Cataract surgery - Year-over-year growth 2024-2029 (%)
- Exhibits82: Chart on Diagnosis and monitoring - Market size and forecast 2024-2029 ($ million)
- Exhibits83: Data Table on Diagnosis and monitoring - Market size and forecast 2024-2029 ($ million)
- Exhibits84: Chart on Diagnosis and monitoring - Year-over-year growth 2024-2029 (%)
- Exhibits85: Data Table on Diagnosis and monitoring - Year-over-year growth 2024-2029 (%)
- Exhibits86: Chart on Glaucoma treatment - Market size and forecast 2024-2029 ($ million)
- Exhibits87: Data Table on Glaucoma treatment - Market size and forecast 2024-2029 ($ million)
- Exhibits88: Chart on Glaucoma treatment - Year-over-year growth 2024-2029 (%)
- Exhibits89: Data Table on Glaucoma treatment - Year-over-year growth 2024-2029 (%)
- Exhibits90: Chart on Vitreo-retinal disorder management - Market size and forecast 2024-2029 ($ million)
- Exhibits91: Data Table on Vitreo-retinal disorder management - Market size and forecast 2024-2029 ($ million)
- Exhibits92: Chart on Vitreo-retinal disorder management - Year-over-year growth 2024-2029 (%)
- Exhibits93: Data Table on Vitreo-retinal disorder management - Year-over-year growth 2024-2029 (%)
- Exhibits94: Chart on Refractive error correction - Market size and forecast 2024-2029 ($ million)
- Exhibits95: Data Table on Refractive error correction - Market size and forecast 2024-2029 ($ million)
- Exhibits96: Chart on Refractive error correction - Year-over-year growth 2024-2029 (%)
- Exhibits97: Data Table on Refractive error correction - Year-over-year growth 2024-2029 (%)
- Exhibits98: Market opportunity by Application ($ million)
- Exhibits99: Data Table on Market opportunity by Application ($ million)
- Exhibits100: Analysis of price sensitivity, lifecycle, customer purchase basket, adoption rates, and purchase criteria
- Exhibits101: Chart on Market share By Geographical Landscape 2024-2029 (%)
- Exhibits102: Data Table on Market share By Geographical Landscape 2024-2029 (%)
- Exhibits103: Chart on Geographic comparison
- Exhibits104: Data Table on Geographic comparison
- Exhibits105: Chart on North America - Market size and forecast 2024-2029 ($ million)
- Exhibits106: Data Table on North America - Market size and forecast 2024-2029 ($ million)
- Exhibits107: Chart on North America - Year-over-year growth 2024-2029 (%)
- Exhibits108: Data Table on North America - Year-over-year growth 2024-2029 (%)
- Exhibits109: Chart on Europe - Market size and forecast 2024-2029 ($ million)
- Exhibits110: Data Table on Europe - Market size and forecast 2024-2029 ($ million)
- Exhibits111: Chart on Europe - Year-over-year growth 2024-2029 (%)
- Exhibits112: Data Table on Europe - Year-over-year growth 2024-2029 (%)
- Exhibits113: Chart on Asia - Market size and forecast 2024-2029 ($ million)
- Exhibits114: Data Table on Asia - Market size and forecast 2024-2029 ($ million)
- Exhibits115: Chart on Asia - Year-over-year growth 2024-2029 (%)
- Exhibits116: Data Table on Asia - Year-over-year growth 2024-2029 (%)
- Exhibits117: Chart on Rest of World (ROW) - Market size and forecast 2024-2029 ($ million)
- Exhibits118: Data Table on Rest of World (ROW) - Market size and forecast 2024-2029 ($ million)
- Exhibits119: Chart on Rest of World (ROW) - Year-over-year growth 2024-2029 (%)
- Exhibits120: Data Table on Rest of World (ROW) - Year-over-year growth 2024-2029 (%)
- Exhibits121: Chart on US - Market size and forecast 2024-2029 ($ million)
- Exhibits122: Data Table on US - Market size and forecast 2024-2029 ($ million)
- Exhibits123: Chart on US - Year-over-year growth 2024-2029 (%)
- Exhibits124: Data Table on US - Year-over-year growth 2024-2029 (%)
- Exhibits125: Chart on UK - Market size and forecast 2024-2029 ($ million)
- Exhibits126: Data Table on UK - Market size and forecast 2024-2029 ($ million)
- Exhibits127: Chart on UK - Year-over-year growth 2024-2029 (%)
- Exhibits128: Data Table on UK - Year-over-year growth 2024-2029 (%)
- Exhibits129: Chart on China - Market size and forecast 2024-2029 ($ million)
- Exhibits130: Data Table on China - Market size and forecast 2024-2029 ($ million)
- Exhibits131: Chart on China - Year-over-year growth 2024-2029 (%)
- Exhibits132: Data Table on China - Year-over-year growth 2024-2029 (%)
- Exhibits133: Chart on Germany - Market size and forecast 2024-2029 ($ million)
- Exhibits134: Data Table on Germany - Market size and forecast 2024-2029 ($ million)
- Exhibits135: Chart on Germany - Year-over-year growth 2024-2029 (%)
- Exhibits136: Data Table on Germany - Year-over-year growth 2024-2029 (%)
- Exhibits137: Chart on Canada - Market size and forecast 2024-2029 ($ million)
- Exhibits138: Data Table on Canada - Market size and forecast 2024-2029 ($ million)
- Exhibits139: Chart on Canada - Year-over-year growth 2024-2029 (%)
- Exhibits140: Data Table on Canada - Year-over-year growth 2024-2029 (%)
- Exhibits141: Chart on Japan - Market size and forecast 2024-2029 ($ million)
- Exhibits142: Data Table on Japan - Market size and forecast 2024-2029 ($ million)
- Exhibits143: Chart on Japan - Year-over-year growth 2024-2029 (%)
- Exhibits144: Data Table on Japan - Year-over-year growth 2024-2029 (%)
- Exhibits145: Chart on France - Market size and forecast 2024-2029 ($ million)
- Exhibits146: Data Table on France - Market size and forecast 2024-2029 ($ million)
- Exhibits147: Chart on France - Year-over-year growth 2024-2029 (%)
- Exhibits148: Data Table on France - Year-over-year growth 2024-2029 (%)
- Exhibits149: Chart on India - Market size and forecast 2024-2029 ($ million)
- Exhibits150: Data Table on India - Market size and forecast 2024-2029 ($ million)
- Exhibits151: Chart on India - Year-over-year growth 2024-2029 (%)
- Exhibits152: Data Table on India - Year-over-year growth 2024-2029 (%)
- Exhibits153: Chart on Italy - Market size and forecast 2024-2029 ($ million)
- Exhibits154: Data Table on Italy - Market size and forecast 2024-2029 ($ million)
- Exhibits155: Chart on Italy - Year-over-year growth 2024-2029 (%)
- Exhibits156: Data Table on Italy - Year-over-year growth 2024-2029 (%)
- Exhibits157: Chart on Spain - Market size and forecast 2024-2029 ($ million)
- Exhibits158: Data Table on Spain - Market size and forecast 2024-2029 ($ million)
- Exhibits159: Chart on Spain - Year-over-year growth 2024-2029 (%)
- Exhibits160: Data Table on Spain - Year-over-year growth 2024-2029 (%)
- Exhibits161: Market opportunity By Geographical Landscape ($ million)
- Exhibits162: Data Tables on Market opportunity By Geographical Landscape ($ million)
- Exhibits163: Impact of drivers and challenges in 2024 and 2029
- Exhibits164: Overview on criticality of inputs and factors of differentiation
- Exhibits165: Overview on factors of disruption
- Exhibits166: Impact of key risks on business
- Exhibits167: Companies covered
- Exhibits168: Company ranking index
- Exhibits169: Matrix on companies position and classification
- Exhibits170: Alcon Inc. - Overview
- Exhibits171: Alcon Inc. - Business segments
- Exhibits172: Alcon Inc. - Key news
- Exhibits173: Alcon Inc. - Key offerings
- Exhibits174: Alcon Inc. - Segment focus
- Exhibits175: SWOT
- Exhibits176: Bausch Health Companies Inc. - Overview
- Exhibits177: Bausch Health Companies Inc. - Business segments
- Exhibits178: Bausch Health Companies Inc. - Key news
- Exhibits179: Bausch Health Companies Inc. - Key offerings
- Exhibits180: Bausch Health Companies Inc. - Segment focus
- Exhibits181: SWOT
- Exhibits182: Carl Zeiss AG - Overview
- Exhibits183: Carl Zeiss AG - Product / Service
- Exhibits184: Carl Zeiss AG - Key news
- Exhibits185: Carl Zeiss AG - Key offerings
- Exhibits186: SWOT
- Exhibits187: Danaher Corp. - Overview
- Exhibits188: Danaher Corp. - Business segments
- Exhibits189: Danaher Corp. - Key news
- Exhibits190: Danaher Corp. - Key offerings
- Exhibits191: Danaher Corp. - Segment focus
- Exhibits192: SWOT
- Exhibits193: Digital Diagnostics Inc. - Overview
- Exhibits194: Digital Diagnostics Inc. - Product / Service
- Exhibits195: Digital Diagnostics Inc. - Key offerings
- Exhibits196: SWOT
- Exhibits197: EssilorLuxottica - Overview
- Exhibits198: EssilorLuxottica - Business segments
- Exhibits199: EssilorLuxottica - Key news
- Exhibits200: EssilorLuxottica - Key offerings
- Exhibits201: EssilorLuxottica - Segment focus
- Exhibits202: SWOT
- Exhibits203: EyeQue Corp. - Overview
- Exhibits204: EyeQue Corp. - Product / Service
- Exhibits205: EyeQue Corp. - Key offerings
- Exhibits206: SWOT
- Exhibits207: Glaukos Corp. - Overview
- Exhibits208: Glaukos Corp. - Product / Service
- Exhibits209: Glaukos Corp. - Key offerings
- Exhibits210: SWOT
- Exhibits211: HOYA CORP. - Overview
- Exhibits212: HOYA CORP. - Business segments
- Exhibits213: HOYA CORP. - Key offerings
- Exhibits214: HOYA CORP. - Segment focus
- Exhibits215: SWOT
- Exhibits216: IRIDEX Corp. - Overview
- Exhibits217: IRIDEX Corp. - Product / Service
- Exhibits218: IRIDEX Corp. - Key offerings
- Exhibits219: SWOT
- Exhibits220: Johnson and Johnson Services Inc. - Overview
- Exhibits221: Johnson and Johnson Services Inc. - Business segments
- Exhibits222: Johnson and Johnson Services Inc. - Key news
- Exhibits223: Johnson and Johnson Services Inc. - Key offerings
- Exhibits224: Johnson and Johnson Services Inc. - Segment focus
- Exhibits225: SWOT
- Exhibits226: Lumenis Be Ltd. - Overview
- Exhibits227: Lumenis Be Ltd. - Product / Service
- Exhibits228: Lumenis Be Ltd. - Key offerings
- Exhibits229: SWOT
- Exhibits230: LUMIBIRD SA - Overview
- Exhibits231: LUMIBIRD SA - Product / Service
- Exhibits232: LUMIBIRD SA - Key news
- Exhibits233: LUMIBIRD SA - Key offerings
- Exhibits234: SWOT
- Exhibits235: NIDEK Co. Ltd. - Overview
- Exhibits236: NIDEK Co. Ltd. - Business segments
- Exhibits237: NIDEK Co. Ltd. - Key news
- Exhibits238: NIDEK Co. Ltd. - Key offerings
- Exhibits239: NIDEK Co. Ltd. - Segment focus
- Exhibits240: SWOT
- Exhibits241: The Cooper Companies Inc. - Overview
- Exhibits242: The Cooper Companies Inc. - Business segments
- Exhibits243: The Cooper Companies Inc. - Key news
- Exhibits244: The Cooper Companies Inc. - Key offerings
- Exhibits245: The Cooper Companies Inc. - Segment focus
- Exhibits246: SWOT
- Exhibits247: Inclusions checklist
- Exhibits248: Exclusions checklist
- Exhibits249: Currency conversion rates for US$
- Exhibits250: Research methodology
- Exhibits251: Information sources
- Exhibits252: Data validation
- Exhibits253: Validation techniques employed for market sizing
- Exhibits254: Data synthesis
- Exhibits255: 360 degree market analysis
- Exhibits256: List of abbreviations
The ophthalmology devices market is forecasted to grow by USD 16,565.8 mn during 2024-2029, accelerating at a CAGR of 7.4% during the forecast period. The report on the ophthalmology devices market provides a holistic analysis, market size and forecast, trends, growth drivers, and challenges, as well as vendor analysis covering around 25 vendors.
The report offers an up-to-date analysis regarding the current market scenario, the latest trends and drivers, and the overall market environment. The market is driven by increasing prevalence of ophthalmic diseases, technological advances in ophthalmology devices, and rising number of initiatives to increase awareness and customer training.
| Market Scope | |
|---|---|
| Base Year | 2025 |
| End Year | 2029 |
| Series Year | 2025-2029 |
| Growth Momentum | Accelerate |
| YOY 2025 | 6.6% |
| CAGR | 7.4% |
| Incremental Value | $16,565.8 mn |
The study was conducted using an objective combination of primary and secondary information including inputs from key participants in the industry. The report contains a comprehensive market size data, segment with regional analysis and vendor landscape in addition to an analysis of the key companies. Reports have historic and forecast data.
Technavio's ophthalmology devices market is segmented as below:
By Product
- Vision care
- Ophthalmology surgical devices
- Ophthalmology diagnostic devices
By End-user
- Hospitals and eye clinics
- Academic and research laboratories
- Others
By Application
- Cataract surgery
- Diagnosis and monitoring
- Glaucoma treatment
- Vitreo-retinal disorder management
- Refractive error correction
By Geographical Landscape
- North America
- Europe
- Asia
- Rest of World (ROW)
This study identifies the increasing medical tourism for low-cost ophthalmology surgeries as one of the prime reasons driving the ophthalmology devices market growth during the next few years. Also, rising focus of vendors to strengthen their presence in emerging markets and strategic collaborations and merger and aquisition will lead to sizable demand in the market.
The report on the ophthalmology devices market covers the following areas:
- Ophthalmology Devices Market sizing
- Ophthalmology Devices Market forecast
- Ophthalmology Devices Market industry analysis
The robust vendor analysis is designed to help clients improve their market position, and in line with this, this report provides a detailed analysis of several leading ophthalmology devices market vendors that include Alcon Inc., Bausch Health Companies Inc., Carl Zeiss AG, Danaher Corp., Digital Diagnostics Inc., EssilorLuxottica, EyeQue Corp., Glaukos Corp., HOYA CORP., IRIDEX Corp., Johnson and Johnson Services Inc., Lumenis Be Ltd., LUMIBIRD SA, Metall Zug AG, NIDEK Co. Ltd., The Cooper Companies Inc., Topcon Corp., and Ziemer Ophthalmic Systems AG. Also, the ophthalmology devices market analysis report includes information on upcoming trends and challenges that will influence market growth. This is to help companies strategize and leverage all forthcoming growth opportunities.
The publisher presents a detailed picture of the market by the way of study, synthesis, and summation of data from multiple sources by an analysis of key parameters such as profit, pricing, competition, and promotions. It presents various market facets by identifying the key industry influencers. The data presented is comprehensive, reliable, and a result of extensive primary and secondary research. The market research reports provide a complete competitive landscape and an in-depth vendor selection methodology and analysis using qualitative and quantitative research to forecast accurate market growth.
Table of Contents
1 Executive Summary
- 1.1 Market overview
- Executive Summary - Chart on Market Overview
- Executive Summary - Data Table on Market Overview
- Executive Summary - Chart on Global Market Characteristics
- Executive Summary - Chart on Market By Geographical Landscape
- Executive Summary - Chart on Market Segmentation by Product
- Executive Summary - Chart on Market Segmentation by End-user
- Executive Summary - Chart on Market Segmentation by Application
- Executive Summary - Chart on Incremental Growth
- Executive Summary - Data Table on Incremental Growth
- Executive Summary - Chart on Company Market Positioning
2 Technavio Analysis
- 2.1 Analysis of price sensitivity, lifecycle, customer purchase basket, adoption rates, and purchase criteria
- Analysis of price sensitivity, lifecycle, customer purchase basket, adoption rates, and purchase criteria
- 2.2 Criticality of inputs and Factors of differentiation
- Overview on criticality of inputs and factors of differentiation
- 2.3 Factors of disruption
- Overview on factors of disruption
- 2.4 Impact of drivers and challenges
- Impact of drivers and challenges in 2024 and 2029
3 Market Landscape
- 3.1 Market ecosystem
- Parent Market
- Data Table on - Parent Market
- 3.2 Market characteristics
- Market characteristics analysis
- 3.3 Value chain analysis
- Value chain analysis
4 Market Sizing
- 4.1 Market definition
- Offerings of companies included in the market definition
- 4.2 Market segment analysis
- Market segments
- 4.3 Market size 2024
- 4.4 Market outlook: Forecast for 2024-2029
- Chart on Global - Market size and forecast 2024-2029 ($ million)
- Data Table on Global - Market size and forecast 2024-2029 ($ million)
- Chart on Global Market: Year-over-year growth 2024-2029 (%)
- Data Table on Global Market: Year-over-year growth 2024-2029 (%)
5 Historic Market Size
- 5.1 Global Ophthalmology Devices Market 2019 - 2023
- Historic Market Size - Data Table on Global Ophthalmology Devices Market 2019 - 2023 ($ million)
- 5.2 Product segment analysis 2019 - 2023
- Historic Market Size - Product Segment 2019 - 2023 ($ million)
- 5.3 End-user segment analysis 2019 - 2023
- Historic Market Size - End-user Segment 2019 - 2023 ($ million)
- 5.4 Application segment analysis 2019 - 2023
- Historic Market Size - Application Segment 2019 - 2023 ($ million)
- 5.5 Geography segment analysis 2019 - 2023
- Historic Market Size - Geography Segment 2019 - 2023 ($ million)
- 5.6 Country segment analysis 2019 - 2023
- Historic Market Size - Country Segment 2019 - 2023 ($ million)
6 Qualitative Analysis
- 6.1 The AI impact on Global Ophthalmology devices Market
7 Five Forces Analysis
- 7.1 Five forces summary
- Five forces analysis - Comparison between 2024 and 2029
- 7.2 Bargaining power of buyers
- Bargaining power of buyers - Impact of key factors 2024 and 2029
- 7.3 Bargaining power of suppliers
- Bargaining power of suppliers - Impact of key factors in 2024 and 2029
- 7.4 Threat of new entrants
- Threat of new entrants - Impact of key factors in 2024 and 2029
- 7.5 Threat of substitutes
- Threat of substitutes - Impact of key factors in 2024 and 2029
- 7.6 Threat of rivalry
- Threat of rivalry - Impact of key factors in 2024 and 2029
- 7.7 Market condition
- Chart on Market condition - Five forces 2024 and 2029
8 Market Segmentation by Product
- 8.1 Market segments
- Chart on Product - Market share 2024-2029 (%)
- Data Table on Product - Market share 2024-2029 (%)
- 8.2 Comparison by Product
- Chart on Comparison by Product
- Data Table on Comparison by Product
- 8.3 Vision care - Market size and forecast 2024-2029
- Chart on Vision care - Market size and forecast 2024-2029 ($ million)
- Data Table on Vision care - Market size and forecast 2024-2029 ($ million)
- Chart on Vision care - Year-over-year growth 2024-2029 (%)
- Data Table on Vision care - Year-over-year growth 2024-2029 (%)
- 8.4 Ophthalmology surgical devices - Market size and forecast 2024-2029
- Chart on Ophthalmology surgical devices - Market size and forecast 2024-2029 ($ million)
- Data Table on Ophthalmology surgical devices - Market size and forecast 2024-2029 ($ million)
- Chart on Ophthalmology surgical devices - Year-over-year growth 2024-2029 (%)
- Data Table on Ophthalmology surgical devices - Year-over-year growth 2024-2029 (%)
- 8.5 Ophthalmology diagnostic devices - Market size and forecast 2024-2029
- Chart on Ophthalmology diagnostic devices - Market size and forecast 2024-2029 ($ million)
- Data Table on Ophthalmology diagnostic devices - Market size and forecast 2024-2029 ($ million)
- Chart on Ophthalmology diagnostic devices - Year-over-year growth 2024-2029 (%)
- Data Table on Ophthalmology diagnostic devices - Year-over-year growth 2024-2029 (%)
- 8.6 Market opportunity by Product
- Market opportunity by Product ($ million)
- Data Table on Market opportunity by Product ($ million)
9 Market Segmentation by End-user
- 9.1 Market segments
- Chart on End-user - Market share 2024-2029 (%)
- Data Table on End-user - Market share 2024-2029 (%)
- 9.2 Comparison by End-user
- Chart on Comparison by End-user
- Data Table on Comparison by End-user
- 9.3 Hospitals and eye clinics - Market size and forecast 2024-2029
- Chart on Hospitals and eye clinics - Market size and forecast 2024-2029 ($ million)
- Data Table on Hospitals and eye clinics - Market size and forecast 2024-2029 ($ million)
- Chart on Hospitals and eye clinics - Year-over-year growth 2024-2029 (%)
- Data Table on Hospitals and eye clinics - Year-over-year growth 2024-2029 (%)
- 9.4 Academic and research laboratories - Market size and forecast 2024-2029
- Chart on Academic and research laboratories - Market size and forecast 2024-2029 ($ million)
- Data Table on Academic and research laboratories - Market size and forecast 2024-2029 ($ million)
- Chart on Academic and research laboratories - Year-over-year growth 2024-2029 (%)
- Data Table on Academic and research laboratories - Year-over-year growth 2024-2029 (%)
- 9.5 Others - Market size and forecast 2024-2029
- Chart on Others - Market size and forecast 2024-2029 ($ million)
- Data Table on Others - Market size and forecast 2024-2029 ($ million)
- Chart on Others - Year-over-year growth 2024-2029 (%)
- Data Table on Others - Year-over-year growth 2024-2029 (%)
- 9.6 Market opportunity by End-user
- Market opportunity by End-user ($ million)
- Data Table on Market opportunity by End-user ($ million)
10 Market Segmentation by Application
- 10.1 Market segments
- Chart on Application - Market share 2024-2029 (%)
- Data Table on Application - Market share 2024-2029 (%)
- 10.2 Comparison by Application
- Chart on Comparison by Application
- Data Table on Comparison by Application
- 10.3 Cataract surgery - Market size and forecast 2024-2029
- Chart on Cataract surgery - Market size and forecast 2024-2029 ($ million)
- Data Table on Cataract surgery - Market size and forecast 2024-2029 ($ million)
- Chart on Cataract surgery - Year-over-year growth 2024-2029 (%)
- Data Table on Cataract surgery - Year-over-year growth 2024-2029 (%)
- 10.4 Diagnosis and monitoring - Market size and forecast 2024-2029
- Chart on Diagnosis and monitoring - Market size and forecast 2024-2029 ($ million)
- Data Table on Diagnosis and monitoring - Market size and forecast 2024-2029 ($ million)
- Chart on Diagnosis and monitoring - Year-over-year growth 2024-2029 (%)
- Data Table on Diagnosis and monitoring - Year-over-year growth 2024-2029 (%)
- 10.5 Glaucoma treatment - Market size and forecast 2024-2029
- Chart on Glaucoma treatment - Market size and forecast 2024-2029 ($ million)
- Data Table on Glaucoma treatment - Market size and forecast 2024-2029 ($ million)
- Chart on Glaucoma treatment - Year-over-year growth 2024-2029 (%)
- Data Table on Glaucoma treatment - Year-over-year growth 2024-2029 (%)
- 10.6 Vitreo-retinal disorder management - Market size and forecast 2024-2029
- Chart on Vitreo-retinal disorder management - Market size and forecast 2024-2029 ($ million)
- Data Table on Vitreo-retinal disorder management - Market size and forecast 2024-2029 ($ million)
- Chart on Vitreo-retinal disorder management - Year-over-year growth 2024-2029 (%)
- Data Table on Vitreo-retinal disorder management - Year-over-year growth 2024-2029 (%)
- 10.7 Refractive error correction - Market size and forecast 2024-2029
- Chart on Refractive error correction - Market size and forecast 2024-2029 ($ million)
- Data Table on Refractive error correction - Market size and forecast 2024-2029 ($ million)
- Chart on Refractive error correction - Year-over-year growth 2024-2029 (%)
- Data Table on Refractive error correction - Year-over-year growth 2024-2029 (%)
- 10.8 Market opportunity by Application
- Market opportunity by Application ($ million)
- Data Table on Market opportunity by Application ($ million)
11 Customer Landscape
- 11.1 Customer landscape overview
- Analysis of price sensitivity, lifecycle, customer purchase basket, adoption rates, and purchase criteria
12 Geographic Landscape
- 12.1 Geographic segmentation
- Chart on Market share By Geographical Landscape 2024-2029 (%)
- Data Table on Market share By Geographical Landscape 2024-2029 (%)
- 12.2 Geographic comparison
- Chart on Geographic comparison
- Data Table on Geographic comparison
- 12.3 North America - Market size and forecast 2024-2029
- Chart on North America - Market size and forecast 2024-2029 ($ million)
- Data Table on North America - Market size and forecast 2024-2029 ($ million)
- Chart on North America - Year-over-year growth 2024-2029 (%)
- Data Table on North America - Year-over-year growth 2024-2029 (%)
- 12.4 Europe - Market size and forecast 2024-2029
- Chart on Europe - Market size and forecast 2024-2029 ($ million)
- Data Table on Europe - Market size and forecast 2024-2029 ($ million)
- Chart on Europe - Year-over-year growth 2024-2029 (%)
- Data Table on Europe - Year-over-year growth 2024-2029 (%)
- 12.5 Asia - Market size and forecast 2024-2029
- Chart on Asia - Market size and forecast 2024-2029 ($ million)
- Data Table on Asia - Market size and forecast 2024-2029 ($ million)
- Chart on Asia - Year-over-year growth 2024-2029 (%)
- Data Table on Asia - Year-over-year growth 2024-2029 (%)
- 12.6 Rest of World (ROW) - Market size and forecast 2024-2029
- Chart on Rest of World (ROW) - Market size and forecast 2024-2029 ($ million)
- Data Table on Rest of World (ROW) - Market size and forecast 2024-2029 ($ million)
- Chart on Rest of World (ROW) - Year-over-year growth 2024-2029 (%)
- Data Table on Rest of World (ROW) - Year-over-year growth 2024-2029 (%)
- 12.7 US - Market size and forecast 2024-2029
- Chart on US - Market size and forecast 2024-2029 ($ million)
- Data Table on US - Market size and forecast 2024-2029 ($ million)
- Chart on US - Year-over-year growth 2024-2029 (%)
- Data Table on US - Year-over-year growth 2024-2029 (%)
- 12.8 UK - Market size and forecast 2024-2029
- Chart on UK - Market size and forecast 2024-2029 ($ million)
- Data Table on UK - Market size and forecast 2024-2029 ($ million)
- Chart on UK - Year-over-year growth 2024-2029 (%)
- Data Table on UK - Year-over-year growth 2024-2029 (%)
- 12.9 China - Market size and forecast 2024-2029
- Chart on China - Market size and forecast 2024-2029 ($ million)
- Data Table on China - Market size and forecast 2024-2029 ($ million)
- Chart on China - Year-over-year growth 2024-2029 (%)
- Data Table on China - Year-over-year growth 2024-2029 (%)
- 12.10 Germany - Market size and forecast 2024-2029
- Chart on Germany - Market size and forecast 2024-2029 ($ million)
- Data Table on Germany - Market size and forecast 2024-2029 ($ million)
- Chart on Germany - Year-over-year growth 2024-2029 (%)
- Data Table on Germany - Year-over-year growth 2024-2029 (%)
- 12.11 Canada - Market size and forecast 2024-2029
- Chart on Canada - Market size and forecast 2024-2029 ($ million)
- Data Table on Canada - Market size and forecast 2024-2029 ($ million)
- Chart on Canada - Year-over-year growth 2024-2029 (%)
- Data Table on Canada - Year-over-year growth 2024-2029 (%)
- 12.12 Japan - Market size and forecast 2024-2029
- Chart on Japan - Market size and forecast 2024-2029 ($ million)
- Data Table on Japan - Market size and forecast 2024-2029 ($ million)
- Chart on Japan - Year-over-year growth 2024-2029 (%)
- Data Table on Japan - Year-over-year growth 2024-2029 (%)
- 12.13 France - Market size and forecast 2024-2029
- Chart on France - Market size and forecast 2024-2029 ($ million)
- Data Table on France - Market size and forecast 2024-2029 ($ million)
- Chart on France - Year-over-year growth 2024-2029 (%)
- Data Table on France - Year-over-year growth 2024-2029 (%)
- 12.14 India - Market size and forecast 2024-2029
- Chart on India - Market size and forecast 2024-2029 ($ million)
- Data Table on India - Market size and forecast 2024-2029 ($ million)
- Chart on India - Year-over-year growth 2024-2029 (%)
- Data Table on India - Year-over-year growth 2024-2029 (%)
- 12.15 Italy - Market size and forecast 2024-2029
- Chart on Italy - Market size and forecast 2024-2029 ($ million)
- Data Table on Italy - Market size and forecast 2024-2029 ($ million)
- Chart on Italy - Year-over-year growth 2024-2029 (%)
- Data Table on Italy - Year-over-year growth 2024-2029 (%)
- 12.16 Spain - Market size and forecast 2024-2029
- Chart on Spain - Market size and forecast 2024-2029 ($ million)
- Data Table on Spain - Market size and forecast 2024-2029 ($ million)
- Chart on Spain - Year-over-year growth 2024-2029 (%)
- Data Table on Spain - Year-over-year growth 2024-2029 (%)
- 12.17 Market opportunity By Geographical Landscape
- Market opportunity By Geographical Landscape ($ million)
- Data Tables on Market opportunity By Geographical Landscape ($ million)
13 Drivers, Challenges, and Opportunity/Restraints
- 13.1 Market drivers
- 13.2 Market challenges
- 13.3 Impact of drivers and challenges
- Impact of drivers and challenges in 2024 and 2029
- 13.4 Market opportunities/restraints
14 Competitive Landscape
- 14.1 Overview
- 14.2 Competitive Landscape
- Overview on criticality of inputs and factors of differentiation
- 14.3 Landscape disruption
- Overview on factors of disruption
- 14.4 Industry risks
- Impact of key risks on business
15 Competitive Analysis
- 15.1 Companies profiled
- Companies covered
- 15.2 Company ranking index
- Company ranking index
- 15.3 Market positioning of companies
- Matrix on companies position and classification
- 15.4 Alcon Inc.
- Alcon Inc. - Overview
- Alcon Inc. - Business segments
- Alcon Inc. - Key news
- Alcon Inc. - Key offerings
- Alcon Inc. - Segment focus
- SWOT
- 15.5 Bausch Health Companies Inc.
- Bausch Health Companies Inc. - Overview
- Bausch Health Companies Inc. - Business segments
- Bausch Health Companies Inc. - Key news
- Bausch Health Companies Inc. - Key offerings
- Bausch Health Companies Inc. - Segment focus
- SWOT
- 15.6 Carl Zeiss AG
- Carl Zeiss AG - Overview
- Carl Zeiss AG - Product / Service
- Carl Zeiss AG - Key news
- Carl Zeiss AG - Key offerings
- SWOT
- 15.7 Danaher Corp.
- Danaher Corp. - Overview
- Danaher Corp. - Business segments
- Danaher Corp. - Key news
- Danaher Corp. - Key offerings
- Danaher Corp. - Segment focus
- SWOT
- 15.8 Digital Diagnostics Inc.
- Digital Diagnostics Inc. - Overview
- Digital Diagnostics Inc. - Product / Service
- Digital Diagnostics Inc. - Key offerings
- SWOT
- 15.9 EssilorLuxottica
- EssilorLuxottica - Overview
- EssilorLuxottica - Business segments
- EssilorLuxottica - Key news
- EssilorLuxottica - Key offerings
- EssilorLuxottica - Segment focus
- SWOT
- 15.10 EyeQue Corp.
- EyeQue Corp. - Overview
- EyeQue Corp. - Product / Service
- EyeQue Corp. - Key offerings
- SWOT
- 15.11 Glaukos Corp.
- Glaukos Corp. - Overview
- Glaukos Corp. - Product / Service
- Glaukos Corp. - Key offerings
- SWOT
- 15.12 HOYA CORP.
- HOYA CORP. - Overview
- HOYA CORP. - Business segments
- HOYA CORP. - Key offerings
- HOYA CORP. - Segment focus
- SWOT
- 15.13 IRIDEX Corp.
- IRIDEX Corp. - Overview
- IRIDEX Corp. - Product / Service
- IRIDEX Corp. - Key offerings
- SWOT
- 15.14 Johnson and Johnson Services Inc.
- Johnson and Johnson Services Inc. - Overview
- Johnson and Johnson Services Inc. - Business segments
- Johnson and Johnson Services Inc. - Key news
- Johnson and Johnson Services Inc. - Key offerings
- Johnson and Johnson Services Inc. - Segment focus
- SWOT
- 15.15 Lumenis Be Ltd.
- Lumenis Be Ltd. - Overview
- Lumenis Be Ltd. - Product / Service
- Lumenis Be Ltd. - Key offerings
- SWOT
- 15.16 LUMIBIRD SA
- LUMIBIRD SA - Overview
- LUMIBIRD SA - Product / Service
- LUMIBIRD SA - Key news
- LUMIBIRD SA - Key offerings
- SWOT
- 15.17 NIDEK Co. Ltd.
- NIDEK Co. Ltd. - Overview
- NIDEK Co. Ltd. - Business segments
- NIDEK Co. Ltd. - Key news
- NIDEK Co. Ltd. - Key offerings
- NIDEK Co. Ltd. - Segment focus
- SWOT
- 15.18 The Cooper Companies Inc.
- The Cooper Companies Inc. - Overview
- The Cooper Companies Inc. - Business segments
- The Cooper Companies Inc. - Key news
- The Cooper Companies Inc. - Key offerings
- The Cooper Companies Inc. - Segment focus
- SWOT
16 Appendix
- 16.1 Scope of the report
- 16.2 Inclusions and exclusions checklist
- Inclusions checklist
- Exclusions checklist
- 16.3 Currency conversion rates for US$
- Currency conversion rates for US$
- 16.4 Research methodology
- Research methodology
- 16.5 Data procurement
- Information sources
- 16.6 Data validation
- Data validation
- 16.7 Validation techniques employed for market sizing
- Validation techniques employed for market sizing
- 16.8 Data synthesis
- Data synthesis
- 16.9 360 degree market analysis
- 360 degree market analysis
- 16.10 List of abbreviations
- List of abbreviations
