|
|
市場調査レポート
商品コード
1626384
軍事用サーマルウェポンサイトの世界市場(2025年~2029年)Global Military Thermal Weapon Sights Market 2025-2029 |
||||||

|
|||||||
カスタマイズ可能
|
|||||||


| 軍事用サーマルウェポンサイトの世界市場(2025年~2029年) |
|
出版日: 2024年12月17日
発行: TechNavio
ページ情報: 英文 203 Pages
納期: 即納可能
|

全表示
- 概要
- 図表
- 目次
軍事用サーマルウェポンサイト市場(2025年~2029年)
世界の軍事用サーマルウェポンサイトの市場規模は、2024年~2029年に5億470万米ドル、予測期間中のCAGRは7.4%で成長すると予測されます。当レポートでは、軍事用サーマルウェポンサイト市場の全体的な分析、市場規模・予測、動向、成長促進要因、課題、約25のベンダーを網羅したベンダー分析などを掲載しています。
本レポートは、現在の市場シナリオ、最新動向と促進要因、市場環境全体に関する最新分析を提供しています。市場は、高解像度赤外線サーマルカメラの導入、ISR活動への重点化、世界の非対称戦争の拡大などが牽引しています。
| 市場範囲 | |
|---|---|
| 基準年 | 2025年 |
| 終了年 | 2029年 |
| 予測期間 | 2025年~2029年 |
| 成長モメンタム | 加速 |
| 前年比2025年 | 6.8% |
| CAGR | 7.4% |
| 増分額 | 5億470万米ドル |
本調査では、今後数年間の軍事用サーマルウェポンサイト市場の成長を促進する主な要因の1つとして、ワイヤレスサーマルウェポンサイトの出現を挙げています。また、サーマルウェポンサイトを搭載した暗視装置の登場や、ハンターやアウトドア愛好家によるサーマルウェポンサイトの採用増加が、市場の大きな需要につながります。
目次
第1章 エグゼクティブサマリー
- 市場概要
第2章 Technavioの分析
- 価格感度・ライフサイクル・顧客購入バスケット・採用率・購入基準の分析
- インプットの重要性と差別化の要因
- ディスラプションの要因
- 促進要因と課題の影響
第3章 市場情勢
- 市場エコシステム
- 市場の特徴
- バリューチェーン分析
第4章 市場規模
- 市場の定義
- 市場セグメント分析
- 市場規模(2024年)
- 市場の見通し(2024年~2029年)
第5章 市場規模実績
- 軍事用サーマルウェポンサイトの世界市場(2019年~2023年)
- タイプセグメント分析(2019年~2023年)
- 用途セグメント分析(2019年~2023年)
- 地域セグメント分析(2019年~2023年)
- 国セグメント分析(2019年~2023年)
第6章 定性分析
- AIの影響:軍事用サーマルウェポンサイトの世界市場
第7章 ファイブフォース分析
- ファイブフォースの要約
- 買い手の交渉力
- 供給企業の交渉力
- 新規参入業者の脅威
- 代替品の脅威
- 競争の脅威
- 市況
第8章 市場セグメンテーション:タイプ別
- 市場セグメント
- 比較:タイプ別
- 銃ベースのサーマルウェポンサイト:市場規模と予測(2024年~2029年)
- 車載型サーマルウェポンサイト:市場規模と予測(2024年~2029年)
- 市場機会:タイプ別
第9章 市場セグメンテーション:用途別
- 市場セグメント
- 比較:用途別
- 航空:市場規模と予測(2024年~2029年)
- 海上:市場規模と予測(2024年~2029年)
- 陸上:市場規模と予測(2024年~2029年)
- 市場機会:用途別
第10章 顧客情勢
- 顧客情勢の概要
第11章 地域別情勢
- 地域別セグメンテーション
- 地域別比較
- 北米:市場規模と予測(2024年~2029年)
- アジア太平洋:市場規模と予測(2024年~2029年)
- 欧州:市場規模と予測(2024年~2029年)
- 中東・アフリカ:市場規模と予測(2024年~2029年)
- 南米:市場規模と予測(2024年~2029年)
- 米国:市場規模と予測(2024年~2029年)
- 中国:市場規模と予測(2024年~2029年)
- インド:市場規模と予測(2024年~2029年)
- ロシア:市場規模と予測(2024年~2029年)
- フランス:市場規模と予測(2024年~2029年)
- カナダ:市場規模と予測(2024年~2029年)
- 日本:市場規模と予測(2024年~2029年)
- オーストラリア:市場規模と予測(2024年~2029年)
- 英国:市場規模と予測(2024年~2029年)
- スペイン:市場規模と予測(2024年~2029年)
- 市場機会:地域情勢別
第12章 促進要因・課題・機会・抑制要因
- 市場促進要因
- 市場の課題
- 促進要因と課題の影響
- 市場の機会・抑制要因
第13章 競合情勢
- 概要
- 競合情勢
- ディスラプションの状況
- 業界のリスク
第14章 競合分析
- 企業プロファイル
- 企業ランキング指数
- 企業の市場ポジショニング
- American Technologies Network Corp.
- ASELSAN AS
- BAE Systems Plc
- Elbit Systems Ltd.
- Excelitas Technologies Corp.
- General Starlight Co. Inc.
- L3Harris Technologies Inc.
- Leonardo Spa
- Materion Corp.
- Patria Group
- Rheinmetall AG
- Safran SA
- Schmidt and Bender GmbH and Co. KG
- Teledyne Technologies Inc.
- Trijicon Inc.
第15章 付録
Exhibits:
- Exhibits1: Executive Summary - Chart on Market Overview
- Exhibits2: Executive Summary - Data Table on Market Overview
- Exhibits3: Executive Summary - Chart on Global Market Characteristics
- Exhibits4: Executive Summary - Chart on Market By Geographical Landscape
- Exhibits5: Executive Summary - Chart on Market Segmentation by Type
- Exhibits6: Executive Summary - Chart on Market Segmentation by Application
- Exhibits7: Executive Summary - Chart on Incremental Growth
- Exhibits8: Executive Summary - Data Table on Incremental Growth
- Exhibits9: Executive Summary - Chart on Company Market Positioning
- Exhibits10: Analysis of price sensitivity, lifecycle, customer purchase basket, adoption rates, and purchase criteria
- Exhibits11: Overview on criticality of inputs and factors of differentiation
- Exhibits12: Overview on factors of disruption
- Exhibits13: Impact of drivers and challenges in 2024 and 2029
- Exhibits14: Parent Market
- Exhibits15: Data Table on - Parent Market
- Exhibits16: Market characteristics analysis
- Exhibits17: Value chain analysis
- Exhibits18: Offerings of companies included in the market definition
- Exhibits19: Market segments
- Exhibits20: Chart on Global - Market size and forecast 2024-2029 ($ million)
- Exhibits21: Data Table on Global - Market size and forecast 2024-2029 ($ million)
- Exhibits22: Chart on Global Market: Year-over-year growth 2024-2029 (%)
- Exhibits23: Data Table on Global Market: Year-over-year growth 2024-2029 (%)
- Exhibits24: Historic Market Size - Data Table on Global Military Thermal Weapon Sights Market 2019 - 2023 ($ million)
- Exhibits25: Historic Market Size - Type Segment 2019 - 2023 ($ million)
- Exhibits26: Historic Market Size - Application Segment 2019 - 2023 ($ million)
- Exhibits27: Historic Market Size - Geography Segment 2019 - 2023 ($ million)
- Exhibits28: Historic Market Size - Country Segment 2019 - 2023 ($ million)
- Exhibits29: Five forces analysis - Comparison between 2024 and 2029
- Exhibits30: Bargaining power of buyers - Impact of key factors 2024 and 2029
- Exhibits31: Bargaining power of suppliers - Impact of key factors in 2024 and 2029
- Exhibits32: Threat of new entrants - Impact of key factors in 2024 and 2029
- Exhibits33: Threat of substitutes - Impact of key factors in 2024 and 2029
- Exhibits34: Threat of rivalry - Impact of key factors in 2024 and 2029
- Exhibits35: Chart on Market condition - Five forces 2024 and 2029
- Exhibits36: Chart on Type - Market share 2024-2029 (%)
- Exhibits37: Data Table on Type - Market share 2024-2029 (%)
- Exhibits38: Chart on Comparison by Type
- Exhibits39: Data Table on Comparison by Type
- Exhibits40: Chart on Gun-based thermal weapon sights - Market size and forecast 2024-2029 ($ million)
- Exhibits41: Data Table on Gun-based thermal weapon sights - Market size and forecast 2024-2029 ($ million)
- Exhibits42: Chart on Gun-based thermal weapon sights - Year-over-year growth 2024-2029 (%)
- Exhibits43: Data Table on Gun-based thermal weapon sights - Year-over-year growth 2024-2029 (%)
- Exhibits44: Chart on Vehicle-mounted thermal weapon sights - Market size and forecast 2024-2029 ($ million)
- Exhibits45: Data Table on Vehicle-mounted thermal weapon sights - Market size and forecast 2024-2029 ($ million)
- Exhibits46: Chart on Vehicle-mounted thermal weapon sights - Year-over-year growth 2024-2029 (%)
- Exhibits47: Data Table on Vehicle-mounted thermal weapon sights - Year-over-year growth 2024-2029 (%)
- Exhibits48: Market opportunity by Type ($ million)
- Exhibits49: Data Table on Market opportunity by Type ($ million)
- Exhibits50: Chart on Application - Market share 2024-2029 (%)
- Exhibits51: Data Table on Application - Market share 2024-2029 (%)
- Exhibits52: Chart on Comparison by Application
- Exhibits53: Data Table on Comparison by Application
- Exhibits54: Chart on Air - Market size and forecast 2024-2029 ($ million)
- Exhibits55: Data Table on Air - Market size and forecast 2024-2029 ($ million)
- Exhibits56: Chart on Air - Year-over-year growth 2024-2029 (%)
- Exhibits57: Data Table on Air - Year-over-year growth 2024-2029 (%)
- Exhibits58: Chart on Maritime - Market size and forecast 2024-2029 ($ million)
- Exhibits59: Data Table on Maritime - Market size and forecast 2024-2029 ($ million)
- Exhibits60: Chart on Maritime - Year-over-year growth 2024-2029 (%)
- Exhibits61: Data Table on Maritime - Year-over-year growth 2024-2029 (%)
- Exhibits62: Chart on Land - Market size and forecast 2024-2029 ($ million)
- Exhibits63: Data Table on Land - Market size and forecast 2024-2029 ($ million)
- Exhibits64: Chart on Land - Year-over-year growth 2024-2029 (%)
- Exhibits65: Data Table on Land - Year-over-year growth 2024-2029 (%)
- Exhibits66: Market opportunity by Application ($ million)
- Exhibits67: Data Table on Market opportunity by Application ($ million)
- Exhibits68: Analysis of price sensitivity, lifecycle, customer purchase basket, adoption rates, and purchase criteria
- Exhibits69: Chart on Market share By Geographical Landscape 2024-2029 (%)
- Exhibits70: Data Table on Market share By Geographical Landscape 2024-2029 (%)
- Exhibits71: Chart on Geographic comparison
- Exhibits72: Data Table on Geographic comparison
- Exhibits73: Chart on North America - Market size and forecast 2024-2029 ($ million)
- Exhibits74: Data Table on North America - Market size and forecast 2024-2029 ($ million)
- Exhibits75: Chart on North America - Year-over-year growth 2024-2029 (%)
- Exhibits76: Data Table on North America - Year-over-year growth 2024-2029 (%)
- Exhibits77: Chart on APAC - Market size and forecast 2024-2029 ($ million)
- Exhibits78: Data Table on APAC - Market size and forecast 2024-2029 ($ million)
- Exhibits79: Chart on APAC - Year-over-year growth 2024-2029 (%)
- Exhibits80: Data Table on APAC - Year-over-year growth 2024-2029 (%)
- Exhibits81: Chart on Europe - Market size and forecast 2024-2029 ($ million)
- Exhibits82: Data Table on Europe - Market size and forecast 2024-2029 ($ million)
- Exhibits83: Chart on Europe - Year-over-year growth 2024-2029 (%)
- Exhibits84: Data Table on Europe - Year-over-year growth 2024-2029 (%)
- Exhibits85: Chart on Middle East and Africa - Market size and forecast 2024-2029 ($ million)
- Exhibits86: Data Table on Middle East and Africa - Market size and forecast 2024-2029 ($ million)
- Exhibits87: Chart on Middle East and Africa - Year-over-year growth 2024-2029 (%)
- Exhibits88: Data Table on Middle East and Africa - Year-over-year growth 2024-2029 (%)
- Exhibits89: Chart on South America - Market size and forecast 2024-2029 ($ million)
- Exhibits90: Data Table on South America - Market size and forecast 2024-2029 ($ million)
- Exhibits91: Chart on South America - Year-over-year growth 2024-2029 (%)
- Exhibits92: Data Table on South America - Year-over-year growth 2024-2029 (%)
- Exhibits93: Chart on US - Market size and forecast 2024-2029 ($ million)
- Exhibits94: Data Table on US - Market size and forecast 2024-2029 ($ million)
- Exhibits95: Chart on US - Year-over-year growth 2024-2029 (%)
- Exhibits96: Data Table on US - Year-over-year growth 2024-2029 (%)
- Exhibits97: Chart on China - Market size and forecast 2024-2029 ($ million)
- Exhibits98: Data Table on China - Market size and forecast 2024-2029 ($ million)
- Exhibits99: Chart on China - Year-over-year growth 2024-2029 (%)
- Exhibits100: Data Table on China - Year-over-year growth 2024-2029 (%)
- Exhibits101: Chart on India - Market size and forecast 2024-2029 ($ million)
- Exhibits102: Data Table on India - Market size and forecast 2024-2029 ($ million)
- Exhibits103: Chart on India - Year-over-year growth 2024-2029 (%)
- Exhibits104: Data Table on India - Year-over-year growth 2024-2029 (%)
- Exhibits105: Chart on Russia - Market size and forecast 2024-2029 ($ million)
- Exhibits106: Data Table on Russia - Market size and forecast 2024-2029 ($ million)
- Exhibits107: Chart on Russia - Year-over-year growth 2024-2029 (%)
- Exhibits108: Data Table on Russia - Year-over-year growth 2024-2029 (%)
- Exhibits109: Chart on France - Market size and forecast 2024-2029 ($ million)
- Exhibits110: Data Table on France - Market size and forecast 2024-2029 ($ million)
- Exhibits111: Chart on France - Year-over-year growth 2024-2029 (%)
- Exhibits112: Data Table on France - Year-over-year growth 2024-2029 (%)
- Exhibits113: Chart on Canada - Market size and forecast 2024-2029 ($ million)
- Exhibits114: Data Table on Canada - Market size and forecast 2024-2029 ($ million)
- Exhibits115: Chart on Canada - Year-over-year growth 2024-2029 (%)
- Exhibits116: Data Table on Canada - Year-over-year growth 2024-2029 (%)
- Exhibits117: Chart on Japan - Market size and forecast 2024-2029 ($ million)
- Exhibits118: Data Table on Japan - Market size and forecast 2024-2029 ($ million)
- Exhibits119: Chart on Japan - Year-over-year growth 2024-2029 (%)
- Exhibits120: Data Table on Japan - Year-over-year growth 2024-2029 (%)
- Exhibits121: Chart on Australia - Market size and forecast 2024-2029 ($ million)
- Exhibits122: Data Table on Australia - Market size and forecast 2024-2029 ($ million)
- Exhibits123: Chart on Australia - Year-over-year growth 2024-2029 (%)
- Exhibits124: Data Table on Australia - Year-over-year growth 2024-2029 (%)
- Exhibits125: Chart on UK - Market size and forecast 2024-2029 ($ million)
- Exhibits126: Data Table on UK - Market size and forecast 2024-2029 ($ million)
- Exhibits127: Chart on UK - Year-over-year growth 2024-2029 (%)
- Exhibits128: Data Table on UK - Year-over-year growth 2024-2029 (%)
- Exhibits129: Chart on Spain - Market size and forecast 2024-2029 ($ million)
- Exhibits130: Data Table on Spain - Market size and forecast 2024-2029 ($ million)
- Exhibits131: Chart on Spain - Year-over-year growth 2024-2029 (%)
- Exhibits132: Data Table on Spain - Year-over-year growth 2024-2029 (%)
- Exhibits133: Market opportunity By Geographical Landscape ($ million)
- Exhibits134: Data Tables on Market opportunity By Geographical Landscape ($ million)
- Exhibits135: Impact of drivers and challenges in 2024 and 2029
- Exhibits136: Overview on criticality of inputs and factors of differentiation
- Exhibits137: Overview on factors of disruption
- Exhibits138: Impact of key risks on business
- Exhibits139: Companies covered
- Exhibits140: Company ranking index
- Exhibits141: Matrix on companies position and classification
- Exhibits142: American Technologies Network Corp. - Overview
- Exhibits143: American Technologies Network Corp. - Product / Service
- Exhibits144: American Technologies Network Corp. - Key offerings
- Exhibits145: SWOT
- Exhibits146: ASELSAN AS - Overview
- Exhibits147: ASELSAN AS - Product / Service
- Exhibits148: ASELSAN AS - Key news
- Exhibits149: ASELSAN AS - Key offerings
- Exhibits150: SWOT
- Exhibits151: BAE Systems Plc - Overview
- Exhibits152: BAE Systems Plc - Business segments
- Exhibits153: BAE Systems Plc - Key news
- Exhibits154: BAE Systems Plc - Key offerings
- Exhibits155: BAE Systems Plc - Segment focus
- Exhibits156: SWOT
- Exhibits157: Elbit Systems Ltd. - Overview
- Exhibits158: Elbit Systems Ltd. - Product / Service
- Exhibits159: Elbit Systems Ltd. - Key news
- Exhibits160: Elbit Systems Ltd. - Key offerings
- Exhibits161: SWOT
- Exhibits162: Excelitas Technologies Corp. - Overview
- Exhibits163: Excelitas Technologies Corp. - Product / Service
- Exhibits164: Excelitas Technologies Corp. - Key offerings
- Exhibits165: SWOT
- Exhibits166: General Starlight Co. Inc. - Overview
- Exhibits167: General Starlight Co. Inc. - Product / Service
- Exhibits168: General Starlight Co. Inc. - Key offerings
- Exhibits169: SWOT
- Exhibits170: L3Harris Technologies Inc. - Overview
- Exhibits171: L3Harris Technologies Inc. - Business segments
- Exhibits172: L3Harris Technologies Inc. - Key news
- Exhibits173: L3Harris Technologies Inc. - Key offerings
- Exhibits174: L3Harris Technologies Inc. - Segment focus
- Exhibits175: SWOT
- Exhibits176: Leonardo Spa - Overview
- Exhibits177: Leonardo Spa - Business segments
- Exhibits178: Leonardo Spa - Key news
- Exhibits179: Leonardo Spa - Key offerings
- Exhibits180: Leonardo Spa - Segment focus
- Exhibits181: SWOT
- Exhibits182: Materion Corp. - Overview
- Exhibits183: Materion Corp. - Business segments
- Exhibits184: Materion Corp. - Key offerings
- Exhibits185: Materion Corp. - Segment focus
- Exhibits186: SWOT
- Exhibits187: Patria Group - Overview
- Exhibits188: Patria Group - Product / Service
- Exhibits189: Patria Group - Key offerings
- Exhibits190: SWOT
- Exhibits191: Rheinmetall AG - Overview
- Exhibits192: Rheinmetall AG - Business segments
- Exhibits193: Rheinmetall AG - Key news
- Exhibits194: Rheinmetall AG - Key offerings
- Exhibits195: Rheinmetall AG - Segment focus
- Exhibits196: SWOT
- Exhibits197: Safran SA - Overview
- Exhibits198: Safran SA - Business segments
- Exhibits199: Safran SA - Key news
- Exhibits200: Safran SA - Key offerings
- Exhibits201: Safran SA - Segment focus
- Exhibits202: SWOT
- Exhibits203: Schmidt and Bender GmbH and Co. KG - Overview
- Exhibits204: Schmidt and Bender GmbH and Co. KG - Product / Service
- Exhibits205: Schmidt and Bender GmbH and Co. KG - Key offerings
- Exhibits206: SWOT
- Exhibits207: Teledyne Technologies Inc. - Overview
- Exhibits208: Teledyne Technologies Inc. - Business segments
- Exhibits209: Teledyne Technologies Inc. - Key news
- Exhibits210: Teledyne Technologies Inc. - Key offerings
- Exhibits211: Teledyne Technologies Inc. - Segment focus
- Exhibits212: SWOT
- Exhibits213: Trijicon Inc. - Overview
- Exhibits214: Trijicon Inc. - Product / Service
- Exhibits215: Trijicon Inc. - Key offerings
- Exhibits216: SWOT
- Exhibits217: Inclusions checklist
- Exhibits218: Exclusions checklist
- Exhibits219: Currency conversion rates for US$
- Exhibits220: Research methodology
- Exhibits221: Information sources
- Exhibits222: Data validation
- Exhibits223: Validation techniques employed for market sizing
- Exhibits224: Data synthesis
- Exhibits225: 360 degree market analysis
- Exhibits226: List of abbreviations
Military Thermal Weapon Sights Market 2025-2029
The military thermal weapon sights market is forecasted to grow by USD 504.7 mn during 2024-2029, accelerating at a CAGR of 7.4% during the forecast period. The report on the military thermal weapon sights market provides a holistic analysis, market size and forecast, trends, growth drivers, and challenges, as well as vendor analysis covering around 25 vendors.
The report offers an up-to-date analysis regarding the current market scenario, the latest trends and drivers, and the overall market environment. The market is driven by introduction of high-definition thermal imaging systems, greater focus on isr operations, and growing asymmetric warfare across world.
| Market Scope | |
|---|---|
| Base Year | 2025 |
| End Year | 2029 |
| Series Year | 2025-2029 |
| Growth Momentum | Accelerate |
| YOY 2025 | 6.8% |
| CAGR | 7.4% |
| Incremental Value | $504.7 mn |
Technavio's military thermal weapon sights market is segmented as below:
By Type
- Gun-based thermal weapon sights
- Vehicle-mounted thermal weapon sights
By Application
- Air
- Maritime
- Land
By Geographical Landscape
- North America
- APAC
- Europe
- Middle East and Africa
- South America
This study identifies the emergence of wireless thermal weapon sights as one of the prime reasons driving the military thermal weapon sights market growth during the next few years. Also, emergence of night vision device with thermal weapon sights and increasing adoption of thermal weapon sights by hunters and outdoor enthusiasts will lead to sizable demand in the market.
The report on the military thermal weapon sights market covers the following areas:
- Military Thermal Weapon Sights Market sizing
- Military Thermal Weapon Sights Market forecast
- Military Thermal Weapon Sights Market industry analysis
The robust vendor analysis is designed to help clients improve their market position, and in line with this, this report provides a detailed analysis of several leading military thermal weapon sights market vendors that include American Technologies Network Corp., ASELSAN AS, BAE Systems Plc, BERETTA HOLDING SA, Elbit Systems Ltd., Excelitas Technologies Corp., General Starlight Co. Inc., L3Harris Technologies Inc., Leonardo Spa, Materion Corp., Patria Group, Rheinmetall AG, Safran SA, Schmidt and Bender GmbH and Co. KG, SIG Sauer Inc., Teledyne Technologies Inc., Thales Group, Thermoteknix Systems Ltd., Tonbo Imaging India Pvt Ltd., and Trijicon Inc.. Also, the military thermal weapon sights market analysis report includes information on upcoming trends and challenges that will influence market growth. This is to help companies strategize and leverage all forthcoming growth opportunities.
The study was conducted using an objective combination of primary and secondary information including inputs from key participants in the industry. The report contains a comprehensive market and vendor landscape in addition to an analysis of the key vendors.
The publisher presents a detailed picture of the market by the way of study, synthesis, and summation of data from multiple sources by an analysis of key parameters such as profit, pricing, competition, and promotions. It presents various market facets by identifying the key industry influencers. The data presented is comprehensive, reliable, and a result of extensive primary and secondary research. The market research reports provide a complete competitive landscape and an in-depth vendor selection methodology and analysis using qualitative and quantitative research to forecast accurate market growth.
Table of Contents
1 Executive Summary
- 1.1 Market overview
- Executive Summary - Chart on Market Overview
- Executive Summary - Data Table on Market Overview
- Executive Summary - Chart on Global Market Characteristics
- Executive Summary - Chart on Market By Geographical Landscape
- Executive Summary - Chart on Market Segmentation by Type
- Executive Summary - Chart on Market Segmentation by Application
- Executive Summary - Chart on Incremental Growth
- Executive Summary - Data Table on Incremental Growth
- Executive Summary - Chart on Company Market Positioning
2 Technavio Analysis
- 2.1 Analysis of price sensitivity, lifecycle, customer purchase basket, adoption rates, and purchase criteria
- Analysis of price sensitivity, lifecycle, customer purchase basket, adoption rates, and purchase criteria
- 2.2 Criticality of inputs and Factors of differentiation
- Overview on criticality of inputs and factors of differentiation
- 2.3 Factors of disruption
- Overview on factors of disruption
- 2.4 Impact of drivers and challenges
- Impact of drivers and challenges in 2024 and 2029
3 Market Landscape
- 3.1 Market ecosystem
- Parent Market
- Data Table on - Parent Market
- 3.2 Market characteristics
- Market characteristics analysis
- 3.3 Value chain analysis
- Value chain analysis
4 Market Sizing
- 4.1 Market definition
- Offerings of companies included in the market definition
- 4.2 Market segment analysis
- Market segments
- 4.3 Market size 2024
- 4.4 Market outlook: Forecast for 2024-2029
- Chart on Global - Market size and forecast 2024-2029 ($ million)
- Data Table on Global - Market size and forecast 2024-2029 ($ million)
- Chart on Global Market: Year-over-year growth 2024-2029 (%)
- Data Table on Global Market: Year-over-year growth 2024-2029 (%)
5 Historic Market Size
- 5.1 Global Military Thermal Weapon Sights Market 2019 - 2023
- Historic Market Size - Data Table on Global Military Thermal Weapon Sights Market 2019 - 2023 ($ million)
- 5.2 Type segment analysis 2019 - 2023
- Historic Market Size - Type Segment 2019 - 2023 ($ million)
- 5.3 Application segment analysis 2019 - 2023
- Historic Market Size - Application Segment 2019 - 2023 ($ million)
- 5.4 Geography segment analysis 2019 - 2023
- Historic Market Size - Geography Segment 2019 - 2023 ($ million)
- 5.5 Country segment analysis 2019 - 2023
- Historic Market Size - Country Segment 2019 - 2023 ($ million)
6 Qualitative Analysis
- 6.1 Impact of AI on Global Military Thermal Weapon Sights Market
7 Five Forces Analysis
- 7.1 Five forces summary
- Five forces analysis - Comparison between 2024 and 2029
- 7.2 Bargaining power of buyers
- Bargaining power of buyers - Impact of key factors 2024 and 2029
- 7.3 Bargaining power of suppliers
- Bargaining power of suppliers - Impact of key factors in 2024 and 2029
- 7.4 Threat of new entrants
- Threat of new entrants - Impact of key factors in 2024 and 2029
- 7.5 Threat of substitutes
- Threat of substitutes - Impact of key factors in 2024 and 2029
- 7.6 Threat of rivalry
- Threat of rivalry - Impact of key factors in 2024 and 2029
- 7.7 Market condition
- Chart on Market condition - Five forces 2024 and 2029
8 Market Segmentation by Type
- 8.1 Market segments
- Chart on Type - Market share 2024-2029 (%)
- Data Table on Type - Market share 2024-2029 (%)
- 8.2 Comparison by Type
- Chart on Comparison by Type
- Data Table on Comparison by Type
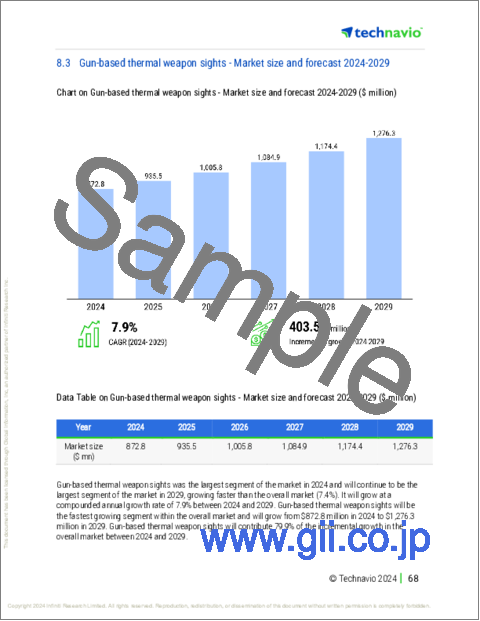
- 8.3 Gun-based thermal weapon sights - Market size and forecast 2024-2029
- Chart on Gun-based thermal weapon sights - Market size and forecast 2024-2029 ($ million)
- Data Table on Gun-based thermal weapon sights - Market size and forecast 2024-2029 ($ million)
- Chart on Gun-based thermal weapon sights - Year-over-year growth 2024-2029 (%)
- Data Table on Gun-based thermal weapon sights - Year-over-year growth 2024-2029 (%)
- 8.4 Vehicle-mounted thermal weapon sights - Market size and forecast 2024-2029
- Chart on Vehicle-mounted thermal weapon sights - Market size and forecast 2024-2029 ($ million)
- Data Table on Vehicle-mounted thermal weapon sights - Market size and forecast 2024-2029 ($ million)
- Chart on Vehicle-mounted thermal weapon sights - Year-over-year growth 2024-2029 (%)
- Data Table on Vehicle-mounted thermal weapon sights - Year-over-year growth 2024-2029 (%)
- 8.5 Market opportunity by Type
- Market opportunity by Type ($ million)
- Data Table on Market opportunity by Type ($ million)
9 Market Segmentation by Application
- 9.1 Market segments
- Chart on Application - Market share 2024-2029 (%)
- Data Table on Application - Market share 2024-2029 (%)
- 9.2 Comparison by Application
- Chart on Comparison by Application
- Data Table on Comparison by Application
- 9.3 Air - Market size and forecast 2024-2029
- Chart on Air - Market size and forecast 2024-2029 ($ million)
- Data Table on Air - Market size and forecast 2024-2029 ($ million)
- Chart on Air - Year-over-year growth 2024-2029 (%)
- Data Table on Air - Year-over-year growth 2024-2029 (%)
- 9.4 Maritime - Market size and forecast 2024-2029
- Chart on Maritime - Market size and forecast 2024-2029 ($ million)
- Data Table on Maritime - Market size and forecast 2024-2029 ($ million)
- Chart on Maritime - Year-over-year growth 2024-2029 (%)
- Data Table on Maritime - Year-over-year growth 2024-2029 (%)
- 9.5 Land - Market size and forecast 2024-2029
- Chart on Land - Market size and forecast 2024-2029 ($ million)
- Data Table on Land - Market size and forecast 2024-2029 ($ million)
- Chart on Land - Year-over-year growth 2024-2029 (%)
- Data Table on Land - Year-over-year growth 2024-2029 (%)
- 9.6 Market opportunity by Application
- Market opportunity by Application ($ million)
- Data Table on Market opportunity by Application ($ million)
10 Customer Landscape
- 10.1 Customer landscape overview
- Analysis of price sensitivity, lifecycle, customer purchase basket, adoption rates, and purchase criteria
11 Geographic Landscape
- 11.1 Geographic segmentation
- Chart on Market share By Geographical Landscape 2024-2029 (%)
- Data Table on Market share By Geographical Landscape 2024-2029 (%)
- 11.2 Geographic comparison
- Chart on Geographic comparison
- Data Table on Geographic comparison
- 11.3 North America - Market size and forecast 2024-2029
- Chart on North America - Market size and forecast 2024-2029 ($ million)
- Data Table on North America - Market size and forecast 2024-2029 ($ million)
- Chart on North America - Year-over-year growth 2024-2029 (%)
- Data Table on North America - Year-over-year growth 2024-2029 (%)
- 11.4 APAC - Market size and forecast 2024-2029
- Chart on APAC - Market size and forecast 2024-2029 ($ million)
- Data Table on APAC - Market size and forecast 2024-2029 ($ million)
- Chart on APAC - Year-over-year growth 2024-2029 (%)
- Data Table on APAC - Year-over-year growth 2024-2029 (%)
- 11.5 Europe - Market size and forecast 2024-2029
- Chart on Europe - Market size and forecast 2024-2029 ($ million)
- Data Table on Europe - Market size and forecast 2024-2029 ($ million)
- Chart on Europe - Year-over-year growth 2024-2029 (%)
- Data Table on Europe - Year-over-year growth 2024-2029 (%)
- 11.6 Middle East and Africa - Market size and forecast 2024-2029
- Chart on Middle East and Africa - Market size and forecast 2024-2029 ($ million)
- Data Table on Middle East and Africa - Market size and forecast 2024-2029 ($ million)
- Chart on Middle East and Africa - Year-over-year growth 2024-2029 (%)
- Data Table on Middle East and Africa - Year-over-year growth 2024-2029 (%)
- 11.7 South America - Market size and forecast 2024-2029
- Chart on South America - Market size and forecast 2024-2029 ($ million)
- Data Table on South America - Market size and forecast 2024-2029 ($ million)
- Chart on South America - Year-over-year growth 2024-2029 (%)
- Data Table on South America - Year-over-year growth 2024-2029 (%)
- 11.8 US - Market size and forecast 2024-2029
- Chart on US - Market size and forecast 2024-2029 ($ million)
- Data Table on US - Market size and forecast 2024-2029 ($ million)
- Chart on US - Year-over-year growth 2024-2029 (%)
- Data Table on US - Year-over-year growth 2024-2029 (%)
- 11.9 China - Market size and forecast 2024-2029
- Chart on China - Market size and forecast 2024-2029 ($ million)
- Data Table on China - Market size and forecast 2024-2029 ($ million)
- Chart on China - Year-over-year growth 2024-2029 (%)
- Data Table on China - Year-over-year growth 2024-2029 (%)
- 11.10 India - Market size and forecast 2024-2029
- Chart on India - Market size and forecast 2024-2029 ($ million)
- Data Table on India - Market size and forecast 2024-2029 ($ million)
- Chart on India - Year-over-year growth 2024-2029 (%)
- Data Table on India - Year-over-year growth 2024-2029 (%)
- 11.11 Russia - Market size and forecast 2024-2029
- Chart on Russia - Market size and forecast 2024-2029 ($ million)
- Data Table on Russia - Market size and forecast 2024-2029 ($ million)
- Chart on Russia - Year-over-year growth 2024-2029 (%)
- Data Table on Russia - Year-over-year growth 2024-2029 (%)
- 11.12 France - Market size and forecast 2024-2029
- Chart on France - Market size and forecast 2024-2029 ($ million)
- Data Table on France - Market size and forecast 2024-2029 ($ million)
- Chart on France - Year-over-year growth 2024-2029 (%)
- Data Table on France - Year-over-year growth 2024-2029 (%)
- 11.13 Canada - Market size and forecast 2024-2029
- Chart on Canada - Market size and forecast 2024-2029 ($ million)
- Data Table on Canada - Market size and forecast 2024-2029 ($ million)
- Chart on Canada - Year-over-year growth 2024-2029 (%)
- Data Table on Canada - Year-over-year growth 2024-2029 (%)
- 11.14 Japan - Market size and forecast 2024-2029
- Chart on Japan - Market size and forecast 2024-2029 ($ million)
- Data Table on Japan - Market size and forecast 2024-2029 ($ million)
- Chart on Japan - Year-over-year growth 2024-2029 (%)
- Data Table on Japan - Year-over-year growth 2024-2029 (%)
- 11.15 Australia - Market size and forecast 2024-2029
- Chart on Australia - Market size and forecast 2024-2029 ($ million)
- Data Table on Australia - Market size and forecast 2024-2029 ($ million)
- Chart on Australia - Year-over-year growth 2024-2029 (%)
- Data Table on Australia - Year-over-year growth 2024-2029 (%)
- 11.16 UK - Market size and forecast 2024-2029
- Chart on UK - Market size and forecast 2024-2029 ($ million)
- Data Table on UK - Market size and forecast 2024-2029 ($ million)
- Chart on UK - Year-over-year growth 2024-2029 (%)
- Data Table on UK - Year-over-year growth 2024-2029 (%)
- 11.17 Spain - Market size and forecast 2024-2029
- Chart on Spain - Market size and forecast 2024-2029 ($ million)
- Data Table on Spain - Market size and forecast 2024-2029 ($ million)
- Chart on Spain - Year-over-year growth 2024-2029 (%)
- Data Table on Spain - Year-over-year growth 2024-2029 (%)
- 11.18 Market opportunity By Geographical Landscape
- Market opportunity By Geographical Landscape ($ million)
- Data Tables on Market opportunity By Geographical Landscape ($ million)
12 Drivers, Challenges, and Opportunity/Restraints
- 12.1 Market drivers
- 12.2 Market challenges
- 12.3 Impact of drivers and challenges
- Impact of drivers and challenges in 2024 and 2029
- 12.4 Market opportunities/restraints
13 Competitive Landscape
- 13.1 Overview
- 13.2 Competitive Landscape
- Overview on criticality of inputs and factors of differentiation
- 13.3 Landscape disruption
- Overview on factors of disruption
- 13.4 Industry risks
- Impact of key risks on business
14 Competitive Analysis
- 14.1 Companies profiled
- Companies covered
- 14.2 Company ranking index
- Company ranking index
- 14.3 Market positioning of companies
- Matrix on companies position and classification
- 14.4 American Technologies Network Corp.
- American Technologies Network Corp. - Overview
- American Technologies Network Corp. - Product / Service
- American Technologies Network Corp. - Key offerings
- SWOT
- 14.5 ASELSAN AS
- ASELSAN AS - Overview
- ASELSAN AS - Product / Service
- ASELSAN AS - Key news
- ASELSAN AS - Key offerings
- SWOT
- 14.6 BAE Systems Plc
- BAE Systems Plc - Overview
- BAE Systems Plc - Business segments
- BAE Systems Plc - Key news
- BAE Systems Plc - Key offerings
- BAE Systems Plc - Segment focus
- SWOT
- 14.7 Elbit Systems Ltd.
- Elbit Systems Ltd. - Overview
- Elbit Systems Ltd. - Product / Service
- Elbit Systems Ltd. - Key news
- Elbit Systems Ltd. - Key offerings
- SWOT
- 14.8 Excelitas Technologies Corp.
- Excelitas Technologies Corp. - Overview
- Excelitas Technologies Corp. - Product / Service
- Excelitas Technologies Corp. - Key offerings
- SWOT
- 14.9 General Starlight Co. Inc.
- General Starlight Co. Inc. - Overview
- General Starlight Co. Inc. - Product / Service
- General Starlight Co. Inc. - Key offerings
- SWOT
- 14.10 L3Harris Technologies Inc.
- L3Harris Technologies Inc. - Overview
- L3Harris Technologies Inc. - Business segments
- L3Harris Technologies Inc. - Key news
- L3Harris Technologies Inc. - Key offerings
- L3Harris Technologies Inc. - Segment focus
- SWOT
- 14.11 Leonardo Spa
- Leonardo Spa - Overview
- Leonardo Spa - Business segments
- Leonardo Spa - Key news
- Leonardo Spa - Key offerings
- Leonardo Spa - Segment focus
- SWOT
- 14.12 Materion Corp.
- Materion Corp. - Overview
- Materion Corp. - Business segments
- Materion Corp. - Key offerings
- Materion Corp. - Segment focus
- SWOT
- 14.13 Patria Group
- Patria Group - Overview
- Patria Group - Product / Service
- Patria Group - Key offerings
- SWOT
- 14.14 Rheinmetall AG
- Rheinmetall AG - Overview
- Rheinmetall AG - Business segments
- Rheinmetall AG - Key news
- Rheinmetall AG - Key offerings
- Rheinmetall AG - Segment focus
- SWOT
- 14.15 Safran SA
- Safran SA - Overview
- Safran SA - Business segments
- Safran SA - Key news
- Safran SA - Key offerings
- Safran SA - Segment focus
- SWOT
- 14.16 Schmidt and Bender GmbH and Co. KG
- Schmidt and Bender GmbH and Co. KG - Overview
- Schmidt and Bender GmbH and Co. KG - Product / Service
- Schmidt and Bender GmbH and Co. KG - Key offerings
- SWOT
- 14.17 Teledyne Technologies Inc.
- Teledyne Technologies Inc. - Overview
- Teledyne Technologies Inc. - Business segments
- Teledyne Technologies Inc. - Key news
- Teledyne Technologies Inc. - Key offerings
- Teledyne Technologies Inc. - Segment focus
- SWOT
- 14.18 Trijicon Inc.
- Trijicon Inc. - Overview
- Trijicon Inc. - Product / Service
- Trijicon Inc. - Key offerings
- SWOT
15 Appendix
- 15.1 Scope of the report
- 15.2 Inclusions and exclusions checklist
- Inclusions checklist
- Exclusions checklist
- 15.3 Currency conversion rates for US$
- Currency conversion rates for US$
- 15.4 Research methodology
- Research methodology
- 15.5 Data procurement
- Information sources
- 15.6 Data validation
- Data validation
- 15.7 Validation techniques employed for market sizing
- Validation techniques employed for market sizing
- 15.8 Data synthesis
- Data synthesis
- 15.9 360 degree market analysis
- 360 degree market analysis
- 15.10 List of abbreviations
- List of abbreviations

