|
|
市場調査レポート
商品コード
1743422
産業用ベルトテンショナーの世界市場 2025~2029年Global Industrial Belt Tensioners Market 2025-2029 |
||||||

|
|||||||
カスタマイズ可能
|
|||||||


| 産業用ベルトテンショナーの世界市場 2025~2029年 |
|
出版日: 2025年05月31日
発行: TechNavio
ページ情報: 英文 226 Pages
納期: 即納可能
|

全表示
- 概要
- 図表
- 目次
産業用ベルトテンショナー市場は2024-2029年に1億6,760万米ドル、予測期間中のCAGRは3.4%で成長すると予測されます。
当レポートでは、産業用ベルトテンショナー市場の全体的な分析、市場規模・予測、動向、成長促進要因、課題、約25のベンダーを網羅したベンダー分析などを掲載しています。
現在の市場シナリオ、最新動向と促進要因、市場環境全体に関する最新分析を提供しています。市場は、産業資産への投資の増加、eコマースの裏付けとベルトテンショナーの販売の改善、鉱業におけるベルトテンショナーの使用の上昇によって牽引されています。
| 市場範囲 | |
|---|---|
| 基準年 | 2025 |
| 終了年 | 2029 |
| 予測期間 | 2025-2029 |
| 成長モメンタム | 加速 |
| 前年比 | 3.2% |
| CAGR | 3.4% |
| 増分額 | 1億6,760万米ドル |
本調査は、業界の主要参加者からのインプットを含め、一次情報と二次情報を客観的に組み合わせて実施しました。レポートには、主要企業の分析に加え、包括的な市場規模データ、地域別分析によるセグメント、ベンダー情勢が含まれています。レポートには履歴データと予測データがあります。
この調査では、今後数年間の産業用ベルトテンショナー市場の成長を促進する主な理由の一つとして、カスタマイズされたベルトテンショナーの開発を特定します。また、eコマースや物流の増加、統合ベルトテンショナーやベルトテンショニングシステムの出現は、市場での大規模な需要につながります。
目次
第1章 エグゼクティブサマリー
- 市場概要
第2章 Technavio分析
- 価格・ライフサイクル・顧客購入バスケット・採用率・購入基準の分析
- インプットの重要性と差別化の要因
- 混乱の要因
- 促進要因と課題の影響
第3章 市場情勢
- 市場エコシステム
- 市場の特徴
- バリューチェーン分析
第4章 市場規模
- 市場の定義
- 市場セグメント分析
- 市場規模 2024
- 市場の見通し 2024-2029
第5章 市場規模実績
- 産業用ベルトテンショナーの世界市場 2019-2023
- 用途別セグメント分析 2019-2023
- タイプ別セグメント分析 2019-2023
- 材料別セグメント分析 2019-2023
- 地域別セグメント分析 2019-2023
- 国別セグメント分析 2019-2023
第6章 定性分析
- AIの影響:産業用ベルトテンショナーの世界市場
第7章 ファイブフォース分析
- ファイブフォースの要約
- 買い手の交渉力
- 供給企業の交渉力
- 新規参入業者の脅威
- 代替品の脅威
- 競争の脅威
- 市況
第8章 市場セグメンテーション:用途別
- 市場セグメント
- 比較:用途別
- マテリアルハンドリング業界:市場規模と予測 2024-2029
- 産業機械部門:市場規模と予測 2024-2029
- 農業産業:市場規模と予測 2024-2029
- 鉱業・鉱物産業:市場規模と予測 2024-2029
- 市場機会:用途別
第9章 市場セグメンテーション:タイプ別
- 市場セグメント
- 比較:タイプ別
- 自動:市場規模と予測 2024-2029
- 非自動:市場規模と予測 2024-2029
- 市場機会:タイプ別
第10章 市場セグメンテーション:材料別
- 市場セグメント
- 比較:材料別
- スチールテンショナー:市場規模と予測 2024-2029
- アルミテンショナー:市場規模と予測 2024-2029
- プラスチックテンショナー:市場規模と予測 2024-2029
- 複合材料テンショナー:市場規模と予測 2024-2029
- 市場機会:材料別
第11章 顧客情勢
- 顧客情勢の概要
第12章 地域別情勢
- 地域別セグメンテーション
- 地域別比較
- アジア太平洋:市場規模と予測 2024-2029
- 欧州:市場規模と予測 2024-2029
- 北米:市場規模と予測 2024-2029
- 南米:市場規模と予測 2024-2029
- 中東・アフリカ:市場規模と予測 2024-2029
- 米国:市場規模と予測 2024-2029
- 中国:市場規模と予測 2024-2029
- 日本:市場規模と予測 2024-2029
- インド:市場規模と予測 2024-2029
- 韓国:市場規模と予測 2024-2029
- ドイツ:市場規模と予測 2024-2029
- 英国:市場規模と予測 2024-2029
- オーストラリア:市場規模と予測 2024-2029
- カナダ:市場規模と予測 2024-2029
- フランス:市場規模と予測 2024-2029
- 市場機会:地域情勢別
第13章 促進要因・課題・機会・抑制要因
- 市場促進要因
- 市場の課題
- 促進要因と課題の影響
- 市場の機会・抑制要因
第14章 競合情勢
- 概要
- 競合情勢
- 混乱の状況
- 業界のリスク
第15章 競合分析
- 企業プロファイル
- 企業ランキング指数
- 企業の市場ポジショニング
- AB SKF
- Applied Industrial Technologies Inc.
- Bando Chemical Industries Ltd.
- Brewer Machine and Gear Co.
- Continental AG
- Dayco IP Holdings LLC
- Gates Industrial Corp. Plc
- Hangzhou Chinabase Machinery Co. Ltd.
- Hutchinson SA
- Litens Automotive
- Michelin Group
- Murtfeldt Kunststoffe GmbH and Co. KG
- Regal Rexnord Corp.
- The Timken Co.
- TotalEnergies SE
第16章 付録
Exhibits:
- Exhibits1: Executive Summary - Chart on Market Overview
- Exhibits2: Executive Summary - Data Table on Market Overview
- Exhibits3: Executive Summary - Chart on Global Market Characteristics
- Exhibits4: Executive Summary - Chart on Market By Geographical Landscape
- Exhibits5: Executive Summary - Chart on Market Segmentation by Application
- Exhibits6: Executive Summary - Chart on Market Segmentation by Type
- Exhibits7: Executive Summary - Chart on Market Segmentation by Material
- Exhibits8: Executive Summary - Chart on Incremental Growth
- Exhibits9: Executive Summary - Data Table on Incremental Growth
- Exhibits10: Executive Summary - Chart on Company Market Positioning
- Exhibits11: Analysis of price sensitivity, lifecycle, customer purchase basket, adoption rates, and purchase criteria
- Exhibits12: Overview on criticality of inputs and factors of differentiation
- Exhibits13: Overview on factors of disruption
- Exhibits14: Impact of drivers and challenges in 2024 and 2029
- Exhibits15: Parent Market
- Exhibits16: Data Table on - Parent Market
- Exhibits17: Market characteristics analysis
- Exhibits18: Value chain analysis
- Exhibits19: Offerings of companies included in the market definition
- Exhibits20: Market segments
- Exhibits21: Chart on Global - Market size and forecast 2024-2029 ($ million)
- Exhibits22: Data Table on Global - Market size and forecast 2024-2029 ($ million)
- Exhibits23: Chart on Global Market: Year-over-year growth 2024-2029 (%)
- Exhibits24: Data Table on Global Market: Year-over-year growth 2024-2029 (%)
- Exhibits25: Historic Market Size - Data Table on Global Industrial Belt Tensioners Market 2019 - 2023 ($ million)
- Exhibits26: Historic Market Size - Application Segment 2019 - 2023 ($ million)
- Exhibits27: Historic Market Size - Type Segment 2019 - 2023 ($ million)
- Exhibits28: Historic Market Size - Material Segment 2019 - 2023 ($ million)
- Exhibits29: Historic Market Size - Geography Segment 2019 - 2023 ($ million)
- Exhibits30: Historic Market Size - Country Segment 2019 - 2023 ($ million)
- Exhibits31: Five forces analysis - Comparison between 2024 and 2029
- Exhibits32: Bargaining power of buyers - Impact of key factors 2024 and 2029
- Exhibits33: Bargaining power of suppliers - Impact of key factors in 2024 and 2029
- Exhibits34: Threat of new entrants - Impact of key factors in 2024 and 2029
- Exhibits35: Threat of substitutes - Impact of key factors in 2024 and 2029
- Exhibits36: Threat of rivalry - Impact of key factors in 2024 and 2029
- Exhibits37: Chart on Market condition - Five forces 2024 and 2029
- Exhibits38: Chart on Application - Market share 2024-2029 (%)
- Exhibits39: Data Table on Application - Market share 2024-2029 (%)
- Exhibits40: Chart on Comparison by Application
- Exhibits41: Data Table on Comparison by Application
- Exhibits42: Chart on Material handling industry - Market size and forecast 2024-2029 ($ million)
- Exhibits43: Data Table on Material handling industry - Market size and forecast 2024-2029 ($ million)
- Exhibits44: Chart on Material handling industry - Year-over-year growth 2024-2029 (%)
- Exhibits45: Data Table on Material handling industry - Year-over-year growth 2024-2029 (%)
- Exhibits46: Chart on Industrial machinery sector - Market size and forecast 2024-2029 ($ million)
- Exhibits47: Data Table on Industrial machinery sector - Market size and forecast 2024-2029 ($ million)
- Exhibits48: Chart on Industrial machinery sector - Year-over-year growth 2024-2029 (%)
- Exhibits49: Data Table on Industrial machinery sector - Year-over-year growth 2024-2029 (%)
- Exhibits50: Chart on Agriculture industry - Market size and forecast 2024-2029 ($ million)
- Exhibits51: Data Table on Agriculture industry - Market size and forecast 2024-2029 ($ million)
- Exhibits52: Chart on Agriculture industry - Year-over-year growth 2024-2029 (%)
- Exhibits53: Data Table on Agriculture industry - Year-over-year growth 2024-2029 (%)
- Exhibits54: Chart on Mining and mineral industry - Market size and forecast 2024-2029 ($ million)
- Exhibits55: Data Table on Mining and mineral industry - Market size and forecast 2024-2029 ($ million)
- Exhibits56: Chart on Mining and mineral industry - Year-over-year growth 2024-2029 (%)
- Exhibits57: Data Table on Mining and mineral industry - Year-over-year growth 2024-2029 (%)
- Exhibits58: Market opportunity by Application ($ million)
- Exhibits59: Data Table on Market opportunity by Application ($ million)
- Exhibits60: Chart on Type - Market share 2024-2029 (%)
- Exhibits61: Data Table on Type - Market share 2024-2029 (%)
- Exhibits62: Chart on Comparison by Type
- Exhibits63: Data Table on Comparison by Type
- Exhibits64: Chart on Automatic - Market size and forecast 2024-2029 ($ million)
- Exhibits65: Data Table on Automatic - Market size and forecast 2024-2029 ($ million)
- Exhibits66: Chart on Automatic - Year-over-year growth 2024-2029 (%)
- Exhibits67: Data Table on Automatic - Year-over-year growth 2024-2029 (%)
- Exhibits68: Chart on Non-automatic - Market size and forecast 2024-2029 ($ million)
- Exhibits69: Data Table on Non-automatic - Market size and forecast 2024-2029 ($ million)
- Exhibits70: Chart on Non-automatic - Year-over-year growth 2024-2029 (%)
- Exhibits71: Data Table on Non-automatic - Year-over-year growth 2024-2029 (%)
- Exhibits72: Market opportunity by Type ($ million)
- Exhibits73: Data Table on Market opportunity by Type ($ million)
- Exhibits74: Chart on Material - Market share 2024-2029 (%)
- Exhibits75: Data Table on Material - Market share 2024-2029 (%)
- Exhibits76: Chart on Comparison by Material
- Exhibits77: Data Table on Comparison by Material
- Exhibits78: Chart on Steel tensioners - Market size and forecast 2024-2029 ($ million)
- Exhibits79: Data Table on Steel tensioners - Market size and forecast 2024-2029 ($ million)
- Exhibits80: Chart on Steel tensioners - Year-over-year growth 2024-2029 (%)
- Exhibits81: Data Table on Steel tensioners - Year-over-year growth 2024-2029 (%)
- Exhibits82: Chart on Aluminum tensioners - Market size and forecast 2024-2029 ($ million)
- Exhibits83: Data Table on Aluminum tensioners - Market size and forecast 2024-2029 ($ million)
- Exhibits84: Chart on Aluminum tensioners - Year-over-year growth 2024-2029 (%)
- Exhibits85: Data Table on Aluminum tensioners - Year-over-year growth 2024-2029 (%)
- Exhibits86: Chart on Plastic tensioners - Market size and forecast 2024-2029 ($ million)
- Exhibits87: Data Table on Plastic tensioners - Market size and forecast 2024-2029 ($ million)
- Exhibits88: Chart on Plastic tensioners - Year-over-year growth 2024-2029 (%)
- Exhibits89: Data Table on Plastic tensioners - Year-over-year growth 2024-2029 (%)
- Exhibits90: Chart on Composite material tensioners - Market size and forecast 2024-2029 ($ million)
- Exhibits91: Data Table on Composite material tensioners - Market size and forecast 2024-2029 ($ million)
- Exhibits92: Chart on Composite material tensioners - Year-over-year growth 2024-2029 (%)
- Exhibits93: Data Table on Composite material tensioners - Year-over-year growth 2024-2029 (%)
- Exhibits94: Market opportunity by Material ($ million)
- Exhibits95: Data Table on Market opportunity by Material ($ million)
- Exhibits96: Analysis of price sensitivity, lifecycle, customer purchase basket, adoption rates, and purchase criteria
- Exhibits97: Chart on Market share By Geographical Landscape 2024-2029 (%)
- Exhibits98: Data Table on Market share By Geographical Landscape 2024-2029 (%)
- Exhibits99: Chart on Geographic comparison
- Exhibits100: Data Table on Geographic comparison
- Exhibits101: Chart on APAC - Market size and forecast 2024-2029 ($ million)
- Exhibits102: Data Table on APAC - Market size and forecast 2024-2029 ($ million)
- Exhibits103: Chart on APAC - Year-over-year growth 2024-2029 (%)
- Exhibits104: Data Table on APAC - Year-over-year growth 2024-2029 (%)
- Exhibits105: Chart on Europe - Market size and forecast 2024-2029 ($ million)
- Exhibits106: Data Table on Europe - Market size and forecast 2024-2029 ($ million)
- Exhibits107: Chart on Europe - Year-over-year growth 2024-2029 (%)
- Exhibits108: Data Table on Europe - Year-over-year growth 2024-2029 (%)
- Exhibits109: Chart on North America - Market size and forecast 2024-2029 ($ million)
- Exhibits110: Data Table on North America - Market size and forecast 2024-2029 ($ million)
- Exhibits111: Chart on North America - Year-over-year growth 2024-2029 (%)
- Exhibits112: Data Table on North America - Year-over-year growth 2024-2029 (%)
- Exhibits113: Chart on South America - Market size and forecast 2024-2029 ($ million)
- Exhibits114: Data Table on South America - Market size and forecast 2024-2029 ($ million)
- Exhibits115: Chart on South America - Year-over-year growth 2024-2029 (%)
- Exhibits116: Data Table on South America - Year-over-year growth 2024-2029 (%)
- Exhibits117: Chart on Middle East and Africa - Market size and forecast 2024-2029 ($ million)
- Exhibits118: Data Table on Middle East and Africa - Market size and forecast 2024-2029 ($ million)
- Exhibits119: Chart on Middle East and Africa - Year-over-year growth 2024-2029 (%)
- Exhibits120: Data Table on Middle East and Africa - Year-over-year growth 2024-2029 (%)
- Exhibits121: Chart on US - Market size and forecast 2024-2029 ($ million)
- Exhibits122: Data Table on US - Market size and forecast 2024-2029 ($ million)
- Exhibits123: Chart on US - Year-over-year growth 2024-2029 (%)
- Exhibits124: Data Table on US - Year-over-year growth 2024-2029 (%)
- Exhibits125: Chart on China - Market size and forecast 2024-2029 ($ million)
- Exhibits126: Data Table on China - Market size and forecast 2024-2029 ($ million)
- Exhibits127: Chart on China - Year-over-year growth 2024-2029 (%)
- Exhibits128: Data Table on China - Year-over-year growth 2024-2029 (%)
- Exhibits129: Chart on Japan - Market size and forecast 2024-2029 ($ million)
- Exhibits130: Data Table on Japan - Market size and forecast 2024-2029 ($ million)
- Exhibits131: Chart on Japan - Year-over-year growth 2024-2029 (%)
- Exhibits132: Data Table on Japan - Year-over-year growth 2024-2029 (%)
- Exhibits133: Chart on India - Market size and forecast 2024-2029 ($ million)
- Exhibits134: Data Table on India - Market size and forecast 2024-2029 ($ million)
- Exhibits135: Chart on India - Year-over-year growth 2024-2029 (%)
- Exhibits136: Data Table on India - Year-over-year growth 2024-2029 (%)
- Exhibits137: Chart on South Korea - Market size and forecast 2024-2029 ($ million)
- Exhibits138: Data Table on South Korea - Market size and forecast 2024-2029 ($ million)
- Exhibits139: Chart on South Korea - Year-over-year growth 2024-2029 (%)
- Exhibits140: Data Table on South Korea - Year-over-year growth 2024-2029 (%)
- Exhibits141: Chart on Germany - Market size and forecast 2024-2029 ($ million)
- Exhibits142: Data Table on Germany - Market size and forecast 2024-2029 ($ million)
- Exhibits143: Chart on Germany - Year-over-year growth 2024-2029 (%)
- Exhibits144: Data Table on Germany - Year-over-year growth 2024-2029 (%)
- Exhibits145: Chart on UK - Market size and forecast 2024-2029 ($ million)
- Exhibits146: Data Table on UK - Market size and forecast 2024-2029 ($ million)
- Exhibits147: Chart on UK - Year-over-year growth 2024-2029 (%)
- Exhibits148: Data Table on UK - Year-over-year growth 2024-2029 (%)
- Exhibits149: Chart on Australia - Market size and forecast 2024-2029 ($ million)
- Exhibits150: Data Table on Australia - Market size and forecast 2024-2029 ($ million)
- Exhibits151: Chart on Australia - Year-over-year growth 2024-2029 (%)
- Exhibits152: Data Table on Australia - Year-over-year growth 2024-2029 (%)
- Exhibits153: Chart on Canada - Market size and forecast 2024-2029 ($ million)
- Exhibits154: Data Table on Canada - Market size and forecast 2024-2029 ($ million)
- Exhibits155: Chart on Canada - Year-over-year growth 2024-2029 (%)
- Exhibits156: Data Table on Canada - Year-over-year growth 2024-2029 (%)
- Exhibits157: Chart on France - Market size and forecast 2024-2029 ($ million)
- Exhibits158: Data Table on France - Market size and forecast 2024-2029 ($ million)
- Exhibits159: Chart on France - Year-over-year growth 2024-2029 (%)
- Exhibits160: Data Table on France - Year-over-year growth 2024-2029 (%)
- Exhibits161: Market opportunity By Geographical Landscape ($ million)
- Exhibits162: Data Tables on Market opportunity By Geographical Landscape ($ million)
- Exhibits163: Impact of drivers and challenges in 2024 and 2029
- Exhibits164: Overview on criticality of inputs and factors of differentiation
- Exhibits165: Overview on factors of disruption
- Exhibits166: Impact of key risks on business
- Exhibits167: Companies covered
- Exhibits168: Company ranking index
- Exhibits169: Matrix on companies position and classification
- Exhibits170: AB SKF - Overview
- Exhibits171: AB SKF - Business segments
- Exhibits172: AB SKF - Key news
- Exhibits173: AB SKF - Key offerings
- Exhibits174: AB SKF - Segment focus
- Exhibits175: SWOT
- Exhibits176: Applied Industrial Technologies Inc. - Overview
- Exhibits177: Applied Industrial Technologies Inc. - Business segments
- Exhibits178: Applied Industrial Technologies Inc. - Key news
- Exhibits179: Applied Industrial Technologies Inc. - Key offerings
- Exhibits180: Applied Industrial Technologies Inc. - Segment focus
- Exhibits181: SWOT
- Exhibits182: Bando Chemical Industries Ltd. - Overview
- Exhibits183: Bando Chemical Industries Ltd. - Business segments
- Exhibits184: Bando Chemical Industries Ltd. - Key offerings
- Exhibits185: Bando Chemical Industries Ltd. - Segment focus
- Exhibits186: SWOT
- Exhibits187: Brewer Machine and Gear Co. - Overview
- Exhibits188: Brewer Machine and Gear Co. - Product / Service
- Exhibits189: Brewer Machine and Gear Co. - Key offerings
- Exhibits190: SWOT
- Exhibits191: Continental AG - Overview
- Exhibits192: Continental AG - Business segments
- Exhibits193: Continental AG - Key news
- Exhibits194: Continental AG - Key offerings
- Exhibits195: Continental AG - Segment focus
- Exhibits196: SWOT
- Exhibits197: Dayco IP Holdings LLC - Overview
- Exhibits198: Dayco IP Holdings LLC - Product / Service
- Exhibits199: Dayco IP Holdings LLC - Key offerings
- Exhibits200: SWOT
- Exhibits201: Gates Industrial Corp. Plc - Overview
- Exhibits202: Gates Industrial Corp. Plc - Business segments
- Exhibits203: Gates Industrial Corp. Plc - Key offerings
- Exhibits204: Gates Industrial Corp. Plc - Segment focus
- Exhibits205: SWOT
- Exhibits206: Hangzhou Chinabase Machinery Co. Ltd. - Overview
- Exhibits207: Hangzhou Chinabase Machinery Co. Ltd. - Product / Service
- Exhibits208: Hangzhou Chinabase Machinery Co. Ltd. - Key offerings
- Exhibits209: SWOT
- Exhibits210: Hutchinson SA - Overview
- Exhibits211: Hutchinson SA - Product / Service
- Exhibits212: Hutchinson SA - Key offerings
- Exhibits213: SWOT
- Exhibits214: Litens Automotive - Overview
- Exhibits215: Litens Automotive - Product / Service
- Exhibits216: Litens Automotive - Key offerings
- Exhibits217: SWOT
- Exhibits218: Michelin Group - Overview
- Exhibits219: Michelin Group - Business segments
- Exhibits220: Michelin Group - Key news
- Exhibits221: Michelin Group - Key offerings
- Exhibits222: Michelin Group - Segment focus
- Exhibits223: SWOT
- Exhibits224: Murtfeldt Kunststoffe GmbH and Co. KG - Overview
- Exhibits225: Murtfeldt Kunststoffe GmbH and Co. KG - Product / Service
- Exhibits226: Murtfeldt Kunststoffe GmbH and Co. KG - Key offerings
- Exhibits227: SWOT
- Exhibits228: Regal Rexnord Corp. - Overview
- Exhibits229: Regal Rexnord Corp. - Business segments
- Exhibits230: Regal Rexnord Corp. - Key offerings
- Exhibits231: Regal Rexnord Corp. - Segment focus
- Exhibits232: SWOT
- Exhibits233: The Timken Co. - Overview
- Exhibits234: The Timken Co. - Business segments
- Exhibits235: The Timken Co. - Key news
- Exhibits236: The Timken Co. - Key offerings
- Exhibits237: The Timken Co. - Segment focus
- Exhibits238: SWOT
- Exhibits239: TotalEnergies SE - Overview
- Exhibits240: TotalEnergies SE - Business segments
- Exhibits241: TotalEnergies SE - Key news
- Exhibits242: TotalEnergies SE - Key offerings
- Exhibits243: TotalEnergies SE - Segment focus
- Exhibits244: SWOT
- Exhibits245: Inclusions checklist
- Exhibits246: Exclusions checklist
- Exhibits247: Currency conversion rates for US$
- Exhibits248: Research methodology
- Exhibits249: Information sources
- Exhibits250: Data validation
- Exhibits251: Validation techniques employed for market sizing
- Exhibits252: Data synthesis
- Exhibits253: 360 degree market analysis
- Exhibits254: List of abbreviations
The industrial belt tensioners market is forecasted to grow by USD 167.6 mn during 2024-2029, accelerating at a CAGR of 3.4% during the forecast period. The report on the industrial belt tensioners market provides a holistic analysis, market size and forecast, trends, growth drivers, and challenges, as well as vendor analysis covering around 25 vendors.
The report offers an up-to-date analysis regarding the current market scenario, the latest trends and drivers, and the overall market environment. The market is driven by increasing investments in industrial assets, improvement in sales of belt tensioners with backing of e-commerce, and rising use of belt tensioners in mining industry.
| Market Scope | |
|---|---|
| Base Year | 2025 |
| End Year | 2029 |
| Series Year | 2025-2029 |
| Growth Momentum | Accelerate |
| YOY 2025 | 3.2% |
| CAGR | 3.4% |
| Incremental Value | $167.6 mn |
The study was conducted using an objective combination of primary and secondary information including inputs from key participants in the industry. The report contains a comprehensive market size data, segment with regional analysis and vendor landscape in addition to an analysis of the key companies. Reports have historic and forecast data.
Technavio's industrial belt tensioners market is segmented as below:
By Application
- Material handling industry
- Industrial machinery sector
- Agriculture industry
- Mining and mineral industry
By Type
- Automatic
- Non-automatic
By Material
- Steel tensioners
- Aluminum tensioners
- Plastic tensioners
- Composite material tensioners
By Geographical Landscape
- APAC
- Europe
- North America
- South America
- Middle East and Africa
This study identifies the development of customized belt tensioners as one of the prime reasons driving the industrial belt tensioners market growth during the next few years. Also, rise in e-commerce and logistics and advent of integrated belt tensioners and belt tensioning system will lead to sizable demand in the market.
The report on the industrial belt tensioners market covers the following areas:
- Industrial Belt Tensioners Market sizing
- Industrial Belt Tensioners Market forecast
- Industrial Belt Tensioners Market industry analysis
The robust vendor analysis is designed to help clients improve their market position, and in line with this, this report provides a detailed analysis of several leading industrial belt tensioners market vendors that include AB SKF, Applied Industrial Technologies Inc., Bando Chemical Industries Ltd., Brewer Machine and Gear Co., Continental AG, Dayco IP Holdings LLC, Gates Industrial Corp. Plc, Hangzhou Chinabase Machinery Co. Ltd., Hutchinson SA, Litens Automotive, Michelin Group, Murtfeldt Kunststoffe GmbH and Co. KG, Regal Rexnord Corp., Schaeffler AG, The Timken Co., and TotalEnergies SE. Also, the industrial belt tensioners market analysis report includes information on upcoming trends and challenges that will influence market growth. This is to help companies strategize and leverage all forthcoming growth opportunities.
The publisher presents a detailed picture of the market by the way of study, synthesis, and summation of data from multiple sources by an analysis of key parameters such as profit, pricing, competition, and promotions. It presents various market facets by identifying the key industry influencers. The data presented is comprehensive, reliable, and a result of extensive primary and secondary research. The market research reports provide a complete competitive landscape and an in-depth vendor selection methodology and analysis using qualitative and quantitative research to forecast accurate market growth.
Table of Contents
1 Executive Summary
- 1.1 Market overview
- Executive Summary - Chart on Market Overview
- Executive Summary - Data Table on Market Overview
- Executive Summary - Chart on Global Market Characteristics
- Executive Summary - Chart on Market By Geographical Landscape
- Executive Summary - Chart on Market Segmentation by Application
- Executive Summary - Chart on Market Segmentation by Type
- Executive Summary - Chart on Market Segmentation by Material
- Executive Summary - Chart on Incremental Growth
- Executive Summary - Data Table on Incremental Growth
- Executive Summary - Chart on Company Market Positioning
2 Technavio Analysis
- 2.1 Analysis of price sensitivity, lifecycle, customer purchase basket, adoption rates, and purchase criteria
- Analysis of price sensitivity, lifecycle, customer purchase basket, adoption rates, and purchase criteria
- 2.2 Criticality of inputs and Factors of differentiation
- Overview on criticality of inputs and factors of differentiation
- 2.3 Factors of disruption
- Overview on factors of disruption
- 2.4 Impact of drivers and challenges
- Impact of drivers and challenges in 2024 and 2029
3 Market Landscape
- 3.1 Market ecosystem
- Parent Market
- Data Table on - Parent Market
- 3.2 Market characteristics
- Market characteristics analysis
- 3.3 Value chain analysis
- Value chain analysis
4 Market Sizing
- 4.1 Market definition
- Offerings of companies included in the market definition
- 4.2 Market segment analysis
- Market segments
- 4.3 Market size 2024
- 4.4 Market outlook: Forecast for 2024-2029
- Chart on Global - Market size and forecast 2024-2029 ($ million)
- Data Table on Global - Market size and forecast 2024-2029 ($ million)
- Chart on Global Market: Year-over-year growth 2024-2029 (%)
- Data Table on Global Market: Year-over-year growth 2024-2029 (%)
5 Historic Market Size
- 5.1 Global Industrial Belt Tensioners Market 2019 - 2023
- Historic Market Size - Data Table on Global Industrial Belt Tensioners Market 2019 - 2023 ($ million)
- 5.2 Application segment analysis 2019 - 2023
- Historic Market Size - Application Segment 2019 - 2023 ($ million)
- 5.3 Type segment analysis 2019 - 2023
- Historic Market Size - Type Segment 2019 - 2023 ($ million)
- 5.4 Material segment analysis 2019 - 2023
- Historic Market Size - Material Segment 2019 - 2023 ($ million)
- 5.5 Geography segment analysis 2019 - 2023
- Historic Market Size - Geography Segment 2019 - 2023 ($ million)
- 5.6 Country segment analysis 2019 - 2023
- Historic Market Size - Country Segment 2019 - 2023 ($ million)
6 Qualitative Analysis
- 6.1 Impact of AI on global industrial belt tensioners market
7 Five Forces Analysis
- 7.1 Five forces summary
- Five forces analysis - Comparison between 2024 and 2029
- 7.2 Bargaining power of buyers
- Bargaining power of buyers - Impact of key factors 2024 and 2029
- 7.3 Bargaining power of suppliers
- Bargaining power of suppliers - Impact of key factors in 2024 and 2029
- 7.4 Threat of new entrants
- Threat of new entrants - Impact of key factors in 2024 and 2029
- 7.5 Threat of substitutes
- Threat of substitutes - Impact of key factors in 2024 and 2029
- 7.6 Threat of rivalry
- Threat of rivalry - Impact of key factors in 2024 and 2029
- 7.7 Market condition
- Chart on Market condition - Five forces 2024 and 2029
8 Market Segmentation by Application
- 8.1 Market segments
- Chart on Application - Market share 2024-2029 (%)
- Data Table on Application - Market share 2024-2029 (%)
- 8.2 Comparison by Application
- Chart on Comparison by Application
- Data Table on Comparison by Application
- 8.3 Material handling industry - Market size and forecast 2024-2029
- Chart on Material handling industry - Market size and forecast 2024-2029 ($ million)
- Data Table on Material handling industry - Market size and forecast 2024-2029 ($ million)
- Chart on Material handling industry - Year-over-year growth 2024-2029 (%)
- Data Table on Material handling industry - Year-over-year growth 2024-2029 (%)
- 8.4 Industrial machinery sector - Market size and forecast 2024-2029
- Chart on Industrial machinery sector - Market size and forecast 2024-2029 ($ million)
- Data Table on Industrial machinery sector - Market size and forecast 2024-2029 ($ million)
- Chart on Industrial machinery sector - Year-over-year growth 2024-2029 (%)
- Data Table on Industrial machinery sector - Year-over-year growth 2024-2029 (%)
- 8.5 Agriculture industry - Market size and forecast 2024-2029
- Chart on Agriculture industry - Market size and forecast 2024-2029 ($ million)
- Data Table on Agriculture industry - Market size and forecast 2024-2029 ($ million)
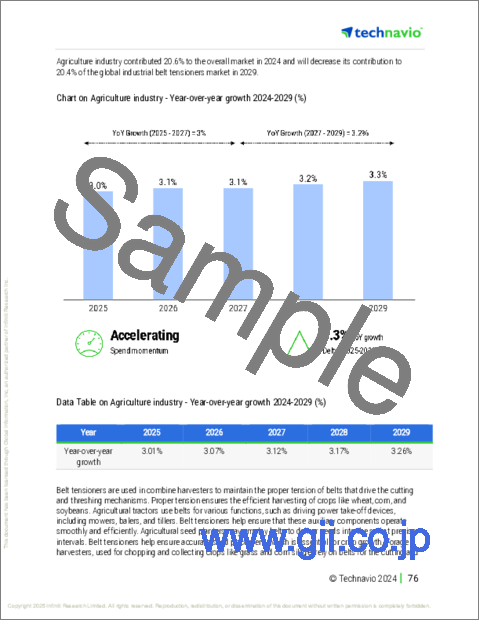
- Chart on Agriculture industry - Year-over-year growth 2024-2029 (%)
- Data Table on Agriculture industry - Year-over-year growth 2024-2029 (%)
- 8.6 Mining and mineral industry - Market size and forecast 2024-2029
- Chart on Mining and mineral industry - Market size and forecast 2024-2029 ($ million)
- Data Table on Mining and mineral industry - Market size and forecast 2024-2029 ($ million)
- Chart on Mining and mineral industry - Year-over-year growth 2024-2029 (%)
- Data Table on Mining and mineral industry - Year-over-year growth 2024-2029 (%)
- 8.7 Market opportunity by Application
- Market opportunity by Application ($ million)
- Data Table on Market opportunity by Application ($ million)
9 Market Segmentation by Type
- 9.1 Market segments
- Chart on Type - Market share 2024-2029 (%)
- Data Table on Type - Market share 2024-2029 (%)
- 9.2 Comparison by Type
- Chart on Comparison by Type
- Data Table on Comparison by Type
- 9.3 Automatic - Market size and forecast 2024-2029
- Chart on Automatic - Market size and forecast 2024-2029 ($ million)
- Data Table on Automatic - Market size and forecast 2024-2029 ($ million)
- Chart on Automatic - Year-over-year growth 2024-2029 (%)
- Data Table on Automatic - Year-over-year growth 2024-2029 (%)
- 9.4 Non-automatic - Market size and forecast 2024-2029
- Chart on Non-automatic - Market size and forecast 2024-2029 ($ million)
- Data Table on Non-automatic - Market size and forecast 2024-2029 ($ million)
- Chart on Non-automatic - Year-over-year growth 2024-2029 (%)
- Data Table on Non-automatic - Year-over-year growth 2024-2029 (%)
- 9.5 Market opportunity by Type
- Market opportunity by Type ($ million)
- Data Table on Market opportunity by Type ($ million)
10 Market Segmentation by Material
- 10.1 Market segments
- Chart on Material - Market share 2024-2029 (%)
- Data Table on Material - Market share 2024-2029 (%)
- 10.2 Comparison by Material
- Chart on Comparison by Material
- Data Table on Comparison by Material
- 10.3 Steel tensioners - Market size and forecast 2024-2029
- Chart on Steel tensioners - Market size and forecast 2024-2029 ($ million)
- Data Table on Steel tensioners - Market size and forecast 2024-2029 ($ million)
- Chart on Steel tensioners - Year-over-year growth 2024-2029 (%)
- Data Table on Steel tensioners - Year-over-year growth 2024-2029 (%)
- 10.4 Aluminum tensioners - Market size and forecast 2024-2029
- Chart on Aluminum tensioners - Market size and forecast 2024-2029 ($ million)
- Data Table on Aluminum tensioners - Market size and forecast 2024-2029 ($ million)
- Chart on Aluminum tensioners - Year-over-year growth 2024-2029 (%)
- Data Table on Aluminum tensioners - Year-over-year growth 2024-2029 (%)
- 10.5 Plastic tensioners - Market size and forecast 2024-2029
- Chart on Plastic tensioners - Market size and forecast 2024-2029 ($ million)
- Data Table on Plastic tensioners - Market size and forecast 2024-2029 ($ million)
- Chart on Plastic tensioners - Year-over-year growth 2024-2029 (%)
- Data Table on Plastic tensioners - Year-over-year growth 2024-2029 (%)
- 10.6 Composite material tensioners - Market size and forecast 2024-2029
- Chart on Composite material tensioners - Market size and forecast 2024-2029 ($ million)
- Data Table on Composite material tensioners - Market size and forecast 2024-2029 ($ million)
- Chart on Composite material tensioners - Year-over-year growth 2024-2029 (%)
- Data Table on Composite material tensioners - Year-over-year growth 2024-2029 (%)
- 10.7 Market opportunity by Material
- Market opportunity by Material ($ million)
- Data Table on Market opportunity by Material ($ million)
11 Customer Landscape
- 11.1 Customer landscape overview
- Analysis of price sensitivity, lifecycle, customer purchase basket, adoption rates, and purchase criteria
12 Geographic Landscape
- 12.1 Geographic segmentation
- Chart on Market share By Geographical Landscape 2024-2029 (%)
- Data Table on Market share By Geographical Landscape 2024-2029 (%)
- 12.2 Geographic comparison
- Chart on Geographic comparison
- Data Table on Geographic comparison
- 12.3 APAC - Market size and forecast 2024-2029
- Chart on APAC - Market size and forecast 2024-2029 ($ million)
- Data Table on APAC - Market size and forecast 2024-2029 ($ million)
- Chart on APAC - Year-over-year growth 2024-2029 (%)
- Data Table on APAC - Year-over-year growth 2024-2029 (%)
- 12.4 Europe - Market size and forecast 2024-2029
- Chart on Europe - Market size and forecast 2024-2029 ($ million)
- Data Table on Europe - Market size and forecast 2024-2029 ($ million)
- Chart on Europe - Year-over-year growth 2024-2029 (%)
- Data Table on Europe - Year-over-year growth 2024-2029 (%)
- 12.5 North America - Market size and forecast 2024-2029
- Chart on North America - Market size and forecast 2024-2029 ($ million)
- Data Table on North America - Market size and forecast 2024-2029 ($ million)
- Chart on North America - Year-over-year growth 2024-2029 (%)
- Data Table on North America - Year-over-year growth 2024-2029 (%)
- 12.6 South America - Market size and forecast 2024-2029
- Chart on South America - Market size and forecast 2024-2029 ($ million)
- Data Table on South America - Market size and forecast 2024-2029 ($ million)
- Chart on South America - Year-over-year growth 2024-2029 (%)
- Data Table on South America - Year-over-year growth 2024-2029 (%)
- 12.7 Middle East and Africa - Market size and forecast 2024-2029
- Chart on Middle East and Africa - Market size and forecast 2024-2029 ($ million)
- Data Table on Middle East and Africa - Market size and forecast 2024-2029 ($ million)
- Chart on Middle East and Africa - Year-over-year growth 2024-2029 (%)
- Data Table on Middle East and Africa - Year-over-year growth 2024-2029 (%)
- 12.8 US - Market size and forecast 2024-2029
- Chart on US - Market size and forecast 2024-2029 ($ million)
- Data Table on US - Market size and forecast 2024-2029 ($ million)
- Chart on US - Year-over-year growth 2024-2029 (%)
- Data Table on US - Year-over-year growth 2024-2029 (%)
- 12.9 China - Market size and forecast 2024-2029
- Chart on China - Market size and forecast 2024-2029 ($ million)
- Data Table on China - Market size and forecast 2024-2029 ($ million)
- Chart on China - Year-over-year growth 2024-2029 (%)
- Data Table on China - Year-over-year growth 2024-2029 (%)
- 12.10 Japan - Market size and forecast 2024-2029
- Chart on Japan - Market size and forecast 2024-2029 ($ million)
- Data Table on Japan - Market size and forecast 2024-2029 ($ million)
- Chart on Japan - Year-over-year growth 2024-2029 (%)
- Data Table on Japan - Year-over-year growth 2024-2029 (%)
- 12.11 India - Market size and forecast 2024-2029
- Chart on India - Market size and forecast 2024-2029 ($ million)
- Data Table on India - Market size and forecast 2024-2029 ($ million)
- Chart on India - Year-over-year growth 2024-2029 (%)
- Data Table on India - Year-over-year growth 2024-2029 (%)
- 12.12 South Korea - Market size and forecast 2024-2029
- Chart on South Korea - Market size and forecast 2024-2029 ($ million)
- Data Table on South Korea - Market size and forecast 2024-2029 ($ million)
- Chart on South Korea - Year-over-year growth 2024-2029 (%)
- Data Table on South Korea - Year-over-year growth 2024-2029 (%)
- 12.13 Germany - Market size and forecast 2024-2029
- Chart on Germany - Market size and forecast 2024-2029 ($ million)
- Data Table on Germany - Market size and forecast 2024-2029 ($ million)
- Chart on Germany - Year-over-year growth 2024-2029 (%)
- Data Table on Germany - Year-over-year growth 2024-2029 (%)
- 12.14 UK - Market size and forecast 2024-2029
- Chart on UK - Market size and forecast 2024-2029 ($ million)
- Data Table on UK - Market size and forecast 2024-2029 ($ million)
- Chart on UK - Year-over-year growth 2024-2029 (%)
- Data Table on UK - Year-over-year growth 2024-2029 (%)
- 12.15 Australia - Market size and forecast 2024-2029
- Chart on Australia - Market size and forecast 2024-2029 ($ million)
- Data Table on Australia - Market size and forecast 2024-2029 ($ million)
- Chart on Australia - Year-over-year growth 2024-2029 (%)
- Data Table on Australia - Year-over-year growth 2024-2029 (%)
- 12.16 Canada - Market size and forecast 2024-2029
- Chart on Canada - Market size and forecast 2024-2029 ($ million)
- Data Table on Canada - Market size and forecast 2024-2029 ($ million)
- Chart on Canada - Year-over-year growth 2024-2029 (%)
- Data Table on Canada - Year-over-year growth 2024-2029 (%)
- 12.17 France - Market size and forecast 2024-2029
- Chart on France - Market size and forecast 2024-2029 ($ million)
- Data Table on France - Market size and forecast 2024-2029 ($ million)
- Chart on France - Year-over-year growth 2024-2029 (%)
- Data Table on France - Year-over-year growth 2024-2029 (%)
- 12.18 Market opportunity By Geographical Landscape
- Market opportunity By Geographical Landscape ($ million)
- Data Tables on Market opportunity By Geographical Landscape ($ million)
13 Drivers, Challenges, and Opportunity/Restraints
- 13.1 Market drivers
- 13.2 Market challenges
- 13.3 Impact of drivers and challenges
- Impact of drivers and challenges in 2024 and 2029
- 13.4 Market opportunities/restraints
14 Competitive Landscape
- 14.1 Overview
- 14.2 Competitive Landscape
- Overview on criticality of inputs and factors of differentiation
- 14.3 Landscape disruption
- Overview on factors of disruption
- 14.4 Industry risks
- Impact of key risks on business
15 Competitive Analysis
- 15.1 Companies profiled
- Companies covered
- 15.2 Company ranking index
- Company ranking index
- 15.3 Market positioning of companies
- Matrix on companies position and classification
- 15.4 AB SKF
- AB SKF - Overview
- AB SKF - Business segments
- AB SKF - Key news
- AB SKF - Key offerings
- AB SKF - Segment focus
- SWOT
- 15.5 Applied Industrial Technologies Inc.
- Applied Industrial Technologies Inc. - Overview
- Applied Industrial Technologies Inc. - Business segments
- Applied Industrial Technologies Inc. - Key news
- Applied Industrial Technologies Inc. - Key offerings
- Applied Industrial Technologies Inc. - Segment focus
- SWOT
- 15.6 Bando Chemical Industries Ltd.
- Bando Chemical Industries Ltd. - Overview
- Bando Chemical Industries Ltd. - Business segments
- Bando Chemical Industries Ltd. - Key offerings
- Bando Chemical Industries Ltd. - Segment focus
- SWOT
- 15.7 Brewer Machine and Gear Co.
- Brewer Machine and Gear Co. - Overview
- Brewer Machine and Gear Co. - Product / Service
- Brewer Machine and Gear Co. - Key offerings
- SWOT
- 15.8 Continental AG
- Continental AG - Overview
- Continental AG - Business segments
- Continental AG - Key news
- Continental AG - Key offerings
- Continental AG - Segment focus
- SWOT
- 15.9 Dayco IP Holdings LLC
- Dayco IP Holdings LLC - Overview
- Dayco IP Holdings LLC - Product / Service
- Dayco IP Holdings LLC - Key offerings
- SWOT
- 15.10 Gates Industrial Corp. Plc
- Gates Industrial Corp. Plc - Overview
- Gates Industrial Corp. Plc - Business segments
- Gates Industrial Corp. Plc - Key offerings
- Gates Industrial Corp. Plc - Segment focus
- SWOT
- 15.11 Hangzhou Chinabase Machinery Co. Ltd.
- Hangzhou Chinabase Machinery Co. Ltd. - Overview
- Hangzhou Chinabase Machinery Co. Ltd. - Product / Service
- Hangzhou Chinabase Machinery Co. Ltd. - Key offerings
- SWOT
- 15.12 Hutchinson SA
- Hutchinson SA - Overview
- Hutchinson SA - Product / Service
- Hutchinson SA - Key offerings
- SWOT
- 15.13 Litens Automotive
- Litens Automotive - Overview
- Litens Automotive - Product / Service
- Litens Automotive - Key offerings
- SWOT
- 15.14 Michelin Group
- Michelin Group - Overview
- Michelin Group - Business segments
- Michelin Group - Key news
- Michelin Group - Key offerings
- Michelin Group - Segment focus
- SWOT
- 15.15 Murtfeldt Kunststoffe GmbH and Co. KG
- Murtfeldt Kunststoffe GmbH and Co. KG - Overview
- Murtfeldt Kunststoffe GmbH and Co. KG - Product / Service
- Murtfeldt Kunststoffe GmbH and Co. KG - Key offerings
- SWOT
- 15.16 Regal Rexnord Corp.
- Regal Rexnord Corp. - Overview
- Regal Rexnord Corp. - Business segments
- Regal Rexnord Corp. - Key offerings
- Regal Rexnord Corp. - Segment focus
- SWOT
- 15.17 The Timken Co.
- The Timken Co. - Overview
- The Timken Co. - Business segments
- The Timken Co. - Key news
- The Timken Co. - Key offerings
- The Timken Co. - Segment focus
- SWOT
- 15.18 TotalEnergies SE
- TotalEnergies SE - Overview
- TotalEnergies SE - Business segments
- TotalEnergies SE - Key news
- TotalEnergies SE - Key offerings
- TotalEnergies SE - Segment focus
- SWOT
16 Appendix
- 16.1 Scope of the report
- 16.2 Inclusions and exclusions checklist
- Inclusions checklist
- Exclusions checklist
- 16.3 Currency conversion rates for US$
- Currency conversion rates for US$
- 16.4 Research methodology
- Research methodology
- 16.5 Data procurement
- Information sources
- 16.6 Data validation
- Data validation
- 16.7 Validation techniques employed for market sizing
- Validation techniques employed for market sizing
- 16.8 Data synthesis
- Data synthesis
- 16.9 360 degree market analysis
- 360 degree market analysis
- 16.10 List of abbreviations
- List of abbreviations

