|
|
市場調査レポート
商品コード
1515698
排出ガス規制触媒の世界市場 2024-2028Global emission control catalysts market 2024-2028 |
||||||
|
|||||||
カスタマイズ可能
|
|||||||


| 排出ガス規制触媒の世界市場 2024-2028 |
|
出版日: 2024年05月20日
発行: TechNavio
ページ情報: 英文 174 Pages
納期: 即納可能
|

全表示
- 概要
- 図表
- 目次
排出ガス規制触媒市場は2023-2028年に40億760万米ドル、予測期間中のCAGRは5.68%で成長すると予測されます。
当レポートでは、排出ガス規制触媒市場の全体的な分析、市場規模・予測、動向、成長促進要因、課題、約25のベンダーを網羅したベンダー分析などを掲載しています。
現在の市場シナリオ、最新動向と促進要因、市場環境全体に関する最新分析を提供しています。市場は、世界の自動車セクターの成長、環境問題への関心と汚染抑制策、排出ガスと燃費の基準枠組みによって牽引されています。
| 市場範囲 | |
|---|---|
| 基準年 | 2024 |
| 終了年 | 2028 |
| 予測期間 | 2024-2028 |
| 成長モメンタム | 加速 |
| 前年比2024年 | 5.29% |
| CAGR | 5.68% |
| 増分額 | 40億760万米ドル |
本調査では、今後数年間の排出ガス規制触媒市場成長を牽引する主要因の1つとして、新興市場がECCS(非常用炉心冷却設備)に大きな展望を提供することを挙げています。また、選択的触媒還元(SCR)触媒の需要増加や、自動車の排ガス低減のために触媒コンバーターを追加することの重要性が高まっていることも、マーケットに大きな需要をもたらすと思われます。
目次
第1章 エグゼクティブサマリー
- 市場概要
第2章 市場情勢
- 市場エコシステム
- 市場の特徴
- バリューチェーン分析
第3章 市場規模の評価
- 市場の定義
- 市場セグメント分析
- 市場規模 2023
- 市場の見通し 2023-2028
第4章 市場規模実績
- 世界排出ガス規制触媒市場 2018-2022
- 用途別セグメント分析 2018-2022
- タイプ別セグメント分析 2018-2022
- 地域別セグメント分析 2018-2022
- 国別セグメント分析 2018-2022
第5章 ファイブフォース分析
- ファイブフォースの要約
- 買い手の交渉力
- 供給企業の交渉力
- 新規参入業者の脅威
- 代替品の脅威
- 競争の脅威
- 市況
第6章 市場セグメンテーション:用途別
- 市場セグメンテーション
- 比較:用途別
- 移動排出:市場規模と予測 2023-2028
- 定常放出:市場規模と予測 2023-2028
- 市場機会:用途別
第7章 市場セグメンテーション:タイプ別
- 市場セグメンテーション
- 比較:タイプ別
- パラジウム:市場規模と予測 2023-2028
- プラチナ:市場規模と予測 2023-2028
- ロジウム:市場規模と予測 2023-2028
- 市場機会:タイプ別
第8章 顧客情勢
- 顧客情勢の概要
第9章 地域別情勢
- 地域別セグメンテーション
- 地域別比較
- アジア太平洋:市場規模と予測 2023-2028
- 欧州:市場規模と予測 2023-2028
- 北米:市場規模と予測 2023-2028
- 南米:市場規模と予測 2023-2028
- 中東・アフリカ:市場規模と予測 2023-2028
- 中国:市場規模と予測 2023-2028
- 米国:市場規模と予測 2023-2028
- ドイツ:市場規模と予測 2023-2028
- 日本:市場規模と予測 2023-2028
- 英国:市場規模と予測 2023-2028
- 市場機会:地域情勢別
第10章 促進要因・課題・機会・抑制要因
- 市場促進要因
- 市場の課題
- 促進要因と課題の影響
- 市場の機会・抑制要因
第11章 競合情勢
- 概要
- 競合情勢
- 混乱の状況
- 業界のリスク
第12章 競合分析
- 企業プロファイル
- 企業の市場ポジショニング
- AeriNOx Inc.
- BASF SE
- CDTi Advanced Materials Inc.
- Clariant International Ltd.
- CORMETECH Inc.
- Cummins Inc.
- DCL International Inc.
- Evonik Industries AG
- Honeywell International Inc.
- Ibiden Co. Ltd.
- Johnson Matthey Plc
- Tenneco Inc.
- Topsoes AS
- Toyota Motor Corp.
- Umicore SA
第13章 付録
Exhibits:
- Exhibits1: Executive Summary - Chart on Market Overview
- Exhibits2: Executive Summary - Data Table on Market Overview
- Exhibits3: Executive Summary - Chart on Global Market Characteristics
- Exhibits4: Executive Summary - Chart on Market By Geographical Landscape
- Exhibits5: Executive Summary - Chart on Market Segmentation by Application
- Exhibits6: Executive Summary - Chart on Market Segmentation by Type
- Exhibits7: Executive Summary - Chart on Incremental Growth
- Exhibits8: Executive Summary - Data Table on Incremental Growth
- Exhibits9: Executive Summary - Chart on Company Market Positioning
- Exhibits10: Parent Market
- Exhibits11: Data Table on - Parent Market
- Exhibits12: Market characteristics analysis
- Exhibits13: Value Chain Analysis
- Exhibits14: Offerings of companies included in the market definition
- Exhibits15: Market segments
- Exhibits16: Chart on Global - Market size and forecast 2023-2028 ($ million)
- Exhibits17: Data Table on Global - Market size and forecast 2023-2028 ($ million)
- Exhibits18: Chart on Global Market: Year-over-year growth 2023-2028 (%)
- Exhibits19: Data Table on Global Market: Year-over-year growth 2023-2028 (%)
- Exhibits20: Historic Market Size - Data Table on Global Emission Control Catalysts Market 2018 - 2022 ($ million)
- Exhibits21: Historic Market Size - Application Segment 2018 - 2022 ($ million)
- Exhibits22: Historic Market Size - Type Segment 2018 - 2022 ($ million)
- Exhibits23: Historic Market Size - Geography Segment 2018 - 2022 ($ million)
- Exhibits24: Historic Market Size - Country Segment 2018 - 2022 ($ million)
- Exhibits25: Five forces analysis - Comparison between 2023 and 2028
- Exhibits26: Bargaining power of buyers - Impact of key factors 2023 and 2028
- Exhibits27: Bargaining power of suppliers - Impact of key factors in 2023 and 2028
- Exhibits28: Threat of new entrants - Impact of key factors in 2023 and 2028
- Exhibits29: Threat of substitutes - Impact of key factors in 2023 and 2028
- Exhibits30: Threat of rivalry - Impact of key factors in 2023 and 2028
- Exhibits31: Chart on Market condition - Five forces 2023 and 2028
- Exhibits32: Chart on Application - Market share 2023-2028 (%)
- Exhibits33: Data Table on Application - Market share 2023-2028 (%)
- Exhibits34: Chart on Comparison by Application
- Exhibits35: Data Table on Comparison by Application
- Exhibits36: Chart on Mobile emission - Market size and forecast 2023-2028 ($ million)
- Exhibits37: Data Table on Mobile emission - Market size and forecast 2023-2028 ($ million)
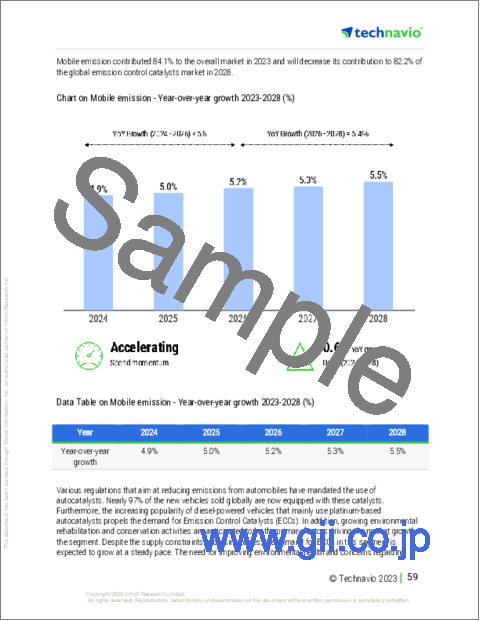
- Exhibits38: Chart on Mobile emission - Year-over-year growth 2023-2028 (%)
- Exhibits39: Data Table on Mobile emission - Year-over-year growth 2023-2028 (%)
- Exhibits40: Chart on Stationary emission - Market size and forecast 2023-2028 ($ million)
- Exhibits41: Data Table on Stationary emission - Market size and forecast 2023-2028 ($ million)
- Exhibits42: Chart on Stationary emission - Year-over-year growth 2023-2028 (%)
- Exhibits43: Data Table on Stationary emission - Year-over-year growth 2023-2028 (%)
- Exhibits44: Market opportunity by Application ($ million)
- Exhibits45: Data Table on Market opportunity by Application ($ million)
- Exhibits46: Chart on Type - Market share 2023-2028 (%)
- Exhibits47: Data Table on Type - Market share 2023-2028 (%)
- Exhibits48: Chart on Comparison by Type
- Exhibits49: Data Table on Comparison by Type
- Exhibits50: Chart on Palladium - Market size and forecast 2023-2028 ($ million)
- Exhibits51: Data Table on Palladium - Market size and forecast 2023-2028 ($ million)
- Exhibits52: Chart on Palladium - Year-over-year growth 2023-2028 (%)
- Exhibits53: Data Table on Palladium - Year-over-year growth 2023-2028 (%)
- Exhibits54: Chart on Platinum - Market size and forecast 2023-2028 ($ million)
- Exhibits55: Data Table on Platinum - Market size and forecast 2023-2028 ($ million)
- Exhibits56: Chart on Platinum - Year-over-year growth 2023-2028 (%)
- Exhibits57: Data Table on Platinum - Year-over-year growth 2023-2028 (%)
- Exhibits58: Chart on Rhodium - Market size and forecast 2023-2028 ($ million)
- Exhibits59: Data Table on Rhodium - Market size and forecast 2023-2028 ($ million)
- Exhibits60: Chart on Rhodium - Year-over-year growth 2023-2028 (%)
- Exhibits61: Data Table on Rhodium - Year-over-year growth 2023-2028 (%)
- Exhibits62: Market opportunity by Type ($ million)
- Exhibits63: Data Table on Market opportunity by Type ($ million)
- Exhibits64: Analysis of price sensitivity, lifecycle, customer purchase basket, adoption rates, and purchase criteria
- Exhibits65: Chart on Market share By Geographical Landscape 2023-2028 (%)
- Exhibits66: Data Table on Market share By Geographical Landscape 2023-2028 (%)
- Exhibits67: Chart on Geographic comparison
- Exhibits68: Data Table on Geographic comparison
- Exhibits69: Chart on APAC - Market size and forecast 2023-2028 ($ million)
- Exhibits70: Data Table on APAC - Market size and forecast 2023-2028 ($ million)
- Exhibits71: Chart on APAC - Year-over-year growth 2023-2028 (%)
- Exhibits72: Data Table on APAC - Year-over-year growth 2023-2028 (%)
- Exhibits73: Chart on Europe - Market size and forecast 2023-2028 ($ million)
- Exhibits74: Data Table on Europe - Market size and forecast 2023-2028 ($ million)
- Exhibits75: Chart on Europe - Year-over-year growth 2023-2028 (%)
- Exhibits76: Data Table on Europe - Year-over-year growth 2023-2028 (%)
- Exhibits77: Chart on North America - Market size and forecast 2023-2028 ($ million)
- Exhibits78: Data Table on North America - Market size and forecast 2023-2028 ($ million)
- Exhibits79: Chart on North America - Year-over-year growth 2023-2028 (%)
- Exhibits80: Data Table on North America - Year-over-year growth 2023-2028 (%)
- Exhibits81: Chart on South America - Market size and forecast 2023-2028 ($ million)
- Exhibits82: Data Table on South America - Market size and forecast 2023-2028 ($ million)
- Exhibits83: Chart on South America - Year-over-year growth 2023-2028 (%)
- Exhibits84: Data Table on South America - Year-over-year growth 2023-2028 (%)
- Exhibits85: Chart on Middle East and Africa - Market size and forecast 2023-2028 ($ million)
- Exhibits86: Data Table on Middle East and Africa - Market size and forecast 2023-2028 ($ million)
- Exhibits87: Chart on Middle East and Africa - Year-over-year growth 2023-2028 (%)
- Exhibits88: Data Table on Middle East and Africa - Year-over-year growth 2023-2028 (%)
- Exhibits89: Chart on China - Market size and forecast 2023-2028 ($ million)
- Exhibits90: Data Table on China - Market size and forecast 2023-2028 ($ million)
- Exhibits91: Chart on China - Year-over-year growth 2023-2028 (%)
- Exhibits92: Data Table on China - Year-over-year growth 2023-2028 (%)
- Exhibits93: Chart on US - Market size and forecast 2023-2028 ($ million)
- Exhibits94: Data Table on US - Market size and forecast 2023-2028 ($ million)
- Exhibits95: Chart on US - Year-over-year growth 2023-2028 (%)
- Exhibits96: Data Table on US - Year-over-year growth 2023-2028 (%)
- Exhibits97: Chart on Germany - Market size and forecast 2023-2028 ($ million)
- Exhibits98: Data Table on Germany - Market size and forecast 2023-2028 ($ million)
- Exhibits99: Chart on Germany - Year-over-year growth 2023-2028 (%)
- Exhibits100: Data Table on Germany - Year-over-year growth 2023-2028 (%)
- Exhibits101: Chart on Japan - Market size and forecast 2023-2028 ($ million)
- Exhibits102: Data Table on Japan - Market size and forecast 2023-2028 ($ million)
- Exhibits103: Chart on Japan - Year-over-year growth 2023-2028 (%)
- Exhibits104: Data Table on Japan - Year-over-year growth 2023-2028 (%)
- Exhibits105: Chart on UK - Market size and forecast 2023-2028 ($ million)
- Exhibits106: Data Table on UK - Market size and forecast 2023-2028 ($ million)
- Exhibits107: Chart on UK - Year-over-year growth 2023-2028 (%)
- Exhibits108: Data Table on UK - Year-over-year growth 2023-2028 (%)
- Exhibits109: Market opportunity By Geographical Landscape ($ million)
- Exhibits110: Data Tables on Market opportunity By Geographical Landscape ($ million)
- Exhibits111: Impact of drivers and challenges in 2023 and 2028
- Exhibits112: Overview on criticality of inputs and factors of differentiation
- Exhibits113: Overview on factors of disruption
- Exhibits114: Impact of key risks on business
- Exhibits115: Companies covered
- Exhibits116: Matrix on companies position and classification
- Exhibits117: AeriNOx Inc. - Overview
- Exhibits118: AeriNOx Inc. - Product / Service
- Exhibits119: AeriNOx Inc. - Key offerings
- Exhibits120: BASF SE - Overview
- Exhibits121: BASF SE - Business segments
- Exhibits122: BASF SE - Key news
- Exhibits123: BASF SE - Key offerings
- Exhibits124: BASF SE - Segment focus
- Exhibits125: CDTi Advanced Materials Inc. - Overview
- Exhibits126: CDTi Advanced Materials Inc. - Product / Service
- Exhibits127: CDTi Advanced Materials Inc. - Key offerings
- Exhibits128: Clariant International Ltd. - Overview
- Exhibits129: Clariant International Ltd. - Business segments
- Exhibits130: Clariant International Ltd. - Key news
- Exhibits131: Clariant International Ltd. - Key offerings
- Exhibits132: Clariant International Ltd. - Segment focus
- Exhibits133: CORMETECH Inc. - Overview
- Exhibits134: CORMETECH Inc. - Product / Service
- Exhibits135: CORMETECH Inc. - Key offerings
- Exhibits136: Cummins Inc. - Overview
- Exhibits137: Cummins Inc. - Business segments
- Exhibits138: Cummins Inc. - Key news
- Exhibits139: Cummins Inc. - Key offerings
- Exhibits140: Cummins Inc. - Segment focus
- Exhibits141: DCL International Inc. - Overview
- Exhibits142: DCL International Inc. - Product / Service
- Exhibits143: DCL International Inc. - Key offerings
- Exhibits144: Evonik Industries AG - Overview
- Exhibits145: Evonik Industries AG - Business segments
- Exhibits146: Evonik Industries AG - Key news
- Exhibits147: Evonik Industries AG - Key offerings
- Exhibits148: Evonik Industries AG - Segment focus
- Exhibits149: Honeywell International Inc. - Overview
- Exhibits150: Honeywell International Inc. - Business segments
- Exhibits151: Honeywell International Inc. - Key news
- Exhibits152: Honeywell International Inc. - Key offerings
- Exhibits153: Honeywell International Inc. - Segment focus
- Exhibits154: Ibiden Co. Ltd. - Overview
- Exhibits155: Ibiden Co. Ltd. - Business segments
- Exhibits156: Ibiden Co. Ltd. - Key offerings
- Exhibits157: Ibiden Co. Ltd. - Segment focus
- Exhibits158: Johnson Matthey Plc - Overview
- Exhibits159: Johnson Matthey Plc - Business segments
- Exhibits160: Johnson Matthey Plc - Key offerings
- Exhibits161: Johnson Matthey Plc - Segment focus
- Exhibits162: Tenneco Inc. - Overview
- Exhibits163: Tenneco Inc. - Product / Service
- Exhibits164: Tenneco Inc. - Key news
- Exhibits165: Tenneco Inc. - Key offerings
- Exhibits166: Topsoes AS - Overview
- Exhibits167: Topsoes AS - Product / Service
- Exhibits168: Topsoes AS - Key offerings
- Exhibits169: Toyota Motor Corp. - Overview
- Exhibits170: Toyota Motor Corp. - Business segments
- Exhibits171: Toyota Motor Corp. - Key news
- Exhibits172: Toyota Motor Corp. - Key offerings
- Exhibits173: Toyota Motor Corp. - Segment focus
- Exhibits174: Umicore SA - Overview
- Exhibits175: Umicore SA - Business segments
- Exhibits176: Umicore SA - Key offerings
- Exhibits177: Umicore SA - Segment focus
- Exhibits178: Inclusions checklist
- Exhibits179: Exclusions checklist
- Exhibits180: Currency conversion rates for US$
- Exhibits181: Research methodology
- Exhibits182: Information sources
- Exhibits183: Data validation
- Exhibits184: Validation techniques employed for market sizing
- Exhibits185: Data synthesis
- Exhibits186: 360 degree market analysis
- Exhibits187: List of abbreviations
The emission control catalysts market is forecasted to grow by USD 4007.6 mn during 2023-2028, accelerating at a CAGR of 5.68% during the forecast period. The report on the emission control catalysts market provides a holistic analysis, market size and forecast, trends, growth drivers, and challenges, as well as vendor analysis covering around 25 vendors.
The report offers an up-to-date analysis regarding the current market scenario, the latest trends and drivers, and the overall market environment. The market is driven by growth in global automotive sector, environmental concerns and measures to curb pollution, and emissions and fuel economy standard frameworks.
Technavio's emission control catalysts market is segmented as below:
| Market Scope | |
|---|---|
| Base Year | 2024 |
| End Year | 2028 |
| Series Year | 2024-2028 |
| Growth Momentum | Accelerate |
| YOY 2024 | 5.29% |
| CAGR | 5.68% |
| Incremental Value | $4007.6mn |
ByApplication
- Mobile emission
- Stationary emission
ByType
- Palladium
- Platinum
- Rhodium
ByGeography
- APAC
- Europe
- North America
- South America
- Middle East and Africa
This study identifies the emerging markets to provide significant prospects for eccs as one of the prime reasons driving the emission control catalysts market growth during the next few years. Also, increased demand for selective catalyst reduction (scr) catalysts and growing importance of adding catalytic converters to reduce automobile emissions will lead to sizable demand in the market.
The report on the emission control catalysts market covers the following areas:
- Emission control catalysts market sizing
- Emission control catalysts market forecast
- Emission control catalysts market industry analysis
The robust vendor analysis is designed to help clients improve their market position, and in line with this, this report provides a detailed analysis of several leading emission control catalysts market vendors that include AeriNOx Inc., Ashland Inc., BASF SE, Catalytic Combustion Corp., CDTi Advanced Materials Inc., Clariant International Ltd., CORMETECH Inc., Cummins Inc., DCL International Inc., DieselNet, Evonik Industries AG, Honeywell International Inc., Ibiden Co. Ltd., Johnson Matthey Plc, S and P Global Inc., Solvay SA, Tenneco Inc., Topsoes AS, Toyota Motor Corp., and Umicore SA. Also, the emission control catalysts market analysis report includes information on upcoming trends and challenges that will influence market growth. This is to help companies strategize and leverage all forthcoming growth opportunities.
The study was conducted using an objective combination of primary and secondary information including inputs from key participants in the industry. The report contains a comprehensive market and vendor landscape in addition to an analysis of the key vendors.
The publisher presents a detailed picture of the market by the way of study, synthesis, and summation of data from multiple sources by an analysis of key parameters such as profit, pricing, competition, and promotions. It presents various market facets by identifying the key industry influencers. The data presented is comprehensive, reliable, and a result of extensive research - both primary and secondary. The market research reports provide a complete competitive landscape and an in-depth vendor selection methodology and analysis using qualitative and quantitative research to forecast the accurate market growth.
Table of Contents
1 Executive Summary
- 1.1 Market overview
- Executive Summary - Chart on Market Overview
- Executive Summary - Data Table on Market Overview
- Executive Summary - Chart on Global Market Characteristics
- Executive Summary - Chart on Market By Geographical Landscape
- Executive Summary - Chart on Market Segmentation by Application
- Executive Summary - Chart on Market Segmentation by Type
- Executive Summary - Chart on Incremental Growth
- Executive Summary - Data Table on Incremental Growth
- Executive Summary - Chart on Company Market Positioning
2 Market Landscape
- 2.1 Market ecosystem
- Parent Market
- Data Table on - Parent Market
- 2.2 Market characteristics
- Market characteristics analysis
- 2.3 Value chain analysis
- Value Chain Analysis
3 Market Sizing
- 3.1 Market definition
- Offerings of companies included in the market definition
- 3.2 Market segment analysis
- Market segments
- 3.3 Market size 2023
- 3.4 Market outlook: Forecast for 2023-2028
- Chart on Global - Market size and forecast 2023-2028 ($ million)
- Data Table on Global - Market size and forecast 2023-2028 ($ million)
- Chart on Global Market: Year-over-year growth 2023-2028 (%)
- Data Table on Global Market: Year-over-year growth 2023-2028 (%)
4 Historic Market Size
- 4.1 Global Emission Control Catalysts Market 2018 - 2022
- Historic Market Size - Data Table on Global Emission Control Catalysts Market 2018 - 2022 ($ million)
- 4.2 Application segment analysis 2018 - 2022
- Historic Market Size - Application Segment 2018 - 2022 ($ million)
- 4.3 Type segment analysis 2018 - 2022
- Historic Market Size - Type Segment 2018 - 2022 ($ million)
- 4.4 Geography segment analysis 2018 - 2022
- Historic Market Size - Geography Segment 2018 - 2022 ($ million)
- 4.5 Country segment analysis 2018 - 2022
- Historic Market Size - Country Segment 2018 - 2022 ($ million)
5 Five Forces Analysis
- 5.1 Five forces summary
- Five forces analysis - Comparison between 2023 and 2028
- 5.2 Bargaining power of buyers
- Bargaining power of buyers - Impact of key factors 2023 and 2028
- 5.3 Bargaining power of suppliers
- Bargaining power of suppliers - Impact of key factors in 2023 and 2028
- 5.4 Threat of new entrants
- Threat of new entrants - Impact of key factors in 2023 and 2028
- 5.5 Threat of substitutes
- Threat of substitutes - Impact of key factors in 2023 and 2028
- 5.6 Threat of rivalry
- Threat of rivalry - Impact of key factors in 2023 and 2028
- 5.7 Market condition
- Chart on Market condition - Five forces 2023 and 2028
6 Market Segmentation by Application
- 6.1 Market segments
- Chart on Application - Market share 2023-2028 (%)
- Data Table on Application - Market share 2023-2028 (%)
- 6.2 Comparison by Application
- Chart on Comparison by Application
- Data Table on Comparison by Application
- 6.3 Mobile emission - Market size and forecast 2023-2028
- Chart on Mobile emission - Market size and forecast 2023-2028 ($ million)
- Data Table on Mobile emission - Market size and forecast 2023-2028 ($ million)
- Chart on Mobile emission - Year-over-year growth 2023-2028 (%)
- Data Table on Mobile emission - Year-over-year growth 2023-2028 (%)
- 6.4 Stationary emission - Market size and forecast 2023-2028
- Chart on Stationary emission - Market size and forecast 2023-2028 ($ million)
- Data Table on Stationary emission - Market size and forecast 2023-2028 ($ million)
- Chart on Stationary emission - Year-over-year growth 2023-2028 (%)
- Data Table on Stationary emission - Year-over-year growth 2023-2028 (%)
- 6.5 Market opportunity by Application
- Market opportunity by Application ($ million)
- Data Table on Market opportunity by Application ($ million)
7 Market Segmentation by Type
- 7.1 Market segments
- Chart on Type - Market share 2023-2028 (%)
- Data Table on Type - Market share 2023-2028 (%)
- 7.2 Comparison by Type
- Chart on Comparison by Type
- Data Table on Comparison by Type
- 7.3 Palladium - Market size and forecast 2023-2028
- Chart on Palladium - Market size and forecast 2023-2028 ($ million)
- Data Table on Palladium - Market size and forecast 2023-2028 ($ million)
- Chart on Palladium - Year-over-year growth 2023-2028 (%)
- Data Table on Palladium - Year-over-year growth 2023-2028 (%)
- 7.4 Platinum - Market size and forecast 2023-2028
- Chart on Platinum - Market size and forecast 2023-2028 ($ million)
- Data Table on Platinum - Market size and forecast 2023-2028 ($ million)
- Chart on Platinum - Year-over-year growth 2023-2028 (%)
- Data Table on Platinum - Year-over-year growth 2023-2028 (%)
- 7.5 Rhodium - Market size and forecast 2023-2028
- Chart on Rhodium - Market size and forecast 2023-2028 ($ million)
- Data Table on Rhodium - Market size and forecast 2023-2028 ($ million)
- Chart on Rhodium - Year-over-year growth 2023-2028 (%)
- Data Table on Rhodium - Year-over-year growth 2023-2028 (%)
- 7.6 Market opportunity by Type
- Market opportunity by Type ($ million)
- Data Table on Market opportunity by Type ($ million)
8 Customer Landscape
- 8.1 Customer landscape overview
- Analysis of price sensitivity, lifecycle, customer purchase basket, adoption rates, and purchase criteria
9 Geographic Landscape
- 9.1 Geographic segmentation
- Chart on Market share By Geographical Landscape 2023-2028 (%)
- Data Table on Market share By Geographical Landscape 2023-2028 (%)
- 9.2 Geographic comparison
- Chart on Geographic comparison
- Data Table on Geographic comparison
- 9.3 APAC - Market size and forecast 2023-2028
- Chart on APAC - Market size and forecast 2023-2028 ($ million)
- Data Table on APAC - Market size and forecast 2023-2028 ($ million)
- Chart on APAC - Year-over-year growth 2023-2028 (%)
- Data Table on APAC - Year-over-year growth 2023-2028 (%)
- 9.4 Europe - Market size and forecast 2023-2028
- Chart on Europe - Market size and forecast 2023-2028 ($ million)
- Data Table on Europe - Market size and forecast 2023-2028 ($ million)
- Chart on Europe - Year-over-year growth 2023-2028 (%)
- Data Table on Europe - Year-over-year growth 2023-2028 (%)
- 9.5 North America - Market size and forecast 2023-2028
- Chart on North America - Market size and forecast 2023-2028 ($ million)
- Data Table on North America - Market size and forecast 2023-2028 ($ million)
- Chart on North America - Year-over-year growth 2023-2028 (%)
- Data Table on North America - Year-over-year growth 2023-2028 (%)
- 9.6 South America - Market size and forecast 2023-2028
- Chart on South America - Market size and forecast 2023-2028 ($ million)
- Data Table on South America - Market size and forecast 2023-2028 ($ million)
- Chart on South America - Year-over-year growth 2023-2028 (%)
- Data Table on South America - Year-over-year growth 2023-2028 (%)
- 9.7 Middle East and Africa - Market size and forecast 2023-2028
- Chart on Middle East and Africa - Market size and forecast 2023-2028 ($ million)
- Data Table on Middle East and Africa - Market size and forecast 2023-2028 ($ million)
- Chart on Middle East and Africa - Year-over-year growth 2023-2028 (%)
- Data Table on Middle East and Africa - Year-over-year growth 2023-2028 (%)
- 9.8 China - Market size and forecast 2023-2028
- Chart on China - Market size and forecast 2023-2028 ($ million)
- Data Table on China - Market size and forecast 2023-2028 ($ million)
- Chart on China - Year-over-year growth 2023-2028 (%)
- Data Table on China - Year-over-year growth 2023-2028 (%)
- 9.9 US - Market size and forecast 2023-2028
- Chart on US - Market size and forecast 2023-2028 ($ million)
- Data Table on US - Market size and forecast 2023-2028 ($ million)
- Chart on US - Year-over-year growth 2023-2028 (%)
- Data Table on US - Year-over-year growth 2023-2028 (%)
- 9.10 Germany - Market size and forecast 2023-2028
- Chart on Germany - Market size and forecast 2023-2028 ($ million)
- Data Table on Germany - Market size and forecast 2023-2028 ($ million)
- Chart on Germany - Year-over-year growth 2023-2028 (%)
- Data Table on Germany - Year-over-year growth 2023-2028 (%)
- 9.11 Japan - Market size and forecast 2023-2028
- Chart on Japan - Market size and forecast 2023-2028 ($ million)
- Data Table on Japan - Market size and forecast 2023-2028 ($ million)
- Chart on Japan - Year-over-year growth 2023-2028 (%)
- Data Table on Japan - Year-over-year growth 2023-2028 (%)
- 9.12 UK - Market size and forecast 2023-2028
- Chart on UK - Market size and forecast 2023-2028 ($ million)
- Data Table on UK - Market size and forecast 2023-2028 ($ million)
- Chart on UK - Year-over-year growth 2023-2028 (%)
- Data Table on UK - Year-over-year growth 2023-2028 (%)
- 9.13 Market opportunity By Geographical Landscape
- Market opportunity By Geographical Landscape ($ million)
- Data Tables on Market opportunity By Geographical Landscape ($ million)
10 Drivers, Challenges, and Opportunity/Restraints
- 10.1 Market drivers
- 10.2 Market challenges
- 10.3 Impact of drivers and challenges
- Impact of drivers and challenges in 2023 and 2028
- 10.4 Market opportunities/restraints
11 Competitive Landscape
- 11.1 Overview
- 11.2 Competitive Landscape
- Overview on criticality of inputs and factors of differentiation
- 11.3 Landscape disruption
- Overview on factors of disruption
- 11.4 Industry risks
- Impact of key risks on business
12 Competitive Analysis
- 12.1 Companies profiled
- Companies covered
- 12.2 Market positioning of companies
- Matrix on companies position and classification
- 12.3 AeriNOx Inc.
- AeriNOx Inc. - Overview
- AeriNOx Inc. - Product / Service
- AeriNOx Inc. - Key offerings
- 12.4 BASF SE
- BASF SE - Overview
- BASF SE - Business segments
- BASF SE - Key news
- BASF SE - Key offerings
- BASF SE - Segment focus
- 12.5 CDTi Advanced Materials Inc.
- CDTi Advanced Materials Inc. - Overview
- CDTi Advanced Materials Inc. - Product / Service
- CDTi Advanced Materials Inc. - Key offerings
- 12.6 Clariant International Ltd.
- Clariant International Ltd. - Overview
- Clariant International Ltd. - Business segments
- Clariant International Ltd. - Key news
- Clariant International Ltd. - Key offerings
- Clariant International Ltd. - Segment focus
- 12.7 CORMETECH Inc.
- CORMETECH Inc. - Overview
- CORMETECH Inc. - Product / Service
- CORMETECH Inc. - Key offerings
- 12.8 Cummins Inc.
- Cummins Inc. - Overview
- Cummins Inc. - Business segments
- Cummins Inc. - Key news
- Cummins Inc. - Key offerings
- Cummins Inc. - Segment focus
- 12.9 DCL International Inc.
- DCL International Inc. - Overview
- DCL International Inc. - Product / Service
- DCL International Inc. - Key offerings
- 12.10 Evonik Industries AG
- Evonik Industries AG - Overview
- Evonik Industries AG - Business segments
- Evonik Industries AG - Key news
- Evonik Industries AG - Key offerings
- Evonik Industries AG - Segment focus
- 12.11 Honeywell International Inc.
- Honeywell International Inc. - Overview
- Honeywell International Inc. - Business segments
- Honeywell International Inc. - Key news
- Honeywell International Inc. - Key offerings
- Honeywell International Inc. - Segment focus
- 12.12 Ibiden Co. Ltd.
- Ibiden Co. Ltd. - Overview
- Ibiden Co. Ltd. - Business segments
- Ibiden Co. Ltd. - Key offerings
- Ibiden Co. Ltd. - Segment focus
- 12.13 Johnson Matthey Plc
- Johnson Matthey Plc - Overview
- Johnson Matthey Plc - Business segments
- Johnson Matthey Plc - Key offerings
- Johnson Matthey Plc - Segment focus
- 12.14 Tenneco Inc.
- Tenneco Inc. - Overview
- Tenneco Inc. - Product / Service
- Tenneco Inc. - Key news
- Tenneco Inc. - Key offerings
- 12.15 Topsoes AS
- Topsoes AS - Overview
- Topsoes AS - Product / Service
- Topsoes AS - Key offerings
- 12.16 Toyota Motor Corp.
- Toyota Motor Corp. - Overview
- Toyota Motor Corp. - Business segments
- Toyota Motor Corp. - Key news
- Toyota Motor Corp. - Key offerings
- Toyota Motor Corp. - Segment focus
- 12.17 Umicore SA
- Umicore SA - Overview
- Umicore SA - Business segments
- Umicore SA - Key offerings
- Umicore SA - Segment focus
13 Appendix
- 13.1 Scope of the report
- 13.2 Inclusions and exclusions checklist
- Inclusions checklist
- Exclusions checklist
- 13.3 Currency conversion rates for US$
- Currency conversion rates for US$
- 13.4 Research methodology
- Research methodology
- 13.5 Data procurement
- Information sources
- 13.6 Data validation
- Data validation
- 13.7 Validation techniques employed for market sizing
- Validation techniques employed for market sizing
- 13.8 Data synthesis
- Data synthesis
- 13.9 360 degree market analysis
- 360 degree market analysis
- 13.10 List of abbreviations
- List of abbreviations

