|
|
市場調査レポート
商品コード
1558449
無人搬送車(AGV)の世界市場、2024~2028年Global Automated Guided Vehicle (AGV) Market 2024-2028 |
||||||
|
|||||||
カスタマイズ可能
|
|||||||

| 無人搬送車(AGV)の世界市場、2024~2028年 |
|
出版日: 2024年08月14日
発行: TechNavio
ページ情報: 英文 188 Pages
納期: 即納可能
|

全表示
- 概要
- 図表
- 目次
無人搬送車(AGV)市場、2024~2028年
無人搬送車(AGV)市場は2023~2028年に15億9,560万米ドル、予測期間中のCAGRは9.45%で成長すると予測されます。当レポートでは、無人搬送車(AGV)市場の全体的な分析、市場規模・予測、動向、成長促進要因、課題、約25のベンダーを網羅したベンダー分析などを掲載しています。
現在の市場シナリオ、最新動向と促進要因、市場環境全体に関する最新分析を提供しています。市場は、eコマース小売の急成長、製造プロセスにおける自動化の採用拡大、倉庫業務効率化のニーズによって牽引されています。
| 市場範囲 | |
|---|---|
| 基準年 | 2024年 |
| 終了年 | 2028年 |
| 予測期間 | 2024~2028年 |
| 成長モメンタム | 加速 |
| 前年比[2024年] | 8.42% |
| CAGR | 9.45% |
| 増分額 | 15億9,560万米ドル |
本調査では、今後数年間の無人搬送車(AGV)市場の成長を促進する主要要因の1つとして、冷蔵倉庫や半導体産業におけるagvsの用途拡大を挙げています。また、倉庫の自動化が進み、インダストリー4.0の採用が増加していることも、市場の大きな需要につながると考えられます。
目次
第1章 エグゼクティブサマリー
- 市場概要
第2章 市場情勢
- 市場エコシステム
- 市場の特徴
- バリューチェーン分析
第3章 市場規模の評価
- 市場の定義
- 市場セグメント分析
- 市場規模 2023年
- 市場の展望 2023~2028年
第4章 市場規模実績
- 無人搬送車(AGV)の世界市場 2018~2022年
- 製品別セグメント分析 2018~2022年
- エンドユーザー別セグメント分析 2018~2022年
- 地域別セグメント分析 2018~2022年
- 国別セグメント分析 2018~2022年
第5章 ファイブフォース分析
- ファイブフォースの要約
- 買い手の交渉力
- 供給企業の交渉力
- 新規参入業者の脅威
- 代替品の脅威
- 競争の脅威
- 市況
第6章 市場セグメンテーション:製品別
- 市場セグメンテーション
- 比較:製品別
- ユニットロードキャリア:市場規模と予測 2023~2028年
- 牽引車:市場規模と予測 2023~2028年
- パレットトラック:市場規模と予測 2023~2028年
- 組立ライン車両:市場規模と予測 2023~2028年
- その他:市場規模と予測 2023~2028年
- 市場機会:製品別
第7章 市場セグメンテーション:エンドユーザー別
- 市場セグメンテーション
- 比較:エンドユーザー別
- 自動車:市場規模と予測 2023~2028年
- 飲食品:市場規模と予測 2023~2028年
- 電子・電気:市場規模と予測 2023~2028年
- 医薬品:市場規模と予測 2023~2028年
- その他:市場規模と予測 2023~2028年
- 市場機会:エンドユーザー別
第8章 顧客情勢
- 顧客情勢概要
第9章 地域別情勢
- 地域別セグメンテーション
- 比較:地域別
- 欧州:市場規模と予測 2023~2028年
- アジア太平洋:市場規模と予測 2023~2028年
- 北米:市場規模と予測 2023~2028年
- 南米:市場規模と予測 2023~2028年
- 中東・アフリカ:市場規模と予測 2023~2028年
- 米国:市場規模と予測 2023~2028年
- ドイツ:市場規模と予測 2023~2028年
- 日本:市場規模と予測 2023~2028年
- 中国:市場規模と予測 2023~2028年
- 英国:市場規模と予測 2023~2028年
- 市場機会:地域情勢別
第10章 促進要因・課題・機会・抑制要因
- 市場促進要因
- 市場課題
- 促進要因と課題の影響
- 市場の機会・抑制要因
第11章 競合情勢
- 概要
- 競合情勢
- 混乱の状況
- 業界のリスク
第12章 競合分析
- 企業プロファイル
- 企業の市場ポジショニング
- Aichikikai Techno System Co. Ltd.
- Atab Automationsteknik AB
- Beumer Group GmbH and Co. KG
- Daifuku Co. Ltd.
- Dearborn Mid West Co.
- ek robotics GmbH
- Hitachi Ltd.
- Hyster Yale Materials Handling Inc.
- John Bean Technologies Corp.
- KION GROUP AG
- MIDEA Group Co. Ltd.
- Murata Machinery Ltd.
- Seegrid Corp.
- SSI Schafer IT Solutions GmbH
- Toyota Industries Corp.
第13章 付録
Exhibits:
- Exhibits1: Executive Summary - Chart on Market Overview
- Exhibits2: Executive Summary - Data Table on Market Overview
- Exhibits3: Executive Summary - Chart on Global Market Characteristics
- Exhibits4: Executive Summary - Chart on Market By Geographical Landscape
- Exhibits5: Executive Summary - Chart on Market Segmentation by Product
- Exhibits6: Executive Summary - Chart on Market Segmentation by End-user
- Exhibits7: Executive Summary - Chart on Incremental Growth
- Exhibits8: Executive Summary - Data Table on Incremental Growth
- Exhibits9: Executive Summary - Chart on Company Market Positioning
- Exhibits10: Parent Market
- Exhibits11: Data Table on - Parent Market
- Exhibits12: Market characteristics analysis
- Exhibits13: Value Chain Analysis
- Exhibits14: Offerings of companies included in the market definition
- Exhibits15: Market segments
- Exhibits16: Chart on Global - Market size and forecast 2023-2028 ($ million)
- Exhibits17: Data Table on Global - Market size and forecast 2023-2028 ($ million)
- Exhibits18: Chart on Global Market: Year-over-year growth 2023-2028 (%)
- Exhibits19: Data Table on Global Market: Year-over-year growth 2023-2028 (%)
- Exhibits20: Historic Market Size - Data Table on Global Automated Guided Vehicle (AGV) Market 2018 - 2022 ($ million)
- Exhibits21: Historic Market Size - Product Segment 2018 - 2022 ($ million)
- Exhibits22: Historic Market Size - End-user Segment 2018 - 2022 ($ million)
- Exhibits23: Historic Market Size - Geography Segment 2018 - 2022 ($ million)
- Exhibits24: Historic Market Size - Country Segment 2018 - 2022 ($ million)
- Exhibits25: Five forces analysis - Comparison between 2023 and 2028
- Exhibits26: Bargaining power of buyers - Impact of key factors 2023 and 2028
- Exhibits27: Bargaining power of suppliers - Impact of key factors in 2023 and 2028
- Exhibits28: Threat of new entrants - Impact of key factors in 2023 and 2028
- Exhibits29: Threat of substitutes - Impact of key factors in 2023 and 2028
- Exhibits30: Threat of rivalry - Impact of key factors in 2023 and 2028
- Exhibits31: Chart on Market condition - Five forces 2023 and 2028
- Exhibits32: Chart on Product - Market share 2023-2028 (%)
- Exhibits33: Data Table on Product - Market share 2023-2028 (%)
- Exhibits34: Chart on Comparison by Product
- Exhibits35: Data Table on Comparison by Product
- Exhibits36: Chart on Unit load carrier - Market size and forecast 2023-2028 ($ million)
- Exhibits37: Data Table on Unit load carrier - Market size and forecast 2023-2028 ($ million)
- Exhibits38: Chart on Unit load carrier - Year-over-year growth 2023-2028 (%)
- Exhibits39: Data Table on Unit load carrier - Year-over-year growth 2023-2028 (%)
- Exhibits40: Chart on Tow vehicle - Market size and forecast 2023-2028 ($ million)
- Exhibits41: Data Table on Tow vehicle - Market size and forecast 2023-2028 ($ million)
- Exhibits42: Chart on Tow vehicle - Year-over-year growth 2023-2028 (%)
- Exhibits43: Data Table on Tow vehicle - Year-over-year growth 2023-2028 (%)
- Exhibits44: Chart on Pallet truck - Market size and forecast 2023-2028 ($ million)
- Exhibits45: Data Table on Pallet truck - Market size and forecast 2023-2028 ($ million)
- Exhibits46: Chart on Pallet truck - Year-over-year growth 2023-2028 (%)
- Exhibits47: Data Table on Pallet truck - Year-over-year growth 2023-2028 (%)
- Exhibits48: Chart on Assembly line vehicle - Market size and forecast 2023-2028 ($ million)
- Exhibits49: Data Table on Assembly line vehicle - Market size and forecast 2023-2028 ($ million)
- Exhibits50: Chart on Assembly line vehicle - Year-over-year growth 2023-2028 (%)
- Exhibits51: Data Table on Assembly line vehicle - Year-over-year growth 2023-2028 (%)
- Exhibits52: Chart on Others - Market size and forecast 2023-2028 ($ million)
- Exhibits53: Data Table on Others - Market size and forecast 2023-2028 ($ million)
- Exhibits54: Chart on Others - Year-over-year growth 2023-2028 (%)
- Exhibits55: Data Table on Others - Year-over-year growth 2023-2028 (%)
- Exhibits56: Market opportunity by Product ($ million)
- Exhibits57: Data Table on Market opportunity by Product ($ million)
- Exhibits58: Chart on End-user - Market share 2023-2028 (%)
- Exhibits59: Data Table on End-user - Market share 2023-2028 (%)
- Exhibits60: Chart on Comparison by End-user
- Exhibits61: Data Table on Comparison by End-user
- Exhibits62: Chart on Automotive - Market size and forecast 2023-2028 ($ million)
- Exhibits63: Data Table on Automotive - Market size and forecast 2023-2028 ($ million)
- Exhibits64: Chart on Automotive - Year-over-year growth 2023-2028 (%)
- Exhibits65: Data Table on Automotive - Year-over-year growth 2023-2028 (%)
- Exhibits66: Chart on Food and beverages - Market size and forecast 2023-2028 ($ million)
- Exhibits67: Data Table on Food and beverages - Market size and forecast 2023-2028 ($ million)
- Exhibits68: Chart on Food and beverages - Year-over-year growth 2023-2028 (%)
- Exhibits69: Data Table on Food and beverages - Year-over-year growth 2023-2028 (%)
- Exhibits70: Chart on Electronics and electrical - Market size and forecast 2023-2028 ($ million)
- Exhibits71: Data Table on Electronics and electrical - Market size and forecast 2023-2028 ($ million)
- Exhibits72: Chart on Electronics and electrical - Year-over-year growth 2023-2028 (%)
- Exhibits73: Data Table on Electronics and electrical - Year-over-year growth 2023-2028 (%)
- Exhibits74: Chart on Pharmaceuticals - Market size and forecast 2023-2028 ($ million)
- Exhibits75: Data Table on Pharmaceuticals - Market size and forecast 2023-2028 ($ million)
- Exhibits76: Chart on Pharmaceuticals - Year-over-year growth 2023-2028 (%)
- Exhibits77: Data Table on Pharmaceuticals - Year-over-year growth 2023-2028 (%)
- Exhibits78: Chart on Others - Market size and forecast 2023-2028 ($ million)
- Exhibits79: Data Table on Others - Market size and forecast 2023-2028 ($ million)
- Exhibits80: Chart on Others - Year-over-year growth 2023-2028 (%)
- Exhibits81: Data Table on Others - Year-over-year growth 2023-2028 (%)
- Exhibits82: Market opportunity by End-user ($ million)
- Exhibits83: Data Table on Market opportunity by End-user ($ million)
- Exhibits84: Analysis of price sensitivity, lifecycle, customer purchase basket, adoption rates, and purchase criteria
- Exhibits85: Chart on Market share By Geographical Landscape 2023-2028 (%)
- Exhibits86: Data Table on Market share By Geographical Landscape 2023-2028 (%)
- Exhibits87: Chart on Geographic comparison
- Exhibits88: Data Table on Geographic comparison
- Exhibits89: Chart on Europe - Market size and forecast 2023-2028 ($ million)
- Exhibits90: Data Table on Europe - Market size and forecast 2023-2028 ($ million)
- Exhibits91: Chart on Europe - Year-over-year growth 2023-2028 (%)
- Exhibits92: Data Table on Europe - Year-over-year growth 2023-2028 (%)
- Exhibits93: Chart on APAC - Market size and forecast 2023-2028 ($ million)
- Exhibits94: Data Table on APAC - Market size and forecast 2023-2028 ($ million)
- Exhibits95: Chart on APAC - Year-over-year growth 2023-2028 (%)
- Exhibits96: Data Table on APAC - Year-over-year growth 2023-2028 (%)
- Exhibits97: Chart on North America - Market size and forecast 2023-2028 ($ million)
- Exhibits98: Data Table on North America - Market size and forecast 2023-2028 ($ million)
- Exhibits99: Chart on North America - Year-over-year growth 2023-2028 (%)
- Exhibits100: Data Table on North America - Year-over-year growth 2023-2028 (%)
- Exhibits101: Chart on South America - Market size and forecast 2023-2028 ($ million)
- Exhibits102: Data Table on South America - Market size and forecast 2023-2028 ($ million)
- Exhibits103: Chart on South America - Year-over-year growth 2023-2028 (%)
- Exhibits104: Data Table on South America - Year-over-year growth 2023-2028 (%)
- Exhibits105: Chart on Middle East and Africa - Market size and forecast 2023-2028 ($ million)
- Exhibits106: Data Table on Middle East and Africa - Market size and forecast 2023-2028 ($ million)
- Exhibits107: Chart on Middle East and Africa - Year-over-year growth 2023-2028 (%)
- Exhibits108: Data Table on Middle East and Africa - Year-over-year growth 2023-2028 (%)
- Exhibits109: Chart on US - Market size and forecast 2023-2028 ($ million)
- Exhibits110: Data Table on US - Market size and forecast 2023-2028 ($ million)
- Exhibits111: Chart on US - Year-over-year growth 2023-2028 (%)
- Exhibits112: Data Table on US - Year-over-year growth 2023-2028 (%)
- Exhibits113: Chart on Germany - Market size and forecast 2023-2028 ($ million)
- Exhibits114: Data Table on Germany - Market size and forecast 2023-2028 ($ million)
- Exhibits115: Chart on Germany - Year-over-year growth 2023-2028 (%)
- Exhibits116: Data Table on Germany - Year-over-year growth 2023-2028 (%)
- Exhibits117: Chart on Japan - Market size and forecast 2023-2028 ($ million)
- Exhibits118: Data Table on Japan - Market size and forecast 2023-2028 ($ million)
- Exhibits119: Chart on Japan - Year-over-year growth 2023-2028 (%)
- Exhibits120: Data Table on Japan - Year-over-year growth 2023-2028 (%)
- Exhibits121: Chart on China - Market size and forecast 2023-2028 ($ million)
- Exhibits122: Data Table on China - Market size and forecast 2023-2028 ($ million)
- Exhibits123: Chart on China - Year-over-year growth 2023-2028 (%)
- Exhibits124: Data Table on China - Year-over-year growth 2023-2028 (%)
- Exhibits125: Chart on UK - Market size and forecast 2023-2028 ($ million)
- Exhibits126: Data Table on UK - Market size and forecast 2023-2028 ($ million)
- Exhibits127: Chart on UK - Year-over-year growth 2023-2028 (%)
- Exhibits128: Data Table on UK - Year-over-year growth 2023-2028 (%)
- Exhibits129: Market opportunity By Geographical Landscape ($ million)
- Exhibits130: Data Tables on Market opportunity By Geographical Landscape ($ million)
- Exhibits131: Impact of drivers and challenges in 2023 and 2028
- Exhibits132: Overview on criticality of inputs and factors of differentiation
- Exhibits133: Overview on factors of disruption
- Exhibits134: Impact of key risks on business
- Exhibits135: Companies covered
- Exhibits136: Matrix on companies position and classification
- Exhibits137: Aichikikai Techno System Co. Ltd. - Overview
- Exhibits138: Aichikikai Techno System Co. Ltd. - Product / Service
- Exhibits139: Aichikikai Techno System Co. Ltd. - Key offerings
- Exhibits140: Atab Automationsteknik AB - Overview
- Exhibits141: Atab Automationsteknik AB - Product / Service
- Exhibits142: Atab Automationsteknik AB - Key offerings
- Exhibits143: Beumer Group GmbH and Co. KG - Overview
- Exhibits144: Beumer Group GmbH and Co. KG - Product / Service
- Exhibits145: Beumer Group GmbH and Co. KG - Key offerings
- Exhibits146: Daifuku Co. Ltd. - Overview
- Exhibits147: Daifuku Co. Ltd. - Product / Service
- Exhibits148: Daifuku Co. Ltd. - Key news
- Exhibits149: Daifuku Co. Ltd. - Key offerings
- Exhibits150: Dearborn Mid West Co. - Overview
- Exhibits151: Dearborn Mid West Co. - Product / Service
- Exhibits152: Dearborn Mid West Co. - Key offerings
- Exhibits153: ek robotics GmbH - Overview
- Exhibits154: ek robotics GmbH - Product / Service
- Exhibits155: ek robotics GmbH - Key offerings
- Exhibits156: Hitachi Ltd. - Overview
- Exhibits157: Hitachi Ltd. - Business segments
- Exhibits158: Hitachi Ltd. - Key news
- Exhibits159: Hitachi Ltd. - Key offerings
- Exhibits160: Hitachi Ltd. - Segment focus
- Exhibits161: Hyster Yale Materials Handling Inc. - Overview
- Exhibits162: Hyster Yale Materials Handling Inc. - Business segments
- Exhibits163: Hyster Yale Materials Handling Inc. - Key news
- Exhibits164: Hyster Yale Materials Handling Inc. - Key offerings
- Exhibits165: Hyster Yale Materials Handling Inc. - Segment focus
- Exhibits166: John Bean Technologies Corp. - Overview
- Exhibits167: John Bean Technologies Corp. - Business segments
- Exhibits168: John Bean Technologies Corp. - Key news
- Exhibits169: John Bean Technologies Corp. - Key offerings
- Exhibits170: John Bean Technologies Corp. - Segment focus
- Exhibits171: KION GROUP AG - Overview
- Exhibits172: KION GROUP AG - Business segments
- Exhibits173: KION GROUP AG - Key news
- Exhibits174: KION GROUP AG - Key offerings
- Exhibits175: KION GROUP AG - Segment focus
- Exhibits176: MIDEA Group Co. Ltd. - Overview
- Exhibits177: MIDEA Group Co. Ltd. - Product / Service
- Exhibits178: MIDEA Group Co. Ltd. - Key news
- Exhibits179: MIDEA Group Co. Ltd. - Key offerings
- Exhibits180: Murata Machinery Ltd. - Overview
- Exhibits181: Murata Machinery Ltd. - Business segments
- Exhibits182: Murata Machinery Ltd. - Key news
- Exhibits183: Murata Machinery Ltd. - Key offerings
- Exhibits184: Murata Machinery Ltd. - Segment focus
- Exhibits185: Seegrid Corp. - Overview
- Exhibits186: Seegrid Corp. - Product / Service
- Exhibits187: Seegrid Corp. - Key offerings
- Exhibits188: SSI Schafer IT Solutions GmbH - Overview
- Exhibits189: SSI Schafer IT Solutions GmbH - Product / Service
- Exhibits190: SSI Schafer IT Solutions GmbH - Key offerings
- Exhibits191: Toyota Industries Corp. - Overview
- Exhibits192: Toyota Industries Corp. - Business segments
- Exhibits193: Toyota Industries Corp. - Key news
- Exhibits194: Toyota Industries Corp. - Key offerings
- Exhibits195: Toyota Industries Corp. - Segment focus
- Exhibits196: Inclusions checklist
- Exhibits197: Exclusions checklist
- Exhibits198: Currency conversion rates for US$
- Exhibits199: Research methodology
- Exhibits200: Information sources
- Exhibits201: Data validation
- Exhibits202: Validation techniques employed for market sizing
- Exhibits203: Data synthesis
- Exhibits204: 360 degree market analysis
- Exhibits205: List of abbreviations
Automated Guided Vehicle (AGV) Market 2024-2028
The automated guided vehicle (AGV) market is forecasted to grow by USD 1595.6 mn during 2023-2028, accelerating at a CAGR of 9.45% during the forecast period. The report on the automated guided vehicle (AGV) market provides a holistic analysis, market size and forecast, trends, growth drivers, and challenges, as well as vendor analysis covering around 25 vendors.
The report offers an up-to-date analysis regarding the current market scenario, the latest trends and drivers, and the overall market environment. The market is driven by rapid growth in E-commerce retail, growing adoption of automation in manufacturing process, and need for improving warehouse operational efficiency.
| Market Scope | |
|---|---|
| Base Year | 2024 |
| End Year | 2028 |
| Series Year | 2024-2028 |
| Growth Momentum | Accelerate |
| YOY 2024 | 8.42% |
| CAGR | 9.45% |
| Incremental Value | $1595.6 mn |
Technavio's automated guided vehicle (AGV) market is segmented as below:
By Product
- Unit load carrier
- Tow vehicle
- Pallet truck
- Assembly line vehicle
- Others
By End-user
- Automotive
- Food and beverages
- Electronics and electrical
- Pharmaceuticals
- Others
By Geographical Landscape
- Europe
- APAC
- North America
- South America
- Middle East and Africa
This study identifies the growing applications of agvs in refrigerated warehousing and semiconductor industries as one of the prime reasons driving the automated guided vehicle (AGV) market growth during the next few years. Also, rising warehouse automation and growing adoption of industry 4.0 will lead to sizable demand in the market.
The report on the automated guided vehicle (AGV) market covers the following areas:
- Automated guided vehicle (AGV) market sizing
- Automated guided vehicle (AGV) market forecast
- Automated guided vehicle (AGV) market industry analysis
The robust vendor analysis is designed to help clients improve their market position, and in line with this, this report provides a detailed analysis of several leading automated guided vehicle (AGV) market vendors that include Aichikikai Techno System Co. Ltd., Atab Automationsteknik AB, Balyo SA, Beumer Group GmbH and Co. KG, Daifuku Co. Ltd., Dearborn Mid West Co., ek robotics GmbH, Exail Technologies, Hitachi Ltd., Hyster Yale Materials Handling Inc., John Bean Technologies Corp., KION GROUP AG, Meidensha Corp., MIDEA Group Co. Ltd., Murata Machinery Ltd., Oceaneering International Inc., Scott Technology Ltd., Seegrid Corp., SSI Schafer IT Solutions GmbH, and Toyota Industries Corp.. Also, the automated guided vehicle (AGV) market analysis report includes information on upcoming trends and challenges that will influence market growth. This is to help companies strategize and leverage all forthcoming growth opportunities.
The study was conducted using an objective combination of primary and secondary information including inputs from key participants in the industry. The report contains a comprehensive market and vendor landscape in addition to an analysis of the key vendors.
The publisher presents a detailed picture of the market by the way of study, synthesis, and summation of data from multiple sources by an analysis of key parameters such as profit, pricing, competition, and promotions. It presents various market facets by identifying the key industry influencers. The data presented is comprehensive, reliable, and a result of extensive research - both primary and secondary. The market research reports provide a complete competitive landscape and an in-depth vendor selection methodology and analysis using qualitative and quantitative research to forecast the accurate market growth.
Table of Contents
1 Executive Summary
- 1.1 Market overview
- Executive Summary - Chart on Market Overview
- Executive Summary - Data Table on Market Overview
- Executive Summary - Chart on Global Market Characteristics
- Executive Summary - Chart on Market By Geographical Landscape
- Executive Summary - Chart on Market Segmentation by Product
- Executive Summary - Chart on Market Segmentation by End-user
- Executive Summary - Chart on Incremental Growth
- Executive Summary - Data Table on Incremental Growth
- Executive Summary - Chart on Company Market Positioning
2 Market Landscape
- 2.1 Market ecosystem
- Parent Market
- Data Table on - Parent Market
- 2.2 Market characteristics
- Market characteristics analysis
- 2.3 Value chain analysis
- Value Chain Analysis
3 Market Sizing
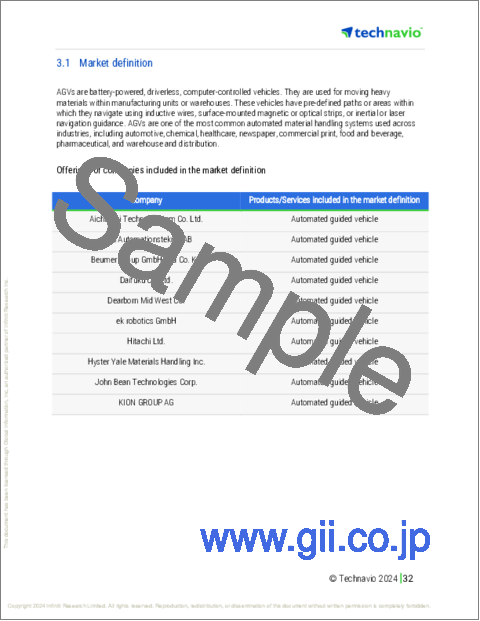
- 3.1 Market definition
- Offerings of companies included in the market definition
- 3.2 Market segment analysis
- Market segments
- 3.3 Market size 2023
- 3.4 Market outlook: Forecast for 2023-2028
- Chart on Global - Market size and forecast 2023-2028 ($ million)
- Data Table on Global - Market size and forecast 2023-2028 ($ million)
- Chart on Global Market: Year-over-year growth 2023-2028 (%)
- Data Table on Global Market: Year-over-year growth 2023-2028 (%)
4 Historic Market Size
- 4.1 Global Automated Guided Vehicle (AGV) Market 2018 - 2022
- Historic Market Size - Data Table on Global Automated Guided Vehicle (AGV) Market 2018 - 2022 ($ million)
- 4.2 Product segment analysis 2018 - 2022
- Historic Market Size - Product Segment 2018 - 2022 ($ million)
- 4.3 End-user segment analysis 2018 - 2022
- Historic Market Size - End-user Segment 2018 - 2022 ($ million)
- 4.4 Geography segment analysis 2018 - 2022
- Historic Market Size - Geography Segment 2018 - 2022 ($ million)
- 4.5 Country segment analysis 2018 - 2022
- Historic Market Size - Country Segment 2018 - 2022 ($ million)
5 Five Forces Analysis
- 5.1 Five forces summary
- Five forces analysis - Comparison between 2023 and 2028
- 5.2 Bargaining power of buyers
- Bargaining power of buyers - Impact of key factors 2023 and 2028
- 5.3 Bargaining power of suppliers
- Bargaining power of suppliers - Impact of key factors in 2023 and 2028
- 5.4 Threat of new entrants
- Threat of new entrants - Impact of key factors in 2023 and 2028
- 5.5 Threat of substitutes
- Threat of substitutes - Impact of key factors in 2023 and 2028
- 5.6 Threat of rivalry
- Threat of rivalry - Impact of key factors in 2023 and 2028
- 5.7 Market condition
- Chart on Market condition - Five forces 2023 and 2028
6 Market Segmentation by Product
- 6.1 Market segments
- Chart on Product - Market share 2023-2028 (%)
- Data Table on Product - Market share 2023-2028 (%)
- 6.2 Comparison by Product
- Chart on Comparison by Product
- Data Table on Comparison by Product
- 6.3 Unit load carrier - Market size and forecast 2023-2028
- Chart on Unit load carrier - Market size and forecast 2023-2028 ($ million)
- Data Table on Unit load carrier - Market size and forecast 2023-2028 ($ million)
- Chart on Unit load carrier - Year-over-year growth 2023-2028 (%)
- Data Table on Unit load carrier - Year-over-year growth 2023-2028 (%)
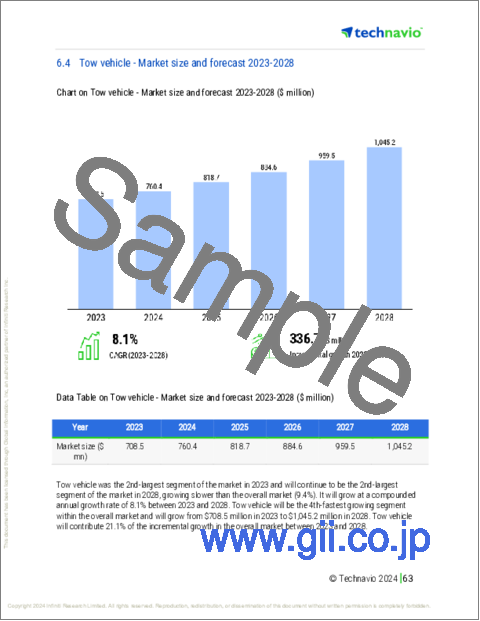
- 6.4 Tow vehicle - Market size and forecast 2023-2028
- Chart on Tow vehicle - Market size and forecast 2023-2028 ($ million)
- Data Table on Tow vehicle - Market size and forecast 2023-2028 ($ million)
- Chart on Tow vehicle - Year-over-year growth 2023-2028 (%)
- Data Table on Tow vehicle - Year-over-year growth 2023-2028 (%)
- 6.5 Pallet truck - Market size and forecast 2023-2028
- Chart on Pallet truck - Market size and forecast 2023-2028 ($ million)
- Data Table on Pallet truck - Market size and forecast 2023-2028 ($ million)
- Chart on Pallet truck - Year-over-year growth 2023-2028 (%)
- Data Table on Pallet truck - Year-over-year growth 2023-2028 (%)
- 6.6 Assembly line vehicle - Market size and forecast 2023-2028
- Chart on Assembly line vehicle - Market size and forecast 2023-2028 ($ million)
- Data Table on Assembly line vehicle - Market size and forecast 2023-2028 ($ million)
- Chart on Assembly line vehicle - Year-over-year growth 2023-2028 (%)
- Data Table on Assembly line vehicle - Year-over-year growth 2023-2028 (%)
- 6.7 Others - Market size and forecast 2023-2028
- Chart on Others - Market size and forecast 2023-2028 ($ million)
- Data Table on Others - Market size and forecast 2023-2028 ($ million)
- Chart on Others - Year-over-year growth 2023-2028 (%)
- Data Table on Others - Year-over-year growth 2023-2028 (%)
- 6.8 Market opportunity by Product
- Market opportunity by Product ($ million)
- Data Table on Market opportunity by Product ($ million)
7 Market Segmentation by End-user
- 7.1 Market segments
- Chart on End-user - Market share 2023-2028 (%)
- Data Table on End-user - Market share 2023-2028 (%)
- 7.2 Comparison by End-user
- Chart on Comparison by End-user
- Data Table on Comparison by End-user
- 7.3 Automotive - Market size and forecast 2023-2028
- Chart on Automotive - Market size and forecast 2023-2028 ($ million)
- Data Table on Automotive - Market size and forecast 2023-2028 ($ million)
- Chart on Automotive - Year-over-year growth 2023-2028 (%)
- Data Table on Automotive - Year-over-year growth 2023-2028 (%)
- 7.4 Food and beverages - Market size and forecast 2023-2028
- Chart on Food and beverages - Market size and forecast 2023-2028 ($ million)
- Data Table on Food and beverages - Market size and forecast 2023-2028 ($ million)
- Chart on Food and beverages - Year-over-year growth 2023-2028 (%)
- Data Table on Food and beverages - Year-over-year growth 2023-2028 (%)
- 7.5 Electronics and electrical - Market size and forecast 2023-2028
- Chart on Electronics and electrical - Market size and forecast 2023-2028 ($ million)
- Data Table on Electronics and electrical - Market size and forecast 2023-2028 ($ million)
- Chart on Electronics and electrical - Year-over-year growth 2023-2028 (%)
- Data Table on Electronics and electrical - Year-over-year growth 2023-2028 (%)
- 7.6 Pharmaceuticals - Market size and forecast 2023-2028
- Chart on Pharmaceuticals - Market size and forecast 2023-2028 ($ million)
- Data Table on Pharmaceuticals - Market size and forecast 2023-2028 ($ million)
- Chart on Pharmaceuticals - Year-over-year growth 2023-2028 (%)
- Data Table on Pharmaceuticals - Year-over-year growth 2023-2028 (%)
- 7.7 Others - Market size and forecast 2023-2028
- Chart on Others - Market size and forecast 2023-2028 ($ million)
- Data Table on Others - Market size and forecast 2023-2028 ($ million)
- Chart on Others - Year-over-year growth 2023-2028 (%)
- Data Table on Others - Year-over-year growth 2023-2028 (%)
- 7.8 Market opportunity by End-user
- Market opportunity by End-user ($ million)
- Data Table on Market opportunity by End-user ($ million)
8 Customer Landscape
- 8.1 Customer landscape overview
- Analysis of price sensitivity, lifecycle, customer purchase basket, adoption rates, and purchase criteria
9 Geographic Landscape
- 9.1 Geographic segmentation
- Chart on Market share By Geographical Landscape 2023-2028 (%)
- Data Table on Market share By Geographical Landscape 2023-2028 (%)
- 9.2 Geographic comparison
- Chart on Geographic comparison
- Data Table on Geographic comparison
- 9.3 Europe - Market size and forecast 2023-2028
- Chart on Europe - Market size and forecast 2023-2028 ($ million)
- Data Table on Europe - Market size and forecast 2023-2028 ($ million)
- Chart on Europe - Year-over-year growth 2023-2028 (%)
- Data Table on Europe - Year-over-year growth 2023-2028 (%)
- 9.4 APAC - Market size and forecast 2023-2028
- Chart on APAC - Market size and forecast 2023-2028 ($ million)
- Data Table on APAC - Market size and forecast 2023-2028 ($ million)
- Chart on APAC - Year-over-year growth 2023-2028 (%)
- Data Table on APAC - Year-over-year growth 2023-2028 (%)
- 9.5 North America - Market size and forecast 2023-2028
- Chart on North America - Market size and forecast 2023-2028 ($ million)
- Data Table on North America - Market size and forecast 2023-2028 ($ million)
- Chart on North America - Year-over-year growth 2023-2028 (%)
- Data Table on North America - Year-over-year growth 2023-2028 (%)
- 9.6 South America - Market size and forecast 2023-2028
- Chart on South America - Market size and forecast 2023-2028 ($ million)
- Data Table on South America - Market size and forecast 2023-2028 ($ million)
- Chart on South America - Year-over-year growth 2023-2028 (%)
- Data Table on South America - Year-over-year growth 2023-2028 (%)
- 9.7 Middle East and Africa - Market size and forecast 2023-2028
- Chart on Middle East and Africa - Market size and forecast 2023-2028 ($ million)
- Data Table on Middle East and Africa - Market size and forecast 2023-2028 ($ million)
- Chart on Middle East and Africa - Year-over-year growth 2023-2028 (%)
- Data Table on Middle East and Africa - Year-over-year growth 2023-2028 (%)
- 9.8 US - Market size and forecast 2023-2028
- Chart on US - Market size and forecast 2023-2028 ($ million)
- Data Table on US - Market size and forecast 2023-2028 ($ million)
- Chart on US - Year-over-year growth 2023-2028 (%)
- Data Table on US - Year-over-year growth 2023-2028 (%)
- 9.9 Germany - Market size and forecast 2023-2028
- Chart on Germany - Market size and forecast 2023-2028 ($ million)
- Data Table on Germany - Market size and forecast 2023-2028 ($ million)
- Chart on Germany - Year-over-year growth 2023-2028 (%)
- Data Table on Germany - Year-over-year growth 2023-2028 (%)
- 9.10 Japan - Market size and forecast 2023-2028
- Chart on Japan - Market size and forecast 2023-2028 ($ million)
- Data Table on Japan - Market size and forecast 2023-2028 ($ million)
- Chart on Japan - Year-over-year growth 2023-2028 (%)
- Data Table on Japan - Year-over-year growth 2023-2028 (%)
- 9.11 China - Market size and forecast 2023-2028
- Chart on China - Market size and forecast 2023-2028 ($ million)
- Data Table on China - Market size and forecast 2023-2028 ($ million)
- Chart on China - Year-over-year growth 2023-2028 (%)
- Data Table on China - Year-over-year growth 2023-2028 (%)
- 9.12 UK - Market size and forecast 2023-2028
- Chart on UK - Market size and forecast 2023-2028 ($ million)
- Data Table on UK - Market size and forecast 2023-2028 ($ million)
- Chart on UK - Year-over-year growth 2023-2028 (%)
- Data Table on UK - Year-over-year growth 2023-2028 (%)
- 9.13 Market opportunity By Geographical Landscape
- Market opportunity By Geographical Landscape ($ million)
- Data Tables on Market opportunity By Geographical Landscape ($ million)
10 Drivers, Challenges, and Opportunity/Restraints
- 10.1 Market drivers
- 10.2 Market challenges
- 10.3 Impact of drivers and challenges
- Impact of drivers and challenges in 2023 and 2028
- 10.4 Market opportunities/restraints
11 Competitive Landscape
- 11.1 Overview
- 11.2 Competitive Landscape
- Overview on criticality of inputs and factors of differentiation
- 11.3 Landscape disruption
- Overview on factors of disruption
- 11.4 Industry risks
- Impact of key risks on business
12 Competitive Analysis
- 12.1 Companies profiled
- Companies covered
- 12.2 Market positioning of companies
- Matrix on companies position and classification
- 12.3 Aichikikai Techno System Co. Ltd.
- Aichikikai Techno System Co. Ltd. - Overview
- Aichikikai Techno System Co. Ltd. - Product / Service
- Aichikikai Techno System Co. Ltd. - Key offerings
- 12.4 Atab Automationsteknik AB
- Atab Automationsteknik AB - Overview
- Atab Automationsteknik AB - Product / Service
- Atab Automationsteknik AB - Key offerings
- 12.5 Beumer Group GmbH and Co. KG
- Beumer Group GmbH and Co. KG - Overview
- Beumer Group GmbH and Co. KG - Product / Service
- Beumer Group GmbH and Co. KG - Key offerings
- 12.6 Daifuku Co. Ltd.
- Daifuku Co. Ltd. - Overview
- Daifuku Co. Ltd. - Product / Service
- Daifuku Co. Ltd. - Key news
- Daifuku Co. Ltd. - Key offerings
- 12.7 Dearborn Mid West Co.
- Dearborn Mid West Co. - Overview
- Dearborn Mid West Co. - Product / Service
- Dearborn Mid West Co. - Key offerings
- 12.8 ek robotics GmbH
- ek robotics GmbH - Overview
- ek robotics GmbH - Product / Service
- ek robotics GmbH - Key offerings
- 12.9 Hitachi Ltd.
- Hitachi Ltd. - Overview
- Hitachi Ltd. - Business segments
- Hitachi Ltd. - Key news
- Hitachi Ltd. - Key offerings
- Hitachi Ltd. - Segment focus
- 12.10 Hyster Yale Materials Handling Inc.
- Hyster Yale Materials Handling Inc. - Overview
- Hyster Yale Materials Handling Inc. - Business segments
- Hyster Yale Materials Handling Inc. - Key news
- Hyster Yale Materials Handling Inc. - Key offerings
- Hyster Yale Materials Handling Inc. - Segment focus
- 12.11 John Bean Technologies Corp.
- John Bean Technologies Corp. - Overview
- John Bean Technologies Corp. - Business segments
- John Bean Technologies Corp. - Key news
- John Bean Technologies Corp. - Key offerings
- John Bean Technologies Corp. - Segment focus
- 12.12 KION GROUP AG
- KION GROUP AG - Overview
- KION GROUP AG - Business segments
- KION GROUP AG - Key news
- KION GROUP AG - Key offerings
- KION GROUP AG - Segment focus
- 12.13 MIDEA Group Co. Ltd.
- MIDEA Group Co. Ltd. - Overview
- MIDEA Group Co. Ltd. - Product / Service
- MIDEA Group Co. Ltd. - Key news
- MIDEA Group Co. Ltd. - Key offerings
- 12.14 Murata Machinery Ltd.
- Murata Machinery Ltd. - Overview
- Murata Machinery Ltd. - Business segments
- Murata Machinery Ltd. - Key news
- Murata Machinery Ltd. - Key offerings
- Murata Machinery Ltd. - Segment focus
- 12.15 Seegrid Corp.
- Seegrid Corp. - Overview
- Seegrid Corp. - Product / Service
- Seegrid Corp. - Key offerings
- 12.16 SSI Schafer IT Solutions GmbH
- SSI Schafer IT Solutions GmbH - Overview
- SSI Schafer IT Solutions GmbH - Product / Service
- SSI Schafer IT Solutions GmbH - Key offerings
- 12.17 Toyota Industries Corp.
- Toyota Industries Corp. - Overview
- Toyota Industries Corp. - Business segments
- Toyota Industries Corp. - Key news
- Toyota Industries Corp. - Key offerings
- Toyota Industries Corp. - Segment focus
13 Appendix
- 13.1 Scope of the report
- 13.2 Inclusions and exclusions checklist
- Inclusions checklist
- Exclusions checklist
- 13.3 Currency conversion rates for US$
- Currency conversion rates for US$
- 13.4 Research methodology
- Research methodology
- 13.5 Data procurement
- Information sources
- 13.6 Data validation
- Data validation
- 13.7 Validation techniques employed for market sizing
- Validation techniques employed for market sizing
- 13.8 Data synthesis
- Data synthesis
- 13.9 360 degree market analysis
- 360 degree market analysis
- 13.10 List of abbreviations
- List of abbreviations

