|
|
市場調査レポート
商品コード
1459518
人工膝関節置換術の世界市場 2024-2028Global Knee Replacement Market 2024-2028 |
||||||
|
|||||||
カスタマイズ可能
|
|||||||

| 人工膝関節置換術の世界市場 2024-2028 |
|
出版日: 2024年03月25日
発行: TechNavio
ページ情報: 英文 164 Pages
納期: 即納可能
|

全表示
- 概要
- 図表
- 目次
人工膝関節置換術市場は2023-2028年に41億3,000万米ドル、予測期間中のCAGRは6.91%で成長すると予測されます。
当レポートでは、人工膝関節置換術市場の全体的な分析、市場規模・予測、動向、成長促進要因、課題、約25のベンダーを網羅したベンダー分析などを掲載しています。
現在の市場シナリオ、最新動向と促進要因、市場環境全体に関する最新分析を提供しています。市場を牽引しているのは、整形外科手術へのアクセス向上を可能にするヘルスケアに対する政府支援の増加、人工膝関節置換術手術件数の増加、整形外科疾患および関連リスク要因の有病率の増加です。
| 市場範囲 | |
|---|---|
| 基準年 | 2024 |
| 終了年 | 2028 |
| 予測期間 | 2024-2028 |
| 成長モメンタム | 加速 |
| 前年比2024年 | 5.62% |
| CAGR | 6.91% |
| 増分額 | 41億3,000万米ドル |
本調査では、世界の人工膝関節置換術市場の発展が、今後数年間の人工膝関節置換術市場成長を牽引する主要因の1つであるとしています。また、ロボット支援膝インプラント手術への注目の高まりや、3Dプリント膝インプラントの需要増加が、市場の大きな需要につながります。
目次
第1章 エグゼクティブサマリー
- 市場概要
第2章 市場情勢
- 市場エコシステム
第3章 市場規模の評価
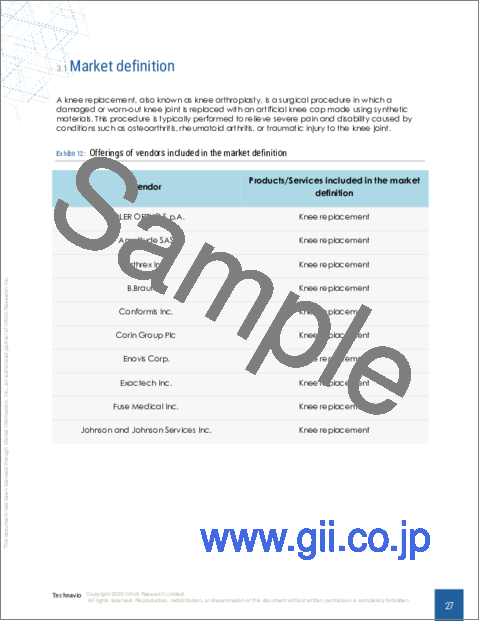
- 市場の定義
- 市場セグメント分析
- 市場規模 2023
- 市場の見通し 2023-2028
第4章 市場規模実績
- 人工膝関節置換術の世界市場 2018-2022
- 製品セグメント分析 2018-2022
- エンドユーザーセグメント分析 2018-2022
- 地域別セグメント分析 2018-2022
- 国別セグメント分析 2018-2022
第5章 ファイブフォース分析
- ファイブフォースの要約
- 買い手の交渉力
- 供給企業の交渉力
- 新規参入業者の脅威
- 代替品の脅威
- 競争の脅威
- 市況
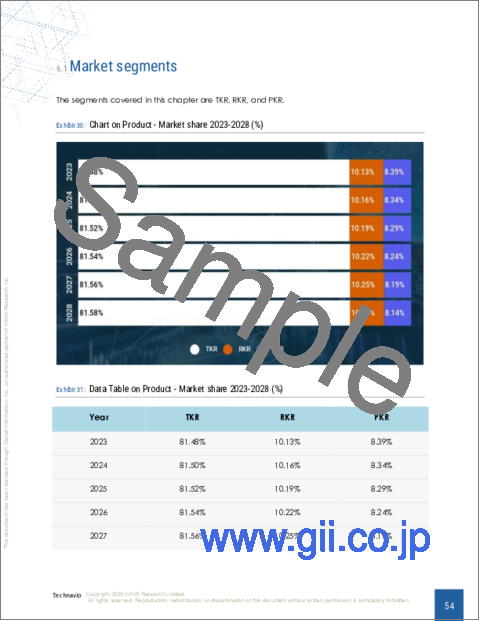
第6章 市場セグメンテーション:製品別
- 市場セグメント
- 比較:製品別
- TKR:市場規模と予測 2023-2028
- RKR:市場規模と予測 2023-2028
- PKR :市場規模と予測 2023-2028
- 市場機会:製品別
第7章 市場セグメンテーション:エンドユーザー別
- 市場セグメント
- 比較:エンドユーザー別
- 病院と専門クリニック:市場規模と予測 2023-2028
- 外来外科クリニック:市場規模と予測 2023-2028
- 市場機会:エンドユーザー別
第8章 顧客情勢
- 顧客情勢の概要
第9章 地域別情勢
- 地域別セグメンテーション
- 地域別比較
- 北米:市場規模と予測 2023-2028
- 欧州:市場規模と予測 2023-2028
- アジア:市場規模と予測 2023-2028
- 世界のその他の地域:市場規模と予測 2023-2028
- 米国:市場規模と予測 2023-2028
- カナダ:市場規模と予測 2023-2028
- 中国:市場規模と予測 2023-2028
- ドイツ:市場規模と予測 2023-2028
- フランス:市場規模と予測 2023-2028
- 市場機会:地域情勢別
第10章 促進要因、課題、および動向
- 市場促進要因
- 市場の課題
- 促進要因と課題の影響
- 市場動向
第11章 ベンダー情勢
- 概要
- ベンダー情勢
- 混乱の状況
- 業界のリスク
第12章 ベンダー分析
- 対象ベンダー
- ベンダーの市場ポジショニング
- ADLER ORTHO S.p.A.
- Amplitude SAS
- Arthrex Inc.
- B.Braun SE
- Conformis Inc.
- Corin Group Plc
- Enovis Corp.
- Exactech Inc.
- Fuse Medical Inc.
- Johnson and Johnson Services Inc.
- Medacta Group SA
- MicroPort Scientific Corp.
- Smith and Nephew plc
- Stryker Corp.
- Zimmer Biomet Holdings Inc.
第13章 付録
Exhibits:
- Exhibits1: Executive Summary - Chart on Market Overview
- Exhibits2: Executive Summary - Data Table on Market Overview
- Exhibits3: Executive Summary - Chart on Global Market Characteristics
- Exhibits4: Executive Summary - Chart on Market By Geographical Landscape
- Exhibits5: Executive Summary - Chart on Market Segmentation by Product
- Exhibits6: Executive Summary - Chart on Market Segmentation by End-user
- Exhibits7: Executive Summary - Chart on Incremental Growth
- Exhibits8: Executive Summary - Data Table on Incremental Growth
- Exhibits9: Executive Summary - Chart on Vendor Market Positioning
- Exhibits10: Parent market
- Exhibits11: Market Characteristics
- Exhibits12: Offerings of vendors included in the market definition
- Exhibits13: Market segments
- Exhibits14: Chart on Global - Market size and forecast 2023-2028 ($ billion)
- Exhibits15: Data Table on Global - Market size and forecast 2023-2028 ($ billion)
- Exhibits16: Chart on Global Market: Year-over-year growth 2023-2028 (%)
- Exhibits17: Data Table on Global Market: Year-over-year growth 2023-2028 (%)
- Exhibits18: Historic Market Size - Data Table on global knee replacement market 2018 - 2022 ($ billion)
- Exhibits19: Historic Market Size - Product Segment 2018 - 2022 ($ billion)
- Exhibits20: Historic Market Size - End-user Segment 2018 - 2022 ($ billion)
- Exhibits21: Historic Market Size - Geography Segment 2018 - 2022 ($ billion)
- Exhibits22: Historic Market Size - Country Segment 2018 - 2022 ($ billion)
- Exhibits23: Five forces analysis - Comparison between 2023 and 2028
- Exhibits24: Chart on Bargaining power of buyers - Impact of key factors 2023 and 2028
- Exhibits25: Bargaining power of suppliers - Impact of key factors in 2023 and 2028
- Exhibits26: Threat of new entrants - Impact of key factors in 2023 and 2028
- Exhibits27: Threat of substitutes - Impact of key factors in 2023 and 2028
- Exhibits28: Threat of rivalry - Impact of key factors in 2023 and 2028
- Exhibits29: Chart on Market condition - Five forces 2023 and 2028
- Exhibits30: Chart on Product - Market share 2023-2028 (%)
- Exhibits31: Data Table on Product - Market share 2023-2028 (%)
- Exhibits32: Chart on Comparison by Product
- Exhibits33: Data Table on Comparison by Product
- Exhibits34: Chart on TKR - Market size and forecast 2023-2028 ($ billion)
- Exhibits35: Data Table on TKR - Market size and forecast 2023-2028 ($ billion)
- Exhibits36: Chart on TKR - Year-over-year growth 2023-2028 (%)
- Exhibits37: Data Table on TKR - Year-over-year growth 2023-2028 (%)
- Exhibits38: Chart on RKR - Market size and forecast 2023-2028 ($ billion)
- Exhibits39: Data Table on RKR - Market size and forecast 2023-2028 ($ billion)
- Exhibits40: Chart on RKR - Year-over-year growth 2023-2028 (%)
- Exhibits41: Data Table on RKR - Year-over-year growth 2023-2028 (%)
- Exhibits42: Chart on PKR - Market size and forecast 2023-2028 ($ billion)
- Exhibits43: Data Table on PKR - Market size and forecast 2023-2028 ($ billion)
- Exhibits44: Chart on PKR - Year-over-year growth 2023-2028 (%)
- Exhibits45: Data Table on PKR - Year-over-year growth 2023-2028 (%)
- Exhibits46: Market opportunity by Product ($ billion)
- Exhibits47: Data Table on Market opportunity by Product ($ billion)
- Exhibits48: Chart on End-user - Market share 2023-2028 (%)
- Exhibits49: Data Table on End-user - Market share 2023-2028 (%)
- Exhibits50: Chart on Comparison by End-user
- Exhibits51: Data Table on Comparison by End-user
- Exhibits52: Chart on Hospitals and specialty clinics - Market size and forecast 2023-2028 ($ billion)
- Exhibits53: Data Table on Hospitals and specialty clinics - Market size and forecast 2023-2028 ($ billion)
- Exhibits54: Chart on Hospitals and specialty clinics - Year-over-year growth 2023-2028 (%)
- Exhibits55: Data Table on Hospitals and specialty clinics - Year-over-year growth 2023-2028 (%)
- Exhibits56: Chart on Ambulatory surgical clinics - Market size and forecast 2023-2028 ($ billion)
- Exhibits57: Data Table on Ambulatory surgical clinics - Market size and forecast 2023-2028 ($ billion)
- Exhibits58: Chart on Ambulatory surgical clinics - Year-over-year growth 2023-2028 (%)
- Exhibits59: Data Table on Ambulatory surgical clinics - Year-over-year growth 2023-2028 (%)
- Exhibits60: Market opportunity by End-user ($ billion)
- Exhibits61: Data Table on Market opportunity by End-user ($ billion)
- Exhibits62: Analysis of price sensitivity, lifecycle, customer purchase basket, adoption rates, and purchase criteria
- Exhibits63: Chart on Market share By Geographical Landscape 2023-2028 (%)
- Exhibits64: Data Table on Market share By Geographical Landscape 2023-2028 (%)
- Exhibits65: Chart on Geographic comparison
- Exhibits66: Data Table on Geographic comparison
- Exhibits67: Chart on North America - Market size and forecast 2023-2028 ($ billion)
- Exhibits68: Data Table on North America - Market size and forecast 2023-2028 ($ billion)
- Exhibits69: Chart on North America - Year-over-year growth 2023-2028 (%)
- Exhibits70: Data Table on North America - Year-over-year growth 2023-2028 (%)
- Exhibits71: Chart on Europe - Market size and forecast 2023-2028 ($ billion)
- Exhibits72: Data Table on Europe - Market size and forecast 2023-2028 ($ billion)
- Exhibits73: Chart on Europe - Year-over-year growth 2023-2028 (%)
- Exhibits74: Data Table on Europe - Year-over-year growth 2023-2028 (%)
- Exhibits75: Chart on Asia - Market size and forecast 2023-2028 ($ billion)
- Exhibits76: Data Table on Asia - Market size and forecast 2023-2028 ($ billion)
- Exhibits77: Chart on Asia - Year-over-year growth 2023-2028 (%)
- Exhibits78: Data Table on Asia - Year-over-year growth 2023-2028 (%)
- Exhibits79: Chart on Rest of World (ROW) - Market size and forecast 2023-2028 ($ billion)
- Exhibits80: Data Table on Rest of World (ROW) - Market size and forecast 2023-2028 ($ billion)
- Exhibits81: Chart on Rest of World (ROW) - Year-over-year growth 2023-2028 (%)
- Exhibits82: Data Table on Rest of World (ROW) - Year-over-year growth 2023-2028 (%)
- Exhibits83: Chart on US - Market size and forecast 2023-2028 ($ billion)
- Exhibits84: Data Table on US - Market size and forecast 2023-2028 ($ billion)
- Exhibits85: Chart on US - Year-over-year growth 2023-2028 (%)
- Exhibits86: Data Table on US - Year-over-year growth 2023-2028 (%)
- Exhibits87: Chart on Canada - Market size and forecast 2023-2028 ($ billion)
- Exhibits88: Data Table on Canada - Market size and forecast 2023-2028 ($ billion)
- Exhibits89: Chart on Canada - Year-over-year growth 2023-2028 (%)
- Exhibits90: Data Table on Canada - Year-over-year growth 2023-2028 (%)
- Exhibits91: Chart on China - Market size and forecast 2023-2028 ($ billion)
- Exhibits92: Data Table on China - Market size and forecast 2023-2028 ($ billion)
- Exhibits93: Chart on China - Year-over-year growth 2023-2028 (%)
- Exhibits94: Data Table on China - Year-over-year growth 2023-2028 (%)
- Exhibits95: Chart on Germany - Market size and forecast 2023-2028 ($ billion)
- Exhibits96: Data Table on Germany - Market size and forecast 2023-2028 ($ billion)
- Exhibits97: Chart on Germany - Year-over-year growth 2023-2028 (%)
- Exhibits98: Data Table on Germany - Year-over-year growth 2023-2028 (%)
- Exhibits99: Chart on France - Market size and forecast 2023-2028 ($ billion)
- Exhibits100: Data Table on France - Market size and forecast 2023-2028 ($ billion)
- Exhibits101: Chart on France - Year-over-year growth 2023-2028 (%)
- Exhibits102: Data Table on France - Year-over-year growth 2023-2028 (%)
- Exhibits103: Market opportunity By Geographical Landscape ($ billion)
- Exhibits104: Data Tables on Market opportunity By Geographical Landscape ($ billion)
- Exhibits105: Impact of drivers and challenges in 2023 and 2028
- Exhibits106: Overview on Criticality of inputs and Factors of differentiation
- Exhibits107: Overview on factors of disruption
- Exhibits108: Impact of key risks on business
- Exhibits109: Vendors covered
- Exhibits110: Matrix on vendor position and classification
- Exhibits111: ADLER ORTHO S.p.A. - Overview
- Exhibits112: ADLER ORTHO S.p.A. - Product / Service
- Exhibits113: ADLER ORTHO S.p.A. - Key offerings
- Exhibits114: Amplitude SAS - Overview
- Exhibits115: Amplitude SAS - Product / Service
- Exhibits116: Amplitude SAS - Key offerings
- Exhibits117: Arthrex Inc. - Overview
- Exhibits118: Arthrex Inc. - Product / Service
- Exhibits119: Arthrex Inc. - Key offerings
- Exhibits120: B.Braun SE - Overview
- Exhibits121: B.Braun SE - Business segments
- Exhibits122: B.Braun SE - Key offerings
- Exhibits123: B.Braun SE - Segment focus
- Exhibits124: Conformis Inc. - Overview
- Exhibits125: Conformis Inc. - Product / Service
- Exhibits126: Conformis Inc. - Key news
- Exhibits127: Conformis Inc. - Key offerings
- Exhibits128: Corin Group Plc - Overview
- Exhibits129: Corin Group Plc - Product / Service
- Exhibits130: Corin Group Plc - Key offerings
- Exhibits131: Enovis Corp. - Overview
- Exhibits132: Enovis Corp. - Business segments
- Exhibits133: Enovis Corp. - Key offerings
- Exhibits134: Enovis Corp. - Segment focus
- Exhibits135: Exactech Inc. - Overview
- Exhibits136: Exactech Inc. - Product / Service
- Exhibits137: Exactech Inc. - Key offerings
- Exhibits138: Fuse Medical Inc. - Overview
- Exhibits139: Fuse Medical Inc. - Product / Service
- Exhibits140: Fuse Medical Inc. - Key offerings
- Exhibits141: Johnson and Johnson Services Inc. - Overview
- Exhibits142: Johnson and Johnson Services Inc. - Business segments
- Exhibits143: Johnson and Johnson Services Inc. - Key news
- Exhibits144: Johnson and Johnson Services Inc. - Key offerings
- Exhibits145: Johnson and Johnson Services Inc. - Segment focus
- Exhibits146: Medacta Group SA - Overview
- Exhibits147: Medacta Group SA - Product / Service
- Exhibits148: Medacta Group SA - Key offerings
- Exhibits149: MicroPort Scientific Corp. - Overview
- Exhibits150: MicroPort Scientific Corp. - Business segments
- Exhibits151: MicroPort Scientific Corp. - Key offerings
- Exhibits152: MicroPort Scientific Corp. - Segment focus
- Exhibits153: Smith and Nephew plc - Overview
- Exhibits154: Smith and Nephew plc - Business segments
- Exhibits155: Smith and Nephew plc - Key news
- Exhibits156: Smith and Nephew plc - Key offerings
- Exhibits157: Smith and Nephew plc - Segment focus
- Exhibits158: Stryker Corp. - Overview
- Exhibits159: Stryker Corp. - Business segments
- Exhibits160: Stryker Corp. - Key news
- Exhibits161: Stryker Corp. - Key offerings
- Exhibits162: Stryker Corp. - Segment focus
- Exhibits163: Zimmer Biomet Holdings Inc. - Overview
- Exhibits164: Zimmer Biomet Holdings Inc. - Business segments
- Exhibits165: Zimmer Biomet Holdings Inc. - Key news
- Exhibits166: Zimmer Biomet Holdings Inc. - Key offerings
- Exhibits167: Zimmer Biomet Holdings Inc. - Segment focus
- Exhibits168: Inclusions checklist
- Exhibits169: Exclusions checklist
- Exhibits170: Currency conversion rates for US$
- Exhibits171: Research methodology
- Exhibits172: Validation techniques employed for market sizing
- Exhibits173: Information sources
- Exhibits174: List of abbreviations
The knee replacement market is forecasted to grow by USD 4.13 bn during 2023-2028, accelerating at a CAGR of 6.91% during the forecast period. The report on the knee replacement market provides a holistic analysis, market size and forecast, trends, growth drivers, and challenges, as well as vendor analysis covering around 25 vendors.
The report offers an up-to-date analysis regarding the current market scenario, the latest trends and drivers, and the overall market environment. The market is driven by increasing government support for healthcare enabling better access to orthopedic procedures, a rising number of knee replacement surgeries, and increasing prevalence of orthopedic diseases and associated risk factors.
Technavio's knee replacement market is segmented as below:
| Market Scope | |
|---|---|
| Base Year | 2024 |
| End Year | 2028 |
| Series Year | 2024-2028 |
| Growth Momentum | Accelerate |
| YOY 2024 | 5.62% |
| CAGR | 6.91% |
| Incremental Value | $4.13bn |
By Product
- TKR
- RKR
- PKR
By End-user
- Hospitals and specialty clinics
- Ambulatory surgical clinics
By Geographical Landscape
- North America
- Europe
- Asia
- Rest of World (ROW)
This study identifies the growing developments in the global knee replacement market as one of the prime reasons driving the knee replacement market growth during the next few years. Also, increasing focus on robotics-assisted knee implantation surgeries and increasing demand for 3D-printed knee implants will lead to sizable demand in the market.
The report on the knee replacement market covers the following areas:
- Knee replacement market sizing
- Knee replacement market forecast
- Knee replacement market industry analysis
The robust vendor analysis is designed to help clients improve their market position, and in line with this, this report provides a detailed analysis of several leading knee replacement market vendors that include ADLER ORTHO S.p.A., Amplitude SAS, Arthrex Inc., B.Braun SE, Conformis Inc., Corin Group Plc, Enovis Corp., Exactech Inc., Fuse Medical Inc., implantcast GmbH, Johnson and Johnson Services Inc., Just Medical Devices Tianjin Co. Ltd, Limacorporate SpA, Medacta Group SA, Merete Technologies Inc., MicroPort Scientific Corp., Smith and Nephew plc, Stryker Corp., Waldemar Link GmbH and Co. KG, and Zimmer Biomet Holdings Inc. Also, the knee replacement market analysis report includes information on upcoming trends and challenges that will influence market growth. This is to help companies strategize and leverage all forthcoming growth opportunities.
The study was conducted using an objective combination of primary and secondary information including inputs from key participants in the industry. The report contains a comprehensive market and vendor landscape in addition to an analysis of the key vendors.
The publisher presents a detailed picture of the market by way of study, synthesis, and summation of data from multiple sources through an analysis of key parameters such as profit, pricing, competition, and promotions. It presents various market facets by identifying the key industry influencers. The data presented is comprehensive, reliable, and a result of extensive research - both primary and secondary. The market research reports provide a complete competitive landscape and an in-depth vendor selection methodology and analysis using qualitative and quantitative research to forecast accurate market growth.
Table of Contents
1 Executive Summary
- 1.1 Market overview
2 Market Landscape
- 2.1 Market ecosystem
3 Market Sizing
- 3.1 Market definition
- 3.2 Market segment analysis
- 3.3 Market size 2023
- 3.4 Market outlook: Forecast for 2023-2028
4 Historic Market Size
- 4.1 Global knee replacement market 2018 - 2022
- 4.2 Product Segment Analysis 2018 - 2022
- 4.3 End-user Segment Analysis 2018 - 2022
- 4.4 Geography Segment Analysis 2018 - 2022
- 4.5 Country Segment Analysis 2018 - 2022
5 Five Forces Analysis
- 5.1 Five forces summary
- 5.2 Bargaining power of buyers
- 5.3 Bargaining power of suppliers
- 5.4 Threat of new entrants
- 5.5 Threat of substitutes
- 5.6 Threat of rivalry
- 5.7 Market condition
6 Market Segmentation by Product
- 6.1 Market segments
- 6.2 Comparison by Product
- 6.3 TKR - Market size and forecast 2023-2028
- 6.4 RKR - Market size and forecast 2023-2028
- 6.5 PKR - Market size and forecast 2023-2028
- 6.6 Market opportunity by Product
7 Market Segmentation by End-user
- 7.1 Market segments
- 7.2 Comparison by End-user
- 7.3 Hospitals and specialty clinics - Market size and forecast 2023-2028
- 7.4 Ambulatory surgical clinics - Market size and forecast 2023-2028
- 7.5 Market opportunity by End-user
8 Customer Landscape
- 8.1 Customer landscape overview
9 Geographic Landscape
- 9.1 Geographic segmentation
- 9.2 Geographic comparison
- 9.3 North America - Market size and forecast 2023-2028
- 9.4 Europe - Market size and forecast 2023-2028
- 9.5 Asia - Market size and forecast 2023-2028
- 9.6 Rest of World (ROW) - Market size and forecast 2023-2028
- 9.7 US - Market size and forecast 2023-2028
- 9.8 Canada - Market size and forecast 2023-2028
- 9.9 China - Market size and forecast 2023-2028
- 9.10 Germany - Market size and forecast 2023-2028
- 9.11 France - Market size and forecast 2023-2028
- 9.12 Market opportunity By Geographical Landscape
10 Drivers, Challenges, and Trends
- 10.1 Market drivers
- 10.2 Market challenges
- 10.3 Impact of drivers and challenges
- 10.4 Market trends
11 Vendor Landscape
- 11.1 Overview
- 11.2 Vendor landscape
- 11.3 Landscape disruption
- 11.4 Industry risks
12 Vendor Analysis
- 12.1 Vendors covered
- 12.2 Market positioning of vendors
- 12.3 ADLER ORTHO S.p.A.
- 12.4 Amplitude SAS
- 12.5 Arthrex Inc.
- 12.6 B.Braun SE
- 12.7 Conformis Inc.
- 12.8 Corin Group Plc
- 12.9 Enovis Corp.
- 12.10 Exactech Inc.
- 12.11 Fuse Medical Inc.
- 12.12 Johnson and Johnson Services Inc.
- 12.13 Medacta Group SA
- 12.14 MicroPort Scientific Corp.
- 12.15 Smith and Nephew plc
- 12.16 Stryker Corp.
- 12.17 Zimmer Biomet Holdings Inc.
13 Appendix
- 13.1 Scope of the report
- 13.2 Inclusions and exclusions checklist
- 13.3 Currency conversion rates for US$
- 13.4 Research methodology
- 13.5 List of abbreviations

