|
|
市場調査レポート
商品コード
1558623
IoTローミングの世界市場:2024-2029年Global IoT Roaming Market: 2024-2029 |
||||||
|
|||||||
| IoTローミングの世界市場:2024-2029年 |
|
出版日: 2024年09月24日
発行: Juniper Research Ltd
ページ情報: 英文
納期: 即日から翌営業日
|
全表示
- 概要
- 目次
| 主要統計 | |
|---|---|
| 通信事業者のIoTローミング収益 (2024年): | 11億米ドル |
| 通信事業者のIoTローミング収益 (2029年): | 23億米ドル |
| 5G IoTローミング接続数 (2029年): | 39m |
| 予測期間: | 2024-2029年 |
通信事業者によるIoTローミング収益は2029年までに20億米ドルを突破する見通し
当調査スイートは、急成長するセルラーIoT市場におけるIoTローミングの役割に関する分析と実用的な洞察を提供し、移動体通信事業者、IoTデバイス製造業者、IoT MVNOなどのステークホルダーがIoTローミング接続の需要拡大に対応できるようにします。
本調査には、5GおよびLPWA/LPWAN ローミング接続に対する需要の高まりや、IoTローミングにおけるeSIM技術の役割の高まりなど、IoTローミング市場の主要動向に関する詳細な評価も含まれています。
調査対象の5Gの拡張コネクティビティには、以下のものが含まれます。
|
|
本レポートはまた、通信事業者とIoT接続プロバイダーが、GSMAのBCE (Billing and Charging Evolution) を通じてIoTローミング接続の収益化を改善し、ローミングステアリングソリューションとローミング分析の利用を改善する方法について、戦略的な提言を行っています。
この調査は、通信事業者とIoT接続プロバイダーがどのようにIoTローミングサービスと企業向けIoTソリューションを改善できるかについて提言を行うもので、シームレスな接続を提供するための衛星IoT接続の統合に関する戦略的提言も含まれています。さらに、SGP.32の分析を含む、恒久ローミングなどのローミング制限の解決策としてのeSIM技術サービスの開発、企業向けのAI統合とローミング分析の改善、また、IoT SAFEを含むIoTセキュリティソリューションの開発に関するさらなる戦略的提言や、2Gおよび3Gネットワーク廃止の影響管理における企業によるサポートに関する分析も含まれています。
主な特徴
- 市場の動向:衛星IoT接続の世界の接続サービスへの統合、トラフィックステアリングに影響を与える企業向けツールの開発、eSIM技術や企業向けローカリゼーションサービス、IoT SAFEやIoT向け耐量子暗号などのIoTセキュリティソリューションの開発など、IoTローミング市場の主な動向と機会に関する洞察を提供しています。また、IoTローミングサービスを改善するために、通信事業者やIoT接続ベンダーが投資すべき分野の分析と提言も含まれています。これには、5G強化接続ローミング、ネットワーク間スライスローミングのステアリング、BCEへの移行、IoTローミング用ネットワークアクセスなどの新しい課金モデルの開発などが含まれます。
- 主な要点と戦略的提言:IoTローミング市場における主な発展機会と知見を詳細に分析し、通信事業者とIoT接続プロバイダーに対する戦略的提言を示します。
- ベンチマーク業界予測:ローミングIoT接続の総数、ローミングIoT接続によるオペレーターの総収益、ローミングIoT接続によって生成されるセルラーデータの総数に関するデータ、2Gと3G、4G、5G、LPWAといったネットワーク技術別の分類が提供されます。
- Juniper Researchの競合リーダーボード:IoTローミング付加価値サービスベンダー12社と世界のIoT接続プロバイダー20社の能力、容量、各分野のベンダーの市場規模と提供サービスの詳細分析を提供します。
サンプル
市場データ・予測レポート:
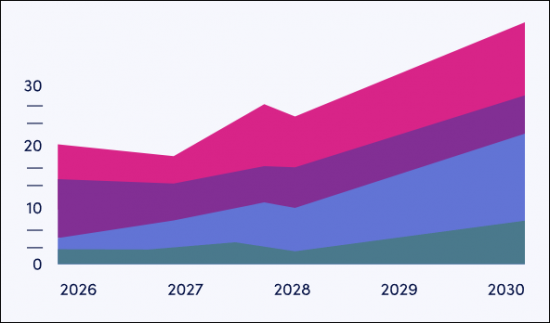
市場動向。戦略レポート:
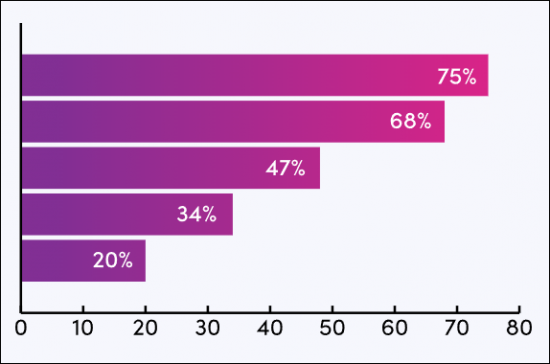
現在の市場情勢を包括的に分析し、戦略的な提言を行います。
目次
市場動向・戦略
第1章 重要ポイントと戦略的推奨事項
- 重要ポイント
- 主要な戦略的推奨事項
第2章 市場情勢
- IoTローミング市場を牽引する主な動向
- 5GとLPWAの登場にもかかわらず、4GがIoTローミングにとって引き続き重要
- IoTローミングにおけるLPWAの重要性の増大
- 5G IoTローミングの成長
第3章 将来の機会と市場戦略
- 主要な機会と市場戦略
- 2Gおよび3Gのサンセット戦略
- TAPとBCE
- ローミング分析
- ローミングステアリング
- eSIMとiSIM
- IoTセーフ
第4章 国別準備指数
- 国別準備指数:イントロダクション
- 焦点市場
- 成長市場
- 新興市場
競合リーダーボード
第1章 IoTローミングVASサービス:競合リーダーボード
第2章 IoTローミングVASベンダー:プロファイル
- ベンダープロファイル
- A1 International Business
- BICS
- Cellusys
- Comfone
- MACH
- Mobileum
- Syniverse
- Tata Communications
- Telna
- Tele2
- Telefonica Global Solutions
- TNS
- Juniper Researchリーダーボード評価手法
- 制限と解釈
第3章 世界のIoT接続:競合リーダーボード
第4章 世界のIoT接続:競合リーダーボード
- AT&T
- A1 Digital
- BICS
- Deutsche Telekom
- emnify
- Eseye
- iBASIS
- Kore Wireless
- Onomondo
- Orange Business Services
- Soracom
- Tata Communications
- Tele2 IoT
- Telefonica Tech
- Telenor Connexion
- Telit Cinterion
- Velos IoT
- Verizon
- Vodafone Business
- Wireless Logic
- Juniper Researchリーダーボード評価手法
- 制限と解釈
データ・予測
第1章 イントロダクション・調査手法
第2章 市場概要・今後の市場見通し
- ローミング中のIoT接続の総数
- ローミングIoT接続による通信事業者収益
- ローミングIoT接続により生成されるデータの合計
- ローミング4G IoT接続の総数
- ローミング4G IoT接続による通信事業者収益
- ローミング4G IoT接続により生成されるデータの合計
- ローミング5G IoT接続の総数
- ローミング5G IoT接続による通信事業者収益
- ローミング5G IoT接続により生成されるデータの合計
- ローミングLPWA IoT接続の総数
- ローミングLPWA IoT接続による通信事業者収益
- ローミングLPWA IoT接続により生成されるデータの合計
| KEY STATISTICS | |
|---|---|
| Operator IoT roaming revenue in 2024: | $1.1bn |
| Operator IoT roaming revenue in 2029: | $2.3bn |
| 5G IoT roaming connections in 2029: | 39m |
| Forecast period: | 2024-2029 |
'Operator IoT Roaming Revenue to Break $2 Billion by 2029'
Overview
Our "IoT Roaming" research suite provides insights and actionable insights into the role of IoT roaming in the rapidly growing cellular IoT market; enabling stakeholders, such as mobile operators, IoT device manufacturers, and IoT MVNOs (Mobile Virtual Network Operators) to navigate the growing demand for IoT roaming connectivity.
Included is a detailed assessment of the key trends in the IoT roaming market, including the growing demand for 5G and LPWA (Low Power Wide Area)/LPWAN (Low Power Wide Area Network) roaming connectivity, as well as the growing role of eSIM technology in IoT roaming. Our 5G analysis assesses the role of 5G enhanced connectivity solutions, which provide improved quality of service; optimised for specific use cases.
The forms of 5G enhanced connectivity discussed include:
|
|
The report also provides strategic recommendations for how operators and IoT connectivity providers can improve their monetisation of IoT roaming connectivity via the GSMA's (Global System for Mobile Communications Association) BCE (Billing and Charging Evolution), and improve their use of roaming steering solutions, as well as roaming analytics.
The research delivers recommendations for how operators and IoT connectivity providers can improve their IoT roaming services and IoT solutions to enterprises, with strategic recommendations for the integration of satellite IoT connectivity to provide seamless connectivity. Plus development of eSIM technology services as a solution to roaming restrictions such as those on permanent roaming, including analysis of SGP.32, and the integration of AI and improvement of roaming analytics for enterprises. It includes further strategic recommendations for the development of IoT security solutions, including IoT SAFE, and analysis of how enterprises can be supported in managing the impact of 2G and 3G network sunsetting.
The market forecast suite includes several different options that can be purchased separately, including access to data mapping and a forecast document, a strategy and trends document detailing critical trends in the market, and strategic recommendations for developing and monetising IoT roaming services, such as the development of new charging models using BCE and the continued expansion of eSIM localisation services.
The report includes two Competitor Leaderboards. The first Competitor Leaderboard contains extensive analysis of the IoT roaming value-added services; assessing 12 market leaders providing a range of value-added services such as roaming analytics, roaming steering, and data and financial clearing. The second Competitor Leaderboard contains in-depth analysis of 20 leading vendors providing global IoT connectivity services to enterprises. It can also be purchased as a Full Research Suite, which contains all these elements and offers a substantial discount.
Collectively, they provide a critical tool for understanding the IoT roaming market, which will allow operators and IoT connectivity providers to shape their future strategies for service development and monetisation. Its unparalleled coverage makes this research suite an incredibly useful resource for charting the future of a crucial connectivity market.
Key Features
- Market Dynamics: Insights into key trends and opportunities within the IoT roaming market, such as the integration of satellite IoT connectivity into global connectivity offerings, the development of tools for enterprises to influence traffic steering, eSIM technology and localisation services for enterprises, and the development of IoT security solutions, including IoT SAFE and quantum-resistant cryptography for IoT. It also includes analysis and recommendations for where operators and IoT connectivity vendors must look to invest to improve their IoT roaming services. This includes the development of 5G-enhanced connectivity roaming, inter-network slice roaming steering, the transition to BCE, and the development of new charging models, such as network access for IoT roaming.
- Key Takeaways & Strategic Recommendations: In-depth analysis of key development opportunities and findings within the IoT roaming market, accompanied by strategic recommendations for operators and IoT connectivity providers.
- Benchmark Industry Forecasts: Data for the total number of roaming IoT connections, total operator revenue from roaming IoT connections, and total cellular data generated by roaming IoT connections. This data is provided for the market as a whole, as well as being split by the following network technologies: 2G and 3G, 4G, 5G, and LPWA.
- Juniper Research Competitor Leaderboards: Key player capability and capacity assessment of 12 IoT roaming value-added services vendors, and 20 global IoT connectivity provider. This features market sizing of vendors in each sector and detailed analysis of their offerings.
SAMPLE VIEW
Market Data & Forecasting Report:

The numbers tell you what's happening, but our written report details why, alongside the methodologies.
Market Trends & Strategies Report:

A comprehensive analysis of the current market landscape, alongside strategic recommendations.
Table of Contents
Market Trends & Strategies
1. Key Takeaways & Strategic Recommendations
- 1.1. Key Takeaways
- 1.2. Key Strategic Recommendations
2. Market Landscape
- 2.1. Introduction
- 2.2. Key Trends Driving the IoT Roaming Market
- Figure 2.1: Total Number of IoT Roaming Connections (m), Split By 8 Key Regions, 2024-2029
- 2.2.1. 4G to Remain Critical to IoT Roaming, Despite Emergence of 5G and LPWA
- Figure 2.2: Total Number of 4G IoT Roaming Connections (m), Split By 8 Key Regions, 2024-2029
- Table 2.3: 4G IoT Roaming Connections Compound Annual Growth Rate 2024-2029
- 2.2.2. LPWA to Become Increasingly Important in IoT Roaming
- Figure 2.4: Total Number of LPWA Roaming Connections, Split By 8 Key Regions, 2024-2029
- Table 2.5: NB-IoT and LTE-M Comparison
- Table 2.6: NB-IoT Evolution Comparison in 3GPP Standards
- Table 2.7: LTE Cat-M1 and LTE Cat-M2 Connectivity Comparison in 3GPP Standards
- Figure 2.8: Key LTE-M Use Cases
- 2.2.3. 5G IoT Roaming Growth
- Figure 2.9: Total Number of 5G IoT Roaming Connections, Split By 8 Key Regions, 2024-2029
- i. Enhanced Connectivity Roaming
3. Future Opportunities and Market Strategies
- 3.1. Key Opportunities and Market Strategies
- 3.1.1. 2G and 3G Sunsetting Strategies
- Figure 3.1: Total Number of 2G and 3G IoT Roaming Devices (m), Split By 8 Key Regions, 2024-2029
- Table 3.2: Upcoming 2G and 3G Network Sunsets (August 2024)
- 3.1.2. TAP and BCE
- Figure 3.3: BCE Reporting Exchange Flow
- 3.1.3. Roaming Analytics
- i. Provider Roaming Analytics
- ii. Enterprise Roaming Analytics
- Figure 3.4: Key Examples of Enterprise Roaming Analytics
- 3.1.4. Roaming Steering
- Table 3.5: OTA Roaming Steering Benefits and Costs
- Table 3.6: Signalling Roaming Steering Benefits and Costs
- 3.1.5. eSIM and iSIM
- ii. iSIM
- Table 3.7: SIM Form Factors and Dimensions
- ii. iSIM
- 3.1.6. IoT SAFE
- Figure 3.8: IoT SAFE Architecture
- Table 3.9: IoT SAFE Applet 1 and 2 Comparison
- Figure 3.10: IoT SAFE Service Operations
- Satellite IoT Roaming
- Figure 3.11: Total Satellite IoT Services Revenue ($m), Split by Market Vertical, 2024-2029
- Table 3.12: Select Recent Satellite IoT Announcements
- 3.1.1. 2G and 3G Sunsetting Strategies
4. Country Readiness Index
- 4.1. Introduction to Country Readiness Index
- Figure 4.1: IoT Roaming Country Readiness Index Regional Definitions
- Table 4.2: Juniper Research Country Readiness Index Scoring Criteria
- Figure 4.3: Juniper Research Country Readiness Index
- Table 4.4: Report Country Readiness Index: Market Segments
- 4.1.1. Focus Market
- Figure 4.5: Total Number of LPWA Roaming Connections in Select Focus Markets (m), Split By 8 Key Regions, 2024-2029
- ii. The US
- Figure 4.6: Total Number of IoT Roaming Connections in the US (m), 2024-2029
- Figure 4.7: Total Operator Revenue from IoT Roaming in the US ($m), 2024-2029
- iii. China
- Figure 4.8: Total Number of IoT Roaming Connections in China (m), 2024-2029
- 4.2. Growth Markets
- Figure 4.9: Total Number of IoT Roaming Connections in Select Key Growth Markets (m), 2024-2029
- Figure 4.10: Total Number of IoT Roaming Connections in India (m), Regions, 2024-2029
- Table 4.11: TRAI IoT eSIM recommendations
- 4.3. Developing Markets
- Table 4.12: Juniper Research's Country Readiness Index Heatmap: North America
- Table 4.13: Juniper Research's Country Readiness Index Heatmap: Latin America
- Table 4.14: Juniper Research's Country Readiness Index Heatmap: West Europe
- Table 4.15: Juniper Research's Country Readiness Index Heatmap: Central & East Europe
- Table 4.16: Juniper Research's Country Readiness Index Heatmap: Far East & China
- Table 4.17: Juniper Research's Country Readiness Index Heatmap: Indian Subcontinent
- Table 4.18: Juniper Research's Country Readiness Index Heatmap: Rest of Asia Pacific
- Table 4.19: Juniper Research's Country Readiness Index Heatmap: Africa & Middle East
Competitor Leaderboard
1. IoT Roaming VAS Services Competitor Leaderboard
- 1.1. Why Read this Report
- Table 1.1: Juniper Research Competitor Leaderboard Vendors and Product Portfolios: IoT Roaming
- Figure 1.2: Juniper Research Competitor Leaderboard: 12 Vendors
- Source: Juniper ResearchTable 1.3: Juniper Research Competitor Leaderboard: IoT Roaming Value-added Services Vendors & Positioning
- Table 1.4: Juniper Research Competitor Leaderboard Heatmap: 12 Vendors
- Source: Juniper ResearchTable 1.3: Juniper Research Competitor Leaderboard: IoT Roaming Value-added Services Vendors & Positioning
2. IoT Roaming VAS Vendor Profiles
- 2.1. Vendor Profiles
- 2.1.1. A1 International Business
- i. Corporate Information
- Table 2.1: A1 Group Select Financial Information
- ii. Geographical Spread
- iii. Key Clients & Strategic Partnerships
- iv. High-level View of Offerings
- v. Juniper Research's View: Key Strengths & Strategic Development Opportunities
- i. Corporate Information
- 2.1.2. BICS
- i. Corporate Information
- Table 2.2: BICS' Revenue, 2022-2023
- ii. Geographical Spread
- Figure 2.3. BICS' Global Presence Map
- iii. Key Clients & Strategic Partnerships
- iv. High-level View of Offerings
- Table 2.4: BICS Roaming Services
- v. Juniper Research's View: Key Strengths & Strategic Development Opportunities
- i. Corporate Information
- 2.1.3. Cellusys
- i. Corporate Information
- ii. Geographical Spread
- iii. Key Clients & Strategic Partnerships
- iv. High-level View of Offerings
- Figure 2.5: Cellusys' Offerings
- v. Juniper Research's View: Key Strengths & Strategic Development Opportunities
- 2.1.4. Comfone
- i. Corporate Information
- ii. Geographical Spread
- iii. Key Clients & Strategic Partnerships
- iv. High-level View of Offerings
- Figure 2.6: Comfone's Key2roam Hub Coverage Map
- v. Juniper Research's View: Key Strengths & Strategic Development Opportunities
- 2.1.5. MACH
- i. Corporate Information
- ii. Geographical Spread
- iii. Key Clients & Strategic Partnerships
- iv. High-level View of Offerings
- v. Juniper Research's View: Key Strengths & Strategic Development Opportunities
- 2.1.6. Mobileum
- i. Corporate Information
- ii. Geographical Spread
- iii. Key Clients & Strategic Partnerships
- iv. High-level View of Offerings
- Figure 2.7: Mobileum Wholesale Business Advisor
- Figure 2.8: Mobileum IoT Steering of Roaming
- v. Juniper Research's View: Key Strengths & Strategic Development Opportunities
- 2.1.7. Syniverse
- i. Corporate Information
- ii. Geographical Spread
- iii. Key Clients & Strategic Partnerships
- iv. High-level View of Offerings
- v. Juniper Research's View: Key Strengths & Strategic Development Opportunities
- 2.1.8. Tata Communications
- i. Corporate Information
- Table 2.10: Tata Communications' Select Financial Information (Indian Rupee in crore), FY24
- ii. Geographical Spread
- iii. Key Clients & Strategic Partnerships
- iv. High-level View of Offerings
- Figure 2.11: Tata Communications' Roaming Offerings
- v. Juniper Research's View: Key Strengths & Strategic Development Opportunities
- i. Corporate Information
- 2.1.9. Telna
- iv. High-level View of Offerings
- v. Juniper Research's View: Key Strengths & Strategic Development Opportunities
- 2.1.10. Tele2
- i. Corporate Information
- ii. Geographical Spread
- iii. Key Clients & Strategic Partnerships
- iv. High-level View of Offerings
- v. Juniper Research's View: Key Strengths & Strategic Development Opportunities
- 2.1.11. Telefonica Global Solutions
- i. Corporate Information
- Table 2.12: Telefonica's Select Financial Information (Euro-m), 2020-2022
- ii. Geographical Spread
- iii. Key Clients & Strategic Partnerships
- iv. High-level View of Offerings
- Figure 2.13: TGS 5G Roaming Suite
- v. Juniper Research's View: Key Strengths & Strategic Development Opportunities
- i. Corporate Information
- 2.1.12. TNS
- i. Corporate Information
- ii. Geographical Spread
- iii. Key Clients & Strategic Partnerships
- iv. High-level View of Offerings
- v. Juniper Research's View: Key Strengths & Strategic Development Opportunities
- 2.1.1. A1 International Business
- 2.2. Juniper Research Leaderboard Assessment Methodology
- 2.3. Limitations & Interpretations
- Table 2.14: Juniper Research Competitor Leaderboard: IoT Roaming Value-added Services
3. Global IoT Connectivity Competitor Leaderboard
- 3.1. Introduction
- Figure 3.3.1: Juniper Research Competitor Leaderboard Vendors and Product Portfolios (Part One)
- Table 3.3.2: Juniper Research Competitor Leaderboard Vendors and Product Portfolios (Part Two)
- Figure 3.3.3: Juniper Research Competitor Leaderboard: Global IoT Connectivity
- Source: Juniper ResearchTable 3.4: Juniper Research Competitor Leaderboard: Vendors & Positioning
- Table 3.3.5: Juniper Research Competitor Leaderboard Heatmap: 20 Vendors (Part One)
- Figure 3.6: Juniper Research Competitor Leaderboard Heatmap: 20 Vendors (Part Two)
4. Global IoT Connectivity Competitor Leaderboard
- 4.1. Vendor Profiles
- 4.1.1. AT&T
- i. Corporate Information
- ii. Geographical Spread
- iii. Key clients & Strategic Partnerships
- iv. High-level View of Offerings
- Figure 4.1: IoT Console
- Figure 4.2: AT&T Control Center Features
- v. Juniper Research's View: Key Strengths & Strategic Development Opportunities
- 4.1.2. A1 Digital
- i. Corporate Information
- Table 4.3: A1 Group Select Financial Information, 2020-2023
- ii. Geographical Spread
- Figure 4.4: A1 Telekom Austria Group Operations Map
- iii. Key Clients & Strategic Partnerships
- iv. High-level View of Offerings
- v. Juniper Research's View: Key Strengths & Strategic Development Opportunities
- i. Corporate Information
- 4.1.3. BICS
- i. Corporate Information
- Table 4.5: BICS Revenue ($), 2022-2023
- ii. Geographical Spread
- iii. Key Clients & Strategic Partnerships
- iv. High-level View of Offerings
- v. Juniper Research's View: Key Strengths & Strategic Development Opportunities
- i. Corporate Information
- 4.1.4. Deutsche Telekom
- i. Corporate Information
- ii. Geographical Spread
- iii. Key Clients & Strategic Partnerships
- iv. High-level View of Offerings
- Figure 4.6: Deutsche Telekom IoT Connectivity Coverage
- Figure 4.7: Deutsche Telekom Platform Integrations
- v. Juniper Research's View: Key Strengths & Strategic Development Opportunities
- 4.1.5. emnify
- i. Corporate Information
- ii. Geographical Spread
- iii. Key Clients & Strategic Partnerships
- iv. High-level View of Offerings
- Figure 4.8: emnify 5G Coverage
- v. Juniper Research's View: Key Strengths & Strategic Development Opportunities
- 4.1.6. Eseye
- i. Corporate Information
- ii. Geographical Spread
- iii. Key Clients & Strategic Partnerships
- iv. High-level View of Offerings
- Figure 4.10: Eseye's AnyNet Federation and Direct Operator Interconnects (August 2024)
- v. Juniper Research's View: Key Strengths & Strategic Development Opportunities
- 4.1.7. iBASIS
- i. Corporate Information
- ii. Geographical Spread
- Figure 4.11: iBASIS' Global Customer Connections
- iii. Key Clients & Strategic Partnerships
- iv. High-level View of Offerings
- Figure 4.12: iBASIS' NB-IoT and LTE-M Coverage
- v. Juniper Research's View: Key Strengths & Strategic Development Opportunities
- 4.1.8. Kore Wireless
- i. Corporate Information
- ii. Geographical Spread
- iii. Key Clients & Strategic Partnerships
- iv. High-level View of Offerings
- Figure 4.13: Kore One Platform
- v. Juniper Research's View: Key Strengths & Strategic Development Opportunities
- 4.1.9. Onomondo
- i. Corporate Information
- ii. Geographical Spread
- iii. Key Clients & Strategic Partnerships
- iv. High-level View of Offerings
- v. Juniper Research's View: Key Strengths & Strategic Development Opportunities
- 4.1.10. Orange Business Services
- i. Corporate Information
- ii. Geographical Spread
- Figure 4.14: Orange Operations Map
- ii. Key Clients & Strategic Partnerships
- iv. High-level View of Offerings
- v. Juniper Research's View: Key Strengths & Strategic Development Opportunities
- 4.1.11. Soracom
- i. Corporate Information
- ii. Geographical Spread
- iii. Key Clients & Strategic Partnerships
- iv. High-level View of Offerings
- Figure 4.15: Soracom Endorse Authentication Process
- Figure 4.16: Soracom Lagoon
- Figure 4.17: Soracom Unified Endpoint
- v. Juniper Research's View: Key Strengths & Strategic Development Opportunities
- 4.1.12. Tata Communications
- i. Corporate Information
- Table 4.18: Tata Communications' Select Financial Information (Indian Rupee in crore), FY24
- ii. Geographical Spread
- iii. Key Clients & Strategic Partnerships
- iv. High-level View of Offerings
- v. Juniper Research's View: Key Strengths & Strategic Development Opportunities
- i. Corporate Information
- 4.1.13. Tele2 IoT
- i. Corporate Information
- ii. Geographical Spread
- iii. Key Clients & Strategic Partnerships
- iv. High-level View of Offerings
- Figure 4.19: Tele2 IoT Network Support 2024
- Figure 4.20: Tele2 2ACESS Data Transfer Management
- v. Juniper Research's View: Key Strengths & Strategic Development Opportunities
- 4.1.14. Telefonica Tech
- i. Corporate Information
- Table 4.21: Telefonica's Select Financial Information (Euro-m), 2020-2022
- ii. Geographical Spread
- iii. Key Clients & Strategic Partnerships
- iv. High-level View of Offerings
- v. Juniper Research's View: Key Strengths & Strategic Development Opportunities
- i. Corporate Information
- 4.1.15. Telenor Connexion
- i. Corporate Information
- ii. Geographical Spread
- iii. Key Clients & Strategic Partnerships
- iv. High-level View of Offerings
- Figure 4.22: Telenor Connexion's IoT Cloud Solution
- v. Juniper Research's View: Key Strengths & Strategic Development Opportunities
- 4.1.16. Telit Cinterion
- i. Corporate Information
- Table 4.23: Telit Cinterion's Select Financial Information ($m), 2020-2021
- ii. Geographical Spread
- iii. Key Clients & Strategic Partnerships
- iv. High-level View of Offerings
- Figure 4.24: Telit eSIM Provisioning Platform
- v. Juniper Research's View: Key Strengths & Strategic Development Opportunities
- i. Corporate Information
- 4.1.17. Velos IoT
- i. Corporate Information
- ii. Geographical Spread
- iii. Key Clients & Strategic Partnerships
- iv. High-level View of Offerings
- Figure 4.25: Velos NB-IoT and LTE-M Coverage
- Figure 4.26: Velos IoT eSIM Connectivity Hub Features
- v. Juniper Research's View: Key Strengths & Strategic Development Opportunities
- 4.1.18. Verizon
- i. Corporate Information
- ii. Geographical Spread
- iii. Key Clients & Strategic Partnerships
- iv. High-level View of Offerings
- v. Juniper Research's View: Key Strengths & Strategic Development Opportunities
- 4.1.19. Vodafone Business
- i. Corporate Information
- Table 4.27: Vodafone Business Select Financial Information (Million), 2022-2023
- ii. Geographical Spread
- iii. Key Clients & Strategic Partnerships
- iv. High-level View of Offerings
- Figure 4.28: Vodafone Business' LPWA Services Availability
- v. Juniper Research's View: Key Strengths & Strategic Development Opportunities
- i. Corporate Information
- 4.1.20. Wireless Logic
- i. Corporate Information
- ii. Geographical Spread
- iii. Key Clients & Strategic Partnerships
- iv. High-level View of Offerings
- v. Juniper Research's View: Key Strengths & Strategic Development Opportunities
- 4.1.1. AT&T
- 4.2. Juniper Research Leaderboard Assessment Methodology
- 4.3. Limitations & Interpretations
- Table 4.29: Juniper Research Competitor Leaderboard: Global IoT Connectivity
Data & Forecasting
1. Introduction and Methodology
- 1.1. Introduction
- 1.2. Forecast Methodology
- Figure 1.1: IoT Roaming Forecast Methodology
2. Market Summary and Future Market Outlook
- 2.1. Total Number of IoT Connections that Are Roaming
- Figure & Table 2.1: Total Number of IoT Connections that Are Roaming (m), Split By 8 Key Regions, 2024-2029
- Table 2.2: Total Number of IoT Roaming Connections Split by Network Type (m), 2024-2029
- 2.2. Total Operator Revenue from Roaming IoT Connectivity
- Figure & Table 2.3: Total Operator Revenue from Roaming IoT Connectivity
- 2.3. Total Data Generated by Roaming IoT Connections
- Figure & Table 2.4: Total Data Generated by Roaming IoT Connections
- 2.4. Total Number of Roaming 4G IoT Connections
- Figure & Table 2.5: Tota Number of Roaming 4G IoT Connections, Split By 8 Key Regions, 2024-2029
- 2.5. Total Operator Revenue from Roaming 4G IoT Connections
- Figure & Table 2.6: Total Operator Revenue from Roaming 4G IoT Connections ($m), Split By 8 Key Regions, 2024-2029
- 2.6. Total Data Generated by Roaming 4G IoT Connections
- Figure & Table 2.7: Total Data Generated by 4G IoT Connections (PB), Split By 8 Key Regions, 2024-2029
- 2.7. Total Number of Roaming 5G IoT Connections
- Figure & Table 2.8: Total Number of Roaming 5G IoT Connections (m), Split By 8 Key Regions, 2024-2029
- 2.8. Total Operator Revenue from Roaming 5G IoT Connections
- Figure 2.9: Total Operator Revenue from Roaming 5G IoT Connections ($m), Split By 8 Key Regions, 2024-2029
- 2.9. Total Data Generated by Roaming 5G IoT Connections
- Figure & Table 2.10: Total Data Generated by Roaming 5G IoT Connections (PB), Split By 8 Key Regions, 2024-2029
- 2.10. Total Number of Roaming LPWA IoT Connections
- Figure & Table 2.11: Total Number of Roaming LPWA IoT Connections (m), Split By 8 Key Regions, 2024-2029
- 2.11. Total Operator Revenue from Roaming LPWA IoT Connections
- Figure & Table 2.12: Total Operator Revenue from Roaming LPWA IoT Connections ($m), Split By 8 Key Regions, 2024-2029
- Table 2.13: Average Operator Revenue Per Month ($), Split By 8 Key Regions, 2024-2029
- 2.12. Total Data Generated by Roaming LPWA IoT Connections
- Figure & Table 2.14: Total Data Generated by Roaming LPWA IoT Connections (PB), Split By 8 Key Regions, 2024-2029
