|
|
市場調査レポート
商品コード
1684882
医療教育の世界市場、2025-2029年Global Medical Education Market 2025-2029 |
||||||

|
|||||||
カスタマイズ可能
|
|||||||


| 医療教育の世界市場、2025-2029年 |
|
出版日: 2025年03月07日
発行: TechNavio
ページ情報: 英文 222 Pages
納期: 即納可能
|

全表示
- 概要
- 図表
- 目次
医療教育市場は2024-2029年に2,945億米ドル、予測期間中のCAGRは18.4%で成長すると予測されます。
当レポートでは、医療教育市場の全体的な分析、市場規模・予測、動向、成長促進要因、課題、約25のベンダーを網羅したベンダー分析などを掲載しています。
現在の市場シナリオ、最新動向と促進要因、市場環境全体に関する最新分析を提供しています。市場は、オンライン医療教育プログラム数の増加、医療教育におけるビジュアル技術の登場、新しい医療コースやプラットフォームの導入による有機的成長の上昇によって牽引されています。
| 市場範囲 | |
|---|---|
| 基準年 | 2025 |
| 終了年 | 2029 |
| 予測期間 | 2025-2029 |
| 成長モメンタム | 加速 |
| 前年比2025年 | 16.3% |
| CAGR | 18.4% |
| 増分額 | 2,945億米ドル |
本調査は、業界の主要参加者からのインプットを含め、一次情報と二次情報を客観的に組み合わせて実施しました。本レポートには、主要企業の分析に加え、包括的な市場規模データ、地域別分析によるセグメント、ベンダー情勢が含まれています。レポートは過去データと予測データを掲載しています。
本調査では、医療教育におけるゲーミフィケーションが、今後数年間の医療教育市場の成長を促進する主要な理由の1つであると特定しています。また、医療教育における医療系大学と協会間のパートナーシップの増加やマイクロラーニングの人気の高まりは、市場の大きな需要につながるでしょう。
目次
第1章 エグゼクティブサマリー
- 市場概要
第2章 Technavio分析
- 価格・ライフサイクル・顧客購入バスケット・採用率・購入基準の分析
- インプットの重要性と差別化の要因
- 混乱の要因
- 促進要因と課題の影響
第3章 市場情勢
- 市場エコシステム
- 市場の特徴
- バリューチェーン分析
第4章 市場規模
- 市場の定義
- 市場セグメント分析
- 市場規模 2024
- 市場の見通し 2024-2029
第5章 市場規模実績
- 医療教育の世界市場 2019-2023
- コースセグメント分析 2019-2023
- 提供セグメント分析 2019-2023
- タイプセグメント分析 2019-2023
- 地域別セグメント分析 2019-2023
- 国別セグメント分析 2019-2023
第6章 定性分析
- AIの影響:医療教育の世界市場
第7章 ファイブフォース分析
- ファイブフォースの要約
- 買い手の交渉力
- 供給企業の交渉力
- 新規参入業者の脅威
- 代替品の脅威
- 競争の脅威
- 市況
第8章 市場セグメンテーション:コース別
- 市場セグメント
- 比較:コース別
- 心臓胸部:市場規模と予測 2024-2029
- 神経学:市場規模と予測 2024-2029
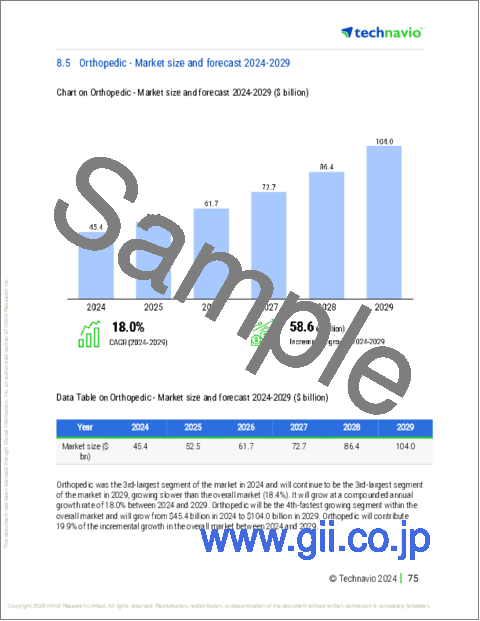
- 整形外科:市場規模と予測 2024-2029
- 口腔および顎顔面:市場規模と予測 2024-2029
- その他:市場規模と予測 2024-2029
- 市場機会:コース別
第9章 市場セグメンテーション:提供別
- 市場セグメント
- 比較:提供別
- キャンパス内:市場規模と予測 2024-2029
- オンライン:市場規模と予測 2024-2029
- 距離:市場規模と予測 2024-2029
- 市場機会:提供別
第10章 市場セグメンテーション:タイプ別
- 市場セグメント
- 比較:タイプ別
- 卒業コース:市場規模と予測 2024-2029
- 認定とトレーニング:市場規模と予測 2024-2029
- 大学院コース:市場規模と予測 2024-2029
- 市場機会:タイプ別
第11章 顧客情勢
- 顧客情勢の概要
第12章 地域別情勢
- 地域別セグメンテーション
- 地域別比較
- 北米:市場規模と予測 2024-2029
- 欧州:市場規模と予測 2024-2029
- アジア太平洋:市場規模と予測 2024-2029
- 南米:市場規模と予測 2024-2029
- 中東・アフリカ:市場規模と予測 2024-2029
- 米国:市場規模と予測 2024-2029
- 中国:市場規模と予測 2024-2029
- カナダ:市場規模と予測 2024-2029
- 英国:市場規模と予測 2024-2029
- ドイツ:市場規模と予測 2024-2029
- イタリア:市場規模と予測 2024-2029
- インド:市場規模と予測 2024-2029
- ブラジル:市場規模と予測 2024-2029
- フランス:市場規模と予測 2024-2029
- 日本:市場規模と予測 2024-2029
- 市場機会:地域情勢別
第13章 促進要因・課題・機会・抑制要因
- 市場促進要因
- 市場の課題
- 促進要因と課題の影響
- 市場の機会・抑制要因
第14章 競合情勢
- 概要
- 競合情勢
- 混乱の状況
- 業界のリスク
第15章 競合分析
- 企業プロファイル
- 企業ランキング指数
- 企業の市場ポジショニング
- Grand Canyon University
- Harvard Medical School
- Johns Hopkins University
- KP Bernard J. Tyson School of Medicine
- National University of Singapore
- New York University
- Stanford University
- The University of Alabama
- University of California
- University of Cambridge
- University of Eastern Finland
- University of New England
- University of Oxford
- University of Washington
- Yale University
第16章 付録
Exhibits:
- Exhibits1: Executive Summary - Chart on Market Overview
- Exhibits2: Executive Summary - Data Table on Market Overview
- Exhibits3: Executive Summary - Chart on Global Market Characteristics
- Exhibits4: Executive Summary - Chart on Market By Geographical Landscape
- Exhibits5: Executive Summary - Chart on Market Segmentation by Courses
- Exhibits6: Executive Summary - Chart on Market Segmentation by Delivery
- Exhibits7: Executive Summary - Chart on Market Segmentation by Type
- Exhibits8: Executive Summary - Chart on Incremental Growth
- Exhibits9: Executive Summary - Data Table on Incremental Growth
- Exhibits10: Executive Summary - Chart on Company Market Positioning
- Exhibits11: Analysis of price sensitivity, lifecycle, customer purchase basket, adoption rates, and purchase criteria
- Exhibits12: Overview on criticality of inputs and factors of differentiation
- Exhibits13: Overview on factors of disruption
- Exhibits14: Impact of drivers and challenges in 2024 and 2029
- Exhibits15: Parent Market
- Exhibits16: Data Table on - Parent Market
- Exhibits17: Market characteristics analysis
- Exhibits18: Value chain analysis
- Exhibits19: Offerings of companies included in the market definition
- Exhibits20: Market segments
- Exhibits21: Chart on Global - Market size and forecast 2024-2029 ($ billion)
- Exhibits22: Data Table on Global - Market size and forecast 2024-2029 ($ billion)
- Exhibits23: Chart on Global Market: Year-over-year growth 2024-2029 (%)
- Exhibits24: Data Table on Global Market: Year-over-year growth 2024-2029 (%)
- Exhibits25: Historic Market Size - Data Table on Global Medical Education Market 2019 - 2023 ($ billion)
- Exhibits26: Historic Market Size - Courses Segment 2019 - 2023 ($ billion)
- Exhibits27: Historic Market Size - Delivery Segment 2019 - 2023 ($ billion)
- Exhibits28: Historic Market Size - Type Segment 2019 - 2023 ($ billion)
- Exhibits29: Historic Market Size - Geography Segment 2019 - 2023 ($ billion)
- Exhibits30: Historic Market Size - Country Segment 2019 - 2023 ($ billion)
- Exhibits31: Five forces analysis - Comparison between 2024 and 2029
- Exhibits32: Bargaining power of buyers - Impact of key factors 2024 and 2029
- Exhibits33: Bargaining power of suppliers - Impact of key factors in 2024 and 2029
- Exhibits34: Threat of new entrants - Impact of key factors in 2024 and 2029
- Exhibits35: Threat of substitutes - Impact of key factors in 2024 and 2029
- Exhibits36: Threat of rivalry - Impact of key factors in 2024 and 2029
- Exhibits37: Chart on Market condition - Five forces 2024 and 2029
- Exhibits38: Chart on Courses - Market share 2024-2029 (%)
- Exhibits39: Data Table on Courses - Market share 2024-2029 (%)
- Exhibits40: Chart on Comparison by Courses
- Exhibits41: Data Table on Comparison by Courses
- Exhibits42: Chart on Cardiothoracic - Market size and forecast 2024-2029 ($ billion)
- Exhibits43: Data Table on Cardiothoracic - Market size and forecast 2024-2029 ($ billion)
- Exhibits44: Chart on Cardiothoracic - Year-over-year growth 2024-2029 (%)
- Exhibits45: Data Table on Cardiothoracic - Year-over-year growth 2024-2029 (%)
- Exhibits46: Chart on Neurology - Market size and forecast 2024-2029 ($ billion)
- Exhibits47: Data Table on Neurology - Market size and forecast 2024-2029 ($ billion)
- Exhibits48: Chart on Neurology - Year-over-year growth 2024-2029 (%)
- Exhibits49: Data Table on Neurology - Year-over-year growth 2024-2029 (%)
- Exhibits50: Chart on Orthopedic - Market size and forecast 2024-2029 ($ billion)
- Exhibits51: Data Table on Orthopedic - Market size and forecast 2024-2029 ($ billion)
- Exhibits52: Chart on Orthopedic - Year-over-year growth 2024-2029 (%)
- Exhibits53: Data Table on Orthopedic - Year-over-year growth 2024-2029 (%)
- Exhibits54: Chart on Oral and maxillofacial - Market size and forecast 2024-2029 ($ billion)
- Exhibits55: Data Table on Oral and maxillofacial - Market size and forecast 2024-2029 ($ billion)
- Exhibits56: Chart on Oral and maxillofacial - Year-over-year growth 2024-2029 (%)
- Exhibits57: Data Table on Oral and maxillofacial - Year-over-year growth 2024-2029 (%)
- Exhibits58: Chart on Others - Market size and forecast 2024-2029 ($ billion)
- Exhibits59: Data Table on Others - Market size and forecast 2024-2029 ($ billion)
- Exhibits60: Chart on Others - Year-over-year growth 2024-2029 (%)
- Exhibits61: Data Table on Others - Year-over-year growth 2024-2029 (%)
- Exhibits62: Market opportunity by Courses ($ billion)
- Exhibits63: Data Table on Market opportunity by Courses ($ billion)
- Exhibits64: Chart on Delivery - Market share 2024-2029 (%)
- Exhibits65: Data Table on Delivery - Market share 2024-2029 (%)
- Exhibits66: Chart on Comparison by Delivery
- Exhibits67: Data Table on Comparison by Delivery
- Exhibits68: Chart on On-campus - Market size and forecast 2024-2029 ($ billion)
- Exhibits69: Data Table on On-campus - Market size and forecast 2024-2029 ($ billion)
- Exhibits70: Chart on On-campus - Year-over-year growth 2024-2029 (%)
- Exhibits71: Data Table on On-campus - Year-over-year growth 2024-2029 (%)
- Exhibits72: Chart on Online - Market size and forecast 2024-2029 ($ billion)
- Exhibits73: Data Table on Online - Market size and forecast 2024-2029 ($ billion)
- Exhibits74: Chart on Online - Year-over-year growth 2024-2029 (%)
- Exhibits75: Data Table on Online - Year-over-year growth 2024-2029 (%)
- Exhibits76: Chart on Distance - Market size and forecast 2024-2029 ($ billion)
- Exhibits77: Data Table on Distance - Market size and forecast 2024-2029 ($ billion)
- Exhibits78: Chart on Distance - Year-over-year growth 2024-2029 (%)
- Exhibits79: Data Table on Distance - Year-over-year growth 2024-2029 (%)
- Exhibits80: Market opportunity by Delivery ($ billion)
- Exhibits81: Data Table on Market opportunity by Delivery ($ billion)
- Exhibits82: Chart on Type - Market share 2024-2029 (%)
- Exhibits83: Data Table on Type - Market share 2024-2029 (%)
- Exhibits84: Chart on Comparison by Type
- Exhibits85: Data Table on Comparison by Type
- Exhibits86: Chart on Graduation courses - Market size and forecast 2024-2029 ($ billion)
- Exhibits87: Data Table on Graduation courses - Market size and forecast 2024-2029 ($ billion)
- Exhibits88: Chart on Graduation courses - Year-over-year growth 2024-2029 (%)
- Exhibits89: Data Table on Graduation courses - Year-over-year growth 2024-2029 (%)
- Exhibits90: Chart on Certifications and trainings - Market size and forecast 2024-2029 ($ billion)
- Exhibits91: Data Table on Certifications and trainings - Market size and forecast 2024-2029 ($ billion)
- Exhibits92: Chart on Certifications and trainings - Year-over-year growth 2024-2029 (%)
- Exhibits93: Data Table on Certifications and trainings - Year-over-year growth 2024-2029 (%)
- Exhibits94: Chart on Post graduate courses - Market size and forecast 2024-2029 ($ billion)
- Exhibits95: Data Table on Post graduate courses - Market size and forecast 2024-2029 ($ billion)
- Exhibits96: Chart on Post graduate courses - Year-over-year growth 2024-2029 (%)
- Exhibits97: Data Table on Post graduate courses - Year-over-year growth 2024-2029 (%)
- Exhibits98: Market opportunity by Type ($ billion)
- Exhibits99: Data Table on Market opportunity by Type ($ billion)
- Exhibits100: Analysis of price sensitivity, lifecycle, customer purchase basket, adoption rates, and purchase criteria
- Exhibits101: Chart on Market share By Geographical Landscape 2024-2029 (%)
- Exhibits102: Data Table on Market share By Geographical Landscape 2024-2029 (%)
- Exhibits103: Chart on Geographic comparison
- Exhibits104: Data Table on Geographic comparison
- Exhibits105: Chart on North America - Market size and forecast 2024-2029 ($ billion)
- Exhibits106: Data Table on North America - Market size and forecast 2024-2029 ($ billion)
- Exhibits107: Chart on North America - Year-over-year growth 2024-2029 (%)
- Exhibits108: Data Table on North America - Year-over-year growth 2024-2029 (%)
- Exhibits109: Chart on Europe - Market size and forecast 2024-2029 ($ billion)
- Exhibits110: Data Table on Europe - Market size and forecast 2024-2029 ($ billion)
- Exhibits111: Chart on Europe - Year-over-year growth 2024-2029 (%)
- Exhibits112: Data Table on Europe - Year-over-year growth 2024-2029 (%)
- Exhibits113: Chart on APAC - Market size and forecast 2024-2029 ($ billion)
- Exhibits114: Data Table on APAC - Market size and forecast 2024-2029 ($ billion)
- Exhibits115: Chart on APAC - Year-over-year growth 2024-2029 (%)
- Exhibits116: Data Table on APAC - Year-over-year growth 2024-2029 (%)
- Exhibits117: Chart on South America - Market size and forecast 2024-2029 ($ billion)
- Exhibits118: Data Table on South America - Market size and forecast 2024-2029 ($ billion)
- Exhibits119: Chart on South America - Year-over-year growth 2024-2029 (%)
- Exhibits120: Data Table on South America - Year-over-year growth 2024-2029 (%)
- Exhibits121: Chart on Middle East and Africa - Market size and forecast 2024-2029 ($ billion)
- Exhibits122: Data Table on Middle East and Africa - Market size and forecast 2024-2029 ($ billion)
- Exhibits123: Chart on Middle East and Africa - Year-over-year growth 2024-2029 (%)
- Exhibits124: Data Table on Middle East and Africa - Year-over-year growth 2024-2029 (%)
- Exhibits125: Chart on US - Market size and forecast 2024-2029 ($ billion)
- Exhibits126: Data Table on US - Market size and forecast 2024-2029 ($ billion)
- Exhibits127: Chart on US - Year-over-year growth 2024-2029 (%)
- Exhibits128: Data Table on US - Year-over-year growth 2024-2029 (%)
- Exhibits129: Chart on China - Market size and forecast 2024-2029 ($ billion)
- Exhibits130: Data Table on China - Market size and forecast 2024-2029 ($ billion)
- Exhibits131: Chart on China - Year-over-year growth 2024-2029 (%)
- Exhibits132: Data Table on China - Year-over-year growth 2024-2029 (%)
- Exhibits133: Chart on Canada - Market size and forecast 2024-2029 ($ billion)
- Exhibits134: Data Table on Canada - Market size and forecast 2024-2029 ($ billion)
- Exhibits135: Chart on Canada - Year-over-year growth 2024-2029 (%)
- Exhibits136: Data Table on Canada - Year-over-year growth 2024-2029 (%)
- Exhibits137: Chart on UK - Market size and forecast 2024-2029 ($ billion)
- Exhibits138: Data Table on UK - Market size and forecast 2024-2029 ($ billion)
- Exhibits139: Chart on UK - Year-over-year growth 2024-2029 (%)
- Exhibits140: Data Table on UK - Year-over-year growth 2024-2029 (%)
- Exhibits141: Chart on Germany - Market size and forecast 2024-2029 ($ billion)
- Exhibits142: Data Table on Germany - Market size and forecast 2024-2029 ($ billion)
- Exhibits143: Chart on Germany - Year-over-year growth 2024-2029 (%)
- Exhibits144: Data Table on Germany - Year-over-year growth 2024-2029 (%)
- Exhibits145: Chart on Italy - Market size and forecast 2024-2029 ($ billion)
- Exhibits146: Data Table on Italy - Market size and forecast 2024-2029 ($ billion)
- Exhibits147: Chart on Italy - Year-over-year growth 2024-2029 (%)
- Exhibits148: Data Table on Italy - Year-over-year growth 2024-2029 (%)
- Exhibits149: Chart on India - Market size and forecast 2024-2029 ($ billion)
- Exhibits150: Data Table on India - Market size and forecast 2024-2029 ($ billion)
- Exhibits151: Chart on India - Year-over-year growth 2024-2029 (%)
- Exhibits152: Data Table on India - Year-over-year growth 2024-2029 (%)
- Exhibits153: Chart on Brazil - Market size and forecast 2024-2029 ($ billion)
- Exhibits154: Data Table on Brazil - Market size and forecast 2024-2029 ($ billion)
- Exhibits155: Chart on Brazil - Year-over-year growth 2024-2029 (%)
- Exhibits156: Data Table on Brazil - Year-over-year growth 2024-2029 (%)
- Exhibits157: Chart on France - Market size and forecast 2024-2029 ($ billion)
- Exhibits158: Data Table on France - Market size and forecast 2024-2029 ($ billion)
- Exhibits159: Chart on France - Year-over-year growth 2024-2029 (%)
- Exhibits160: Data Table on France - Year-over-year growth 2024-2029 (%)
- Exhibits161: Chart on Japan - Market size and forecast 2024-2029 ($ billion)
- Exhibits162: Data Table on Japan - Market size and forecast 2024-2029 ($ billion)
- Exhibits163: Chart on Japan - Year-over-year growth 2024-2029 (%)
- Exhibits164: Data Table on Japan - Year-over-year growth 2024-2029 (%)
- Exhibits165: Market opportunity By Geographical Landscape ($ billion)
- Exhibits166: Data Tables on Market opportunity By Geographical Landscape ($ billion)
- Exhibits167: Impact of drivers and challenges in 2024 and 2029
- Exhibits168: Overview on criticality of inputs and factors of differentiation
- Exhibits169: Overview on factors of disruption
- Exhibits170: Impact of key risks on business
- Exhibits171: Companies covered
- Exhibits172: Company ranking index
- Exhibits173: Matrix on companies position and classification
- Exhibits174: Grand Canyon University - Overview
- Exhibits175: Grand Canyon University - Product / Service
- Exhibits176: Grand Canyon University - Key offerings
- Exhibits177: SWOT
- Exhibits178: Harvard Medical School - Overview
- Exhibits179: Harvard Medical School - Product / Service
- Exhibits180: Harvard Medical School - Key offerings
- Exhibits181: SWOT
- Exhibits182: Johns Hopkins University - Overview
- Exhibits183: Johns Hopkins University - Product / Service
- Exhibits184: Johns Hopkins University - Key offerings
- Exhibits185: SWOT
- Exhibits186: KP Bernard J. Tyson School of Medicine - Overview
- Exhibits187: KP Bernard J. Tyson School of Medicine - Product / Service
- Exhibits188: KP Bernard J. Tyson School of Medicine - Key offerings
- Exhibits189: SWOT
- Exhibits190: National University of Singapore - Overview
- Exhibits191: National University of Singapore - Product / Service
- Exhibits192: National University of Singapore - Key offerings
- Exhibits193: SWOT
- Exhibits194: New York University - Overview
- Exhibits195: New York University - Product / Service
- Exhibits196: New York University - Key offerings
- Exhibits197: SWOT
- Exhibits198: Stanford University - Overview
- Exhibits199: Stanford University - Product / Service
- Exhibits200: Stanford University - Key offerings
- Exhibits201: SWOT
- Exhibits202: The University of Alabama - Overview
- Exhibits203: The University of Alabama - Product / Service
- Exhibits204: The University of Alabama - Key offerings
- Exhibits205: SWOT
- Exhibits206: University of California - Overview
- Exhibits207: University of California - Product / Service
- Exhibits208: University of California - Key offerings
- Exhibits209: SWOT
- Exhibits210: University of Cambridge - Overview
- Exhibits211: University of Cambridge - Business segments
- Exhibits212: University of Cambridge - Key offerings
- Exhibits213: University of Cambridge - Segment focus
- Exhibits214: SWOT
- Exhibits215: University of Eastern Finland - Overview
- Exhibits216: University of Eastern Finland - Product / Service
- Exhibits217: University of Eastern Finland - Key offerings
- Exhibits218: SWOT
- Exhibits219: University of New England - Overview
- Exhibits220: University of New England - Product / Service
- Exhibits221: University of New England - Key offerings
- Exhibits222: SWOT
- Exhibits223: University of Oxford - Overview
- Exhibits224: University of Oxford - Product / Service
- Exhibits225: University of Oxford - Key offerings
- Exhibits226: SWOT
- Exhibits227: University of Washington - Overview
- Exhibits228: University of Washington - Product / Service
- Exhibits229: University of Washington - Key offerings
- Exhibits230: SWOT
- Exhibits231: Yale University - Overview
- Exhibits232: Yale University - Product / Service
- Exhibits233: Yale University - Key offerings
- Exhibits234: SWOT
- Exhibits235: Inclusions checklist
- Exhibits236: Exclusions checklist
- Exhibits237: Currency conversion rates for US$
- Exhibits238: Research methodology
- Exhibits239: Information sources
- Exhibits240: Data validation
- Exhibits241: Validation techniques employed for market sizing
- Exhibits242: Data synthesis
- Exhibits243: 360 degree market analysis
- Exhibits244: List of abbreviations
The medical education market is forecasted to grow by USD 294.5 billion during 2024-2029, accelerating at a CAGR of 18.4% during the forecast period. The report on the medical education market provides a holistic analysis, market size and forecast, trends, growth drivers, and challenges, as well as vendor analysis covering around 25 vendors.
The report offers an up-to-date analysis regarding the current market scenario, the latest trends and drivers, and the overall market environment. The market is driven by growth in number of online medical education programs, advent of visual technologies in medical education, and rise in organic growth through introduction of new medical courses and platforms.
| Market Scope | |
|---|---|
| Base Year | 2025 |
| End Year | 2029 |
| Series Year | 2025-2029 |
| Growth Momentum | Accelerate |
| YOY 2025 | 16.3% |
| CAGR | 18.4% |
| Incremental Value | $294.5 bn |
The study was conducted using an objective combination of primary and secondary information including inputs from key participants in the industry. The report contains a comprehensive market size data, segment with regional analysis and vendor landscape in addition to an analysis of the key companies. Reports have historic and forecast data.
Technavio's medical education market is segmented as below:
By Courses
- Cardiothoracic
- Neurology
- Orthopedic
- Oral and maxillofacial
- Others
By Delivery
- On-campus
- Online
- Distance
By Type
- Graduation courses
- Certifications and trainings
- Post graduate courses
By Geographical Landscape
- North America
- Europe
- APAC
- South America
- Middle East and Africa
This study identifies the gamification in medical education as one of the prime reasons driving the medical education market growth during the next few years. Also, increase in partnerships between medical universities and associations and growing popularity of microlearning in medical education will lead to sizable demand in the market.
The report on the medical education market covers the following areas:
- Medical Education Market sizing
- Medical Education Market forecast
- Medical Education Market industry analysis
The robust vendor analysis is designed to help clients improve their market position, and in line with this, this report provides a detailed analysis of several leading medical education market vendors that include Alison, All India Institute of Medical Sciences, Grand Canyon University, Harvard Medical School, Johns Hopkins University, Kaiser Foundation Health Plan Inc., KP Bernard J. Tyson School of Medicine, Mayo Foundation for Medical Education and Research, National University of Singapore, New York University, Omnicuris, Stanford University, The University of Alabama, THE UNIVERSITY OF BRITISH COLUMBIA, TTUHSC, University of California, University of Cambridge, University of Eastern Finland, University of Liverpool, University of New England, University of Oslo, University of Oxford, University of Stavanger, University of Washington, Western Governors University, Yale University, and Zimmer Biomet Holdings Inc.. Also, the medical education market analysis report includes information on upcoming trends and challenges that will influence market growth. This is to help companies strategize and leverage all forthcoming growth opportunities.
The publisher presents a detailed picture of the market by the way of study, synthesis, and summation of data from multiple sources by an analysis of key parameters such as profit, pricing, competition, and promotions. It presents various market facets by identifying the key industry influencers. The data presented is comprehensive, reliable, and a result of extensive primary and secondary research. The market research reports provide a complete competitive landscape and an in-depth vendor selection methodology and analysis using qualitative and quantitative research to forecast accurate market growth.
Table of Contents
1 Executive Summary
- 1.1 Market overview
- Executive Summary - Chart on Market Overview
- Executive Summary - Data Table on Market Overview
- Executive Summary - Chart on Global Market Characteristics
- Executive Summary - Chart on Market By Geographical Landscape
- Executive Summary - Chart on Market Segmentation by Courses
- Executive Summary - Chart on Market Segmentation by Delivery
- Executive Summary - Chart on Market Segmentation by Type
- Executive Summary - Chart on Incremental Growth
- Executive Summary - Data Table on Incremental Growth
- Executive Summary - Chart on Company Market Positioning
2 Technavio Analysis
- 2.1 Analysis of price sensitivity, lifecycle, customer purchase basket, adoption rates, and purchase criteria
- Analysis of price sensitivity, lifecycle, customer purchase basket, adoption rates, and purchase criteria
- 2.2 Criticality of inputs and Factors of differentiation
- Overview on criticality of inputs and factors of differentiation
- 2.3 Factors of disruption
- Overview on factors of disruption
- 2.4 Impact of drivers and challenges
- Impact of drivers and challenges in 2024 and 2029
3 Market Landscape
- 3.1 Market ecosystem
- Parent Market
- Data Table on - Parent Market
- 3.2 Market characteristics
- Market characteristics analysis
- 3.3 Value chain analysis
- Value chain analysis
4 Market Sizing
- 4.1 Market definition
- Offerings of companies included in the market definition
- 4.2 Market segment analysis
- Market segments
- 4.3 Market size 2024
- 4.4 Market outlook: Forecast for 2024-2029
- Chart on Global - Market size and forecast 2024-2029 ($ billion)
- Data Table on Global - Market size and forecast 2024-2029 ($ billion)
- Chart on Global Market: Year-over-year growth 2024-2029 (%)
- Data Table on Global Market: Year-over-year growth 2024-2029 (%)
5 Historic Market Size
- 5.1 Global Medical Education Market 2019 - 2023
- Historic Market Size - Data Table on Global Medical Education Market 2019 - 2023 ($ billion)
- 5.2 Courses segment analysis 2019 - 2023
- Historic Market Size - Courses Segment 2019 - 2023 ($ billion)
- 5.3 Delivery segment analysis 2019 - 2023
- Historic Market Size - Delivery Segment 2019 - 2023 ($ billion)
- 5.4 Type segment analysis 2019 - 2023
- Historic Market Size - Type Segment 2019 - 2023 ($ billion)
- 5.5 Geography segment analysis 2019 - 2023
- Historic Market Size - Geography Segment 2019 - 2023 ($ billion)
- 5.6 Country segment analysis 2019 - 2023
- Historic Market Size - Country Segment 2019 - 2023 ($ billion)
6 Qualitative Analysis
- 6.1 The AI impact on Global Medical Education Market
7 Five Forces Analysis
- 7.1 Five forces summary
- Five forces analysis - Comparison between 2024 and 2029
- 7.2 Bargaining power of buyers
- Bargaining power of buyers - Impact of key factors 2024 and 2029
- 7.3 Bargaining power of suppliers
- Bargaining power of suppliers - Impact of key factors in 2024 and 2029
- 7.4 Threat of new entrants
- Threat of new entrants - Impact of key factors in 2024 and 2029
- 7.5 Threat of substitutes
- Threat of substitutes - Impact of key factors in 2024 and 2029
- 7.6 Threat of rivalry
- Threat of rivalry - Impact of key factors in 2024 and 2029
- 7.7 Market condition
- Chart on Market condition - Five forces 2024 and 2029
8 Market Segmentation by Courses
- 8.1 Market segments
- Chart on Courses - Market share 2024-2029 (%)
- Data Table on Courses - Market share 2024-2029 (%)
- 8.2 Comparison by Courses
- Chart on Comparison by Courses
- Data Table on Comparison by Courses
- 8.3 Cardiothoracic - Market size and forecast 2024-2029
- Chart on Cardiothoracic - Market size and forecast 2024-2029 ($ billion)
- Data Table on Cardiothoracic - Market size and forecast 2024-2029 ($ billion)
- Chart on Cardiothoracic - Year-over-year growth 2024-2029 (%)
- Data Table on Cardiothoracic - Year-over-year growth 2024-2029 (%)
- 8.4 Neurology - Market size and forecast 2024-2029
- Chart on Neurology - Market size and forecast 2024-2029 ($ billion)
- Data Table on Neurology - Market size and forecast 2024-2029 ($ billion)
- Chart on Neurology - Year-over-year growth 2024-2029 (%)
- Data Table on Neurology - Year-over-year growth 2024-2029 (%)
- 8.5 Orthopedic - Market size and forecast 2024-2029
- Chart on Orthopedic - Market size and forecast 2024-2029 ($ billion)
- Data Table on Orthopedic - Market size and forecast 2024-2029 ($ billion)
- Chart on Orthopedic - Year-over-year growth 2024-2029 (%)
- Data Table on Orthopedic - Year-over-year growth 2024-2029 (%)
- 8.6 Oral and maxillofacial - Market size and forecast 2024-2029
- Chart on Oral and maxillofacial - Market size and forecast 2024-2029 ($ billion)
- Data Table on Oral and maxillofacial - Market size and forecast 2024-2029 ($ billion)
- Chart on Oral and maxillofacial - Year-over-year growth 2024-2029 (%)
- Data Table on Oral and maxillofacial - Year-over-year growth 2024-2029 (%)
- 8.7 Others - Market size and forecast 2024-2029
- Chart on Others - Market size and forecast 2024-2029 ($ billion)
- Data Table on Others - Market size and forecast 2024-2029 ($ billion)
- Chart on Others - Year-over-year growth 2024-2029 (%)
- Data Table on Others - Year-over-year growth 2024-2029 (%)
- 8.8 Market opportunity by Courses
- Market opportunity by Courses ($ billion)
- Data Table on Market opportunity by Courses ($ billion)
9 Market Segmentation by Delivery
- 9.1 Market segments
- Chart on Delivery - Market share 2024-2029 (%)
- Data Table on Delivery - Market share 2024-2029 (%)
- 9.2 Comparison by Delivery
- Chart on Comparison by Delivery
- Data Table on Comparison by Delivery
- 9.3 On-campus - Market size and forecast 2024-2029
- Chart on On-campus - Market size and forecast 2024-2029 ($ billion)
- Data Table on On-campus - Market size and forecast 2024-2029 ($ billion)
- Chart on On-campus - Year-over-year growth 2024-2029 (%)
- Data Table on On-campus - Year-over-year growth 2024-2029 (%)
- 9.4 Online - Market size and forecast 2024-2029
- Chart on Online - Market size and forecast 2024-2029 ($ billion)
- Data Table on Online - Market size and forecast 2024-2029 ($ billion)
- Chart on Online - Year-over-year growth 2024-2029 (%)
- Data Table on Online - Year-over-year growth 2024-2029 (%)
- 9.5 Distance - Market size and forecast 2024-2029
- Chart on Distance - Market size and forecast 2024-2029 ($ billion)
- Data Table on Distance - Market size and forecast 2024-2029 ($ billion)
- Chart on Distance - Year-over-year growth 2024-2029 (%)
- Data Table on Distance - Year-over-year growth 2024-2029 (%)
- 9.6 Market opportunity by Delivery
- Market opportunity by Delivery ($ billion)
- Data Table on Market opportunity by Delivery ($ billion)
10 Market Segmentation by Type
- 10.1 Market segments
- Chart on Type - Market share 2024-2029 (%)
- Data Table on Type - Market share 2024-2029 (%)
- 10.2 Comparison by Type
- Chart on Comparison by Type
- Data Table on Comparison by Type
- 10.3 Graduation courses - Market size and forecast 2024-2029
- Chart on Graduation courses - Market size and forecast 2024-2029 ($ billion)
- Data Table on Graduation courses - Market size and forecast 2024-2029 ($ billion)
- Chart on Graduation courses - Year-over-year growth 2024-2029 (%)
- Data Table on Graduation courses - Year-over-year growth 2024-2029 (%)
- 10.4 Certifications and trainings - Market size and forecast 2024-2029
- Chart on Certifications and trainings - Market size and forecast 2024-2029 ($ billion)
- Data Table on Certifications and trainings - Market size and forecast 2024-2029 ($ billion)
- Chart on Certifications and trainings - Year-over-year growth 2024-2029 (%)
- Data Table on Certifications and trainings - Year-over-year growth 2024-2029 (%)
- 10.5 Post graduate courses - Market size and forecast 2024-2029
- Chart on Post graduate courses - Market size and forecast 2024-2029 ($ billion)
- Data Table on Post graduate courses - Market size and forecast 2024-2029 ($ billion)
- Chart on Post graduate courses - Year-over-year growth 2024-2029 (%)
- Data Table on Post graduate courses - Year-over-year growth 2024-2029 (%)
- 10.6 Market opportunity by Type
- Market opportunity by Type ($ billion)
- Data Table on Market opportunity by Type ($ billion)
11 Customer Landscape
- 11.1 Customer landscape overview
- Analysis of price sensitivity, lifecycle, customer purchase basket, adoption rates, and purchase criteria
12 Geographic Landscape
- 12.1 Geographic segmentation
- Chart on Market share By Geographical Landscape 2024-2029 (%)
- Data Table on Market share By Geographical Landscape 2024-2029 (%)
- 12.2 Geographic comparison
- Chart on Geographic comparison
- Data Table on Geographic comparison
- 12.3 North America - Market size and forecast 2024-2029
- Chart on North America - Market size and forecast 2024-2029 ($ billion)
- Data Table on North America - Market size and forecast 2024-2029 ($ billion)
- Chart on North America - Year-over-year growth 2024-2029 (%)
- Data Table on North America - Year-over-year growth 2024-2029 (%)
- 12.4 Europe - Market size and forecast 2024-2029
- Chart on Europe - Market size and forecast 2024-2029 ($ billion)
- Data Table on Europe - Market size and forecast 2024-2029 ($ billion)
- Chart on Europe - Year-over-year growth 2024-2029 (%)
- Data Table on Europe - Year-over-year growth 2024-2029 (%)
- 12.5 APAC - Market size and forecast 2024-2029
- Chart on APAC - Market size and forecast 2024-2029 ($ billion)
- Data Table on APAC - Market size and forecast 2024-2029 ($ billion)
- Chart on APAC - Year-over-year growth 2024-2029 (%)
- Data Table on APAC - Year-over-year growth 2024-2029 (%)
- 12.6 South America - Market size and forecast 2024-2029
- Chart on South America - Market size and forecast 2024-2029 ($ billion)
- Data Table on South America - Market size and forecast 2024-2029 ($ billion)
- Chart on South America - Year-over-year growth 2024-2029 (%)
- Data Table on South America - Year-over-year growth 2024-2029 (%)
- 12.7 Middle East and Africa - Market size and forecast 2024-2029
- Chart on Middle East and Africa - Market size and forecast 2024-2029 ($ billion)
- Data Table on Middle East and Africa - Market size and forecast 2024-2029 ($ billion)
- Chart on Middle East and Africa - Year-over-year growth 2024-2029 (%)
- Data Table on Middle East and Africa - Year-over-year growth 2024-2029 (%)
- 12.8 US - Market size and forecast 2024-2029
- Chart on US - Market size and forecast 2024-2029 ($ billion)
- Data Table on US - Market size and forecast 2024-2029 ($ billion)
- Chart on US - Year-over-year growth 2024-2029 (%)
- Data Table on US - Year-over-year growth 2024-2029 (%)
- 12.9 China - Market size and forecast 2024-2029
- Chart on China - Market size and forecast 2024-2029 ($ billion)
- Data Table on China - Market size and forecast 2024-2029 ($ billion)
- Chart on China - Year-over-year growth 2024-2029 (%)
- Data Table on China - Year-over-year growth 2024-2029 (%)
- 12.10 Canada - Market size and forecast 2024-2029
- Chart on Canada - Market size and forecast 2024-2029 ($ billion)
- Data Table on Canada - Market size and forecast 2024-2029 ($ billion)
- Chart on Canada - Year-over-year growth 2024-2029 (%)
- Data Table on Canada - Year-over-year growth 2024-2029 (%)
- 12.11 UK - Market size and forecast 2024-2029
- Chart on UK - Market size and forecast 2024-2029 ($ billion)
- Data Table on UK - Market size and forecast 2024-2029 ($ billion)
- Chart on UK - Year-over-year growth 2024-2029 (%)
- Data Table on UK - Year-over-year growth 2024-2029 (%)
- 12.12 Germany - Market size and forecast 2024-2029
- Chart on Germany - Market size and forecast 2024-2029 ($ billion)
- Data Table on Germany - Market size and forecast 2024-2029 ($ billion)
- Chart on Germany - Year-over-year growth 2024-2029 (%)
- Data Table on Germany - Year-over-year growth 2024-2029 (%)
- 12.13 Italy - Market size and forecast 2024-2029
- Chart on Italy - Market size and forecast 2024-2029 ($ billion)
- Data Table on Italy - Market size and forecast 2024-2029 ($ billion)
- Chart on Italy - Year-over-year growth 2024-2029 (%)
- Data Table on Italy - Year-over-year growth 2024-2029 (%)
- 12.14 India - Market size and forecast 2024-2029
- Chart on India - Market size and forecast 2024-2029 ($ billion)
- Data Table on India - Market size and forecast 2024-2029 ($ billion)
- Chart on India - Year-over-year growth 2024-2029 (%)
- Data Table on India - Year-over-year growth 2024-2029 (%)
- 12.15 Brazil - Market size and forecast 2024-2029
- Chart on Brazil - Market size and forecast 2024-2029 ($ billion)
- Data Table on Brazil - Market size and forecast 2024-2029 ($ billion)
- Chart on Brazil - Year-over-year growth 2024-2029 (%)
- Data Table on Brazil - Year-over-year growth 2024-2029 (%)
- 12.16 France - Market size and forecast 2024-2029
- Chart on France - Market size and forecast 2024-2029 ($ billion)
- Data Table on France - Market size and forecast 2024-2029 ($ billion)
- Chart on France - Year-over-year growth 2024-2029 (%)
- Data Table on France - Year-over-year growth 2024-2029 (%)
- 12.17 Japan - Market size and forecast 2024-2029
- Chart on Japan - Market size and forecast 2024-2029 ($ billion)
- Data Table on Japan - Market size and forecast 2024-2029 ($ billion)
- Chart on Japan - Year-over-year growth 2024-2029 (%)
- Data Table on Japan - Year-over-year growth 2024-2029 (%)
- 12.18 Market opportunity By Geographical Landscape
- Market opportunity By Geographical Landscape ($ billion)
- Data Tables on Market opportunity By Geographical Landscape ($ billion)
13 Drivers, Challenges, and Opportunity/Restraints
- 13.1 Market drivers
- 13.2 Market challenges
- 13.3 Impact of drivers and challenges
- Impact of drivers and challenges in 2024 and 2029
- 13.4 Market opportunities/restraints
14 Competitive Landscape
- 14.1 Overview
- 14.2 Competitive Landscape
- Overview on criticality of inputs and factors of differentiation
- 14.3 Landscape disruption
- Overview on factors of disruption
- 14.4 Industry risks
- Impact of key risks on business
15 Competitive Analysis
- 15.1 Companies profiled
- Companies covered
- 15.2 Company ranking index
- Company ranking index
- 15.3 Market positioning of companies
- Matrix on companies position and classification
- 15.4 Grand Canyon University
- Grand Canyon University - Overview
- Grand Canyon University - Product / Service
- Grand Canyon University - Key offerings
- SWOT
- 15.5 Harvard Medical School
- Harvard Medical School - Overview
- Harvard Medical School - Product / Service
- Harvard Medical School - Key offerings
- SWOT
- 15.6 Johns Hopkins University
- Johns Hopkins University - Overview
- Johns Hopkins University - Product / Service
- Johns Hopkins University - Key offerings
- SWOT
- 15.7 KP Bernard J. Tyson School of Medicine
- KP Bernard J. Tyson School of Medicine - Overview
- KP Bernard J. Tyson School of Medicine - Product / Service
- KP Bernard J. Tyson School of Medicine - Key offerings
- SWOT
- 15.8 National University of Singapore
- National University of Singapore - Overview
- National University of Singapore - Product / Service
- National University of Singapore - Key offerings
- SWOT
- 15.9 New York University
- New York University - Overview
- New York University - Product / Service
- New York University - Key offerings
- SWOT
- 15.10 Stanford University
- Stanford University - Overview
- Stanford University - Product / Service
- Stanford University - Key offerings
- SWOT
- 15.11 The University of Alabama
- The University of Alabama - Overview
- The University of Alabama - Product / Service
- The University of Alabama - Key offerings
- SWOT
- 15.12 University of California
- University of California - Overview
- University of California - Product / Service
- University of California - Key offerings
- SWOT
- 15.13 University of Cambridge
- University of Cambridge - Overview
- University of Cambridge - Business segments
- University of Cambridge - Key offerings
- University of Cambridge - Segment focus
- SWOT
- 15.14 University of Eastern Finland
- University of Eastern Finland - Overview
- University of Eastern Finland - Product / Service
- University of Eastern Finland - Key offerings
- SWOT
- 15.15 University of New England
- University of New England - Overview
- University of New England - Product / Service
- University of New England - Key offerings
- SWOT
- 15.16 University of Oxford
- University of Oxford - Overview
- University of Oxford - Product / Service
- University of Oxford - Key offerings
- SWOT
- 15.17 University of Washington
- University of Washington - Overview
- University of Washington - Product / Service
- University of Washington - Key offerings
- SWOT
- 15.18 Yale University
- Yale University - Overview
- Yale University - Product / Service
- Yale University - Key offerings
- SWOT
16 Appendix
- 16.1 Scope of the report
- 16.2 Inclusions and exclusions checklist
- Inclusions checklist
- Exclusions checklist
- 16.3 Currency conversion rates for US$
- Currency conversion rates for US$
- 16.4 Research methodology
- Research methodology
- 16.5 Data procurement
- Information sources
- 16.6 Data validation
- Data validation
- 16.7 Validation techniques employed for market sizing
- Validation techniques employed for market sizing
- 16.8 Data synthesis
- Data synthesis
- 16.9 360 degree market analysis
- 360 degree market analysis
- 16.10 List of abbreviations
- List of abbreviations

