|
|
市場調査レポート
商品コード
1645400
K-12試験・評価の世界市場 (2025~2029年)Global K-12 Testing and Assessment Market 2025-2029 |
||||||

|
|||||||
カスタマイズ可能
|
|||||||


| K-12試験・評価の世界市場 (2025~2029年) |
|
出版日: 2025年01月09日
発行: TechNavio
ページ情報: 英文 201 Pages
納期: 即納可能
|

全表示
- 概要
- 図表
- 目次
K-12試験・評価市場は2024~2029年に145億8,390万米ドル、予測期間中のCAGRは12.2%で成長すると予測されます。
当レポートでは、K-12試験・評価市場の全体的な分析、市場規模・予測、動向、成長促進要因、課題、約25のベンダーを網羅したベンダー分析などを掲載しています。
現在の市場シナリオ、最新動向と促進要因、市場環境全体に関する最新分析を提供しています。市場は、アナリティクスの利用の増加、学習管理システムの機運の高まり、K-12試験・評価における政府の介入の高まりによって牽引されています。
| 市場範囲 | |
|---|---|
| 基準年 | 2025年 |
| 終了年 | 2029年 |
| 予測期間 | 2025~2029年 |
| 成長モメンタム | 加速 |
| 前年比2025年 | 10.2% |
| CAGR | 12.2% |
| 増分額 | 145億8,390万米ドル |
本調査では、今後数年間のK-12試験・評価市場の成長を促進する主な要因の1つとして、形成的学習ツールを重視する傾向が強まっていることを挙げています。また、クラウドコンピューティングの台頭や、評価のためのゲーム利用の拡大も、市場の大きな需要につながると思われます。
目次
第1章 エグゼクティブサマリー
- 市場概要
第2章 Technavioの分析
- 価格感度・ライフサイクル・顧客購入バスケット・採用率・購入基準の分析
- インプットの重要性と差別化の要因
- ディスラプションの要因
- 促進要因と課題の影響
第3章 市場情勢
- 市場エコシステム
- 市場の特徴
- バリューチェーン分析
第4章 市場規模
- 市場の定義
- 市場セグメント分析
- 市場規模 (2024年)
- 市場展望 (2024~2029年)
第5章 市場規模実績
- K-12試験・評価の世界市場 (2019~2023年)
- 製品別セグメント分析 (2019~2023年)
- 方法別セグメント分析 (2019~2023年)
- 地域別セグメント分析 (2019~2023年)
- 国別セグメント分析 (2019~2023年)
第6章 定性分析
- AIの影響:K-12試験・評価の世界市場
第7章 ファイブフォース分析
- ファイブフォースの要約
- 買い手の交渉力
- 供給企業の交渉力
- 新規参入業者の脅威
- 代替品の脅威
- 競争の脅威
- 市況
第8章 市場セグメンテーション:製品別
- 市場セグメント
- 比較:製品別
- カリキュラムベースの試験:市場規模と予測 (2024~2029年)
- カリキュラムに基づかない試験:市場規模と予測 (2024~2029年)
- 市場機会:製品別
第9章 市場セグメンテーション:方法別
- 市場セグメント
- 比較:方法別
- ブレンド方式:市場規模と予測 (2024~2029年)
- オンライン方式:市場規模と予測 (2024~2029年)
- 伝統的方式:市場規模と予測 (2024~2029年)
- 市場機会:方法別
第10章 顧客情勢
- 顧客情勢の概要
第11章 地域別情勢
- 地域別セグメンテーション
- 地域別比較
- 北米:市場規模と予測 (2024~2029年)
- 欧州:市場規模と予測 (2024~2029年)
- アジア太平洋:市場規模と予測 (2024~2029年)
- 南米:市場規模と予測 (2024~2029年)
- 中東・アフリカ:市場規模と予測 (2024~2029年)
- 米国:市場規模と予測 (2024~2029年)
- 中国:市場規模と予測 (2024~2029年)
- 英国:市場規模と予測 (2024~2029年)
- ドイツ:市場規模と予測 (2024~2029年)
- カナダ:市場規模と予測 (2024~2029年)
- インド:市場規模と予測 (2024~2029年)
- ブラジル:市場規模と予測 (2024~2029年)
- フランス:市場規模と予測 (2024~2029年)
- イタリア:市場規模と予測 (2024~2029年)
- 日本:市場規模と予測 (2024~2029年)
- 市場機会:地域情勢別
第12章 促進要因・課題・機会・抑制要因
- 市場促進要因
- 市場の課題
- 促進要因と課題の影響
- 市場の機会・抑制要因
第13章 競合情勢
- 概要
- 競合情勢
- ディスラプションの状況
- 業界のリスク
第14章 競合分析
- 企業プロファイル
- 企業ランキング指数
- 企業の市場ポジショニング
- Anthology Inc.
- Batia Infotech
- CogniFit Inc.
- Coursera Inc.
- D2L Inc.
- Educational Testing Service
- Edutech
- Houghton Mifflin Harcourt Co.
- Instructure Holdings Inc.
- John Wiley and Sons Inc.
- MeritTrac Services Pvt Ltd.
- NIIT Ltd.
- Oxford University Press
- Pearson Plc
- Sylvan Learning LLC
第15章 付録
Exhibits:
- Exhibits1: Executive Summary - Chart on Market Overview
- Exhibits2: Executive Summary - Data Table on Market Overview
- Exhibits3: Executive Summary - Chart on Global Market Characteristics
- Exhibits4: Executive Summary - Chart on Market By Geographical Landscape
- Exhibits5: Executive Summary - Chart on Market Segmentation by Product
- Exhibits6: Executive Summary - Chart on Market Segmentation by Method
- Exhibits7: Executive Summary - Chart on Incremental Growth
- Exhibits8: Executive Summary - Data Table on Incremental Growth
- Exhibits9: Executive Summary - Chart on Company Market Positioning
- Exhibits10: Analysis of price sensitivity, lifecycle, customer purchase basket, adoption rates, and purchase criteria
- Exhibits11: Overview on criticality of inputs and factors of differentiation
- Exhibits12: Overview on factors of disruption
- Exhibits13: Impact of drivers and challenges in 2024 and 2029
- Exhibits14: Parent Market
- Exhibits15: Data Table on - Parent Market
- Exhibits16: Market characteristics analysis
- Exhibits17: Value chain analysis
- Exhibits18: Offerings of companies included in the market definition
- Exhibits19: Market segments
- Exhibits20: Chart on Global - Market size and forecast 2024-2029 ($ million)
- Exhibits21: Data Table on Global - Market size and forecast 2024-2029 ($ million)
- Exhibits22: Chart on Global Market: Year-over-year growth 2024-2029 (%)
- Exhibits23: Data Table on Global Market: Year-over-year growth 2024-2029 (%)
- Exhibits24: Historic Market Size - Data Table on Global K-12 Testing And Assessment Market 2019 - 2023 ($ million)
- Exhibits25: Historic Market Size - Product Segment 2019 - 2023 ($ million)
- Exhibits26: Historic Market Size - Method Segment 2019 - 2023 ($ million)
- Exhibits27: Historic Market Size - Geography Segment 2019 - 2023 ($ million)
- Exhibits28: Historic Market Size - Country Segment 2019 - 2023 ($ million)
- Exhibits29: Five forces analysis - Comparison between 2024 and 2029
- Exhibits30: Bargaining power of buyers - Impact of key factors 2024 and 2029
- Exhibits31: Bargaining power of suppliers - Impact of key factors in 2024 and 2029
- Exhibits32: Threat of new entrants - Impact of key factors in 2024 and 2029
- Exhibits33: Threat of substitutes - Impact of key factors in 2024 and 2029
- Exhibits34: Threat of rivalry - Impact of key factors in 2024 and 2029
- Exhibits35: Chart on Market condition - Five forces 2024 and 2029
- Exhibits36: Chart on Product - Market share 2024-2029 (%)
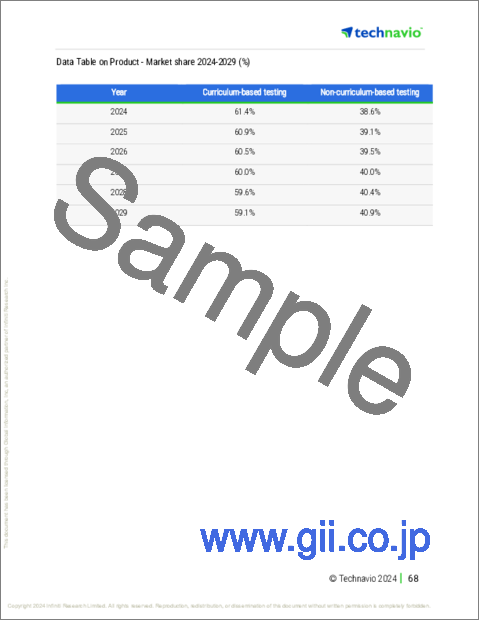
- Exhibits37: Data Table on Product - Market share 2024-2029 (%)
- Exhibits38: Chart on Comparison by Product
- Exhibits39: Data Table on Comparison by Product
- Exhibits40: Chart on Curriculum-based testing - Market size and forecast 2024-2029 ($ million)
- Exhibits41: Data Table on Curriculum-based testing - Market size and forecast 2024-2029 ($ million)
- Exhibits42: Chart on Curriculum-based testing - Year-over-year growth 2024-2029 (%)
- Exhibits43: Data Table on Curriculum-based testing - Year-over-year growth 2024-2029 (%)
- Exhibits44: Chart on Non-curriculum-based testing - Market size and forecast 2024-2029 ($ million)
- Exhibits45: Data Table on Non-curriculum-based testing - Market size and forecast 2024-2029 ($ million)
- Exhibits46: Chart on Non-curriculum-based testing - Year-over-year growth 2024-2029 (%)
- Exhibits47: Data Table on Non-curriculum-based testing - Year-over-year growth 2024-2029 (%)
- Exhibits48: Market opportunity by Product ($ million)
- Exhibits49: Data Table on Market opportunity by Product ($ million)
- Exhibits50: Chart on Method - Market share 2024-2029 (%)
- Exhibits51: Data Table on Method - Market share 2024-2029 (%)
- Exhibits52: Chart on Comparison by Method
- Exhibits53: Data Table on Comparison by Method
- Exhibits54: Chart on Blended method - Market size and forecast 2024-2029 ($ million)
- Exhibits55: Data Table on Blended method - Market size and forecast 2024-2029 ($ million)
- Exhibits56: Chart on Blended method - Year-over-year growth 2024-2029 (%)
- Exhibits57: Data Table on Blended method - Year-over-year growth 2024-2029 (%)
- Exhibits58: Chart on Online method - Market size and forecast 2024-2029 ($ million)
- Exhibits59: Data Table on Online method - Market size and forecast 2024-2029 ($ million)
- Exhibits60: Chart on Online method - Year-over-year growth 2024-2029 (%)
- Exhibits61: Data Table on Online method - Year-over-year growth 2024-2029 (%)
- Exhibits62: Chart on Traditional method - Market size and forecast 2024-2029 ($ million)
- Exhibits63: Data Table on Traditional method - Market size and forecast 2024-2029 ($ million)
- Exhibits64: Chart on Traditional method - Year-over-year growth 2024-2029 (%)
- Exhibits65: Data Table on Traditional method - Year-over-year growth 2024-2029 (%)
- Exhibits66: Market opportunity by Method ($ million)
- Exhibits67: Data Table on Market opportunity by Method ($ million)
- Exhibits68: Analysis of price sensitivity, lifecycle, customer purchase basket, adoption rates, and purchase criteria
- Exhibits69: Chart on Market share By Geographical Landscape 2024-2029 (%)
- Exhibits70: Data Table on Market share By Geographical Landscape 2024-2029 (%)
- Exhibits71: Chart on Geographic comparison
- Exhibits72: Data Table on Geographic comparison
- Exhibits73: Chart on North America - Market size and forecast 2024-2029 ($ million)
- Exhibits74: Data Table on North America - Market size and forecast 2024-2029 ($ million)
- Exhibits75: Chart on North America - Year-over-year growth 2024-2029 (%)
- Exhibits76: Data Table on North America - Year-over-year growth 2024-2029 (%)
- Exhibits77: Chart on Europe - Market size and forecast 2024-2029 ($ million)
- Exhibits78: Data Table on Europe - Market size and forecast 2024-2029 ($ million)
- Exhibits79: Chart on Europe - Year-over-year growth 2024-2029 (%)
- Exhibits80: Data Table on Europe - Year-over-year growth 2024-2029 (%)
- Exhibits81: Chart on APAC - Market size and forecast 2024-2029 ($ million)
- Exhibits82: Data Table on APAC - Market size and forecast 2024-2029 ($ million)
- Exhibits83: Chart on APAC - Year-over-year growth 2024-2029 (%)
- Exhibits84: Data Table on APAC - Year-over-year growth 2024-2029 (%)
- Exhibits85: Chart on South America - Market size and forecast 2024-2029 ($ million)
- Exhibits86: Data Table on South America - Market size and forecast 2024-2029 ($ million)
- Exhibits87: Chart on South America - Year-over-year growth 2024-2029 (%)
- Exhibits88: Data Table on South America - Year-over-year growth 2024-2029 (%)
- Exhibits89: Chart on Middle East and Africa - Market size and forecast 2024-2029 ($ million)
- Exhibits90: Data Table on Middle East and Africa - Market size and forecast 2024-2029 ($ million)
- Exhibits91: Chart on Middle East and Africa - Year-over-year growth 2024-2029 (%)
- Exhibits92: Data Table on Middle East and Africa - Year-over-year growth 2024-2029 (%)
- Exhibits93: Chart on US - Market size and forecast 2024-2029 ($ million)
- Exhibits94: Data Table on US - Market size and forecast 2024-2029 ($ million)
- Exhibits95: Chart on US - Year-over-year growth 2024-2029 (%)
- Exhibits96: Data Table on US - Year-over-year growth 2024-2029 (%)
- Exhibits97: Chart on China - Market size and forecast 2024-2029 ($ million)
- Exhibits98: Data Table on China - Market size and forecast 2024-2029 ($ million)
- Exhibits99: Chart on China - Year-over-year growth 2024-2029 (%)
- Exhibits100: Data Table on China - Year-over-year growth 2024-2029 (%)
- Exhibits101: Chart on UK - Market size and forecast 2024-2029 ($ million)
- Exhibits102: Data Table on UK - Market size and forecast 2024-2029 ($ million)
- Exhibits103: Chart on UK - Year-over-year growth 2024-2029 (%)
- Exhibits104: Data Table on UK - Year-over-year growth 2024-2029 (%)
- Exhibits105: Chart on Germany - Market size and forecast 2024-2029 ($ million)
- Exhibits106: Data Table on Germany - Market size and forecast 2024-2029 ($ million)
- Exhibits107: Chart on Germany - Year-over-year growth 2024-2029 (%)
- Exhibits108: Data Table on Germany - Year-over-year growth 2024-2029 (%)
- Exhibits109: Chart on Canada - Market size and forecast 2024-2029 ($ million)
- Exhibits110: Data Table on Canada - Market size and forecast 2024-2029 ($ million)
- Exhibits111: Chart on Canada - Year-over-year growth 2024-2029 (%)
- Exhibits112: Data Table on Canada - Year-over-year growth 2024-2029 (%)
- Exhibits113: Chart on India - Market size and forecast 2024-2029 ($ million)
- Exhibits114: Data Table on India - Market size and forecast 2024-2029 ($ million)
- Exhibits115: Chart on India - Year-over-year growth 2024-2029 (%)
- Exhibits116: Data Table on India - Year-over-year growth 2024-2029 (%)
- Exhibits117: Chart on Brazil - Market size and forecast 2024-2029 ($ million)
- Exhibits118: Data Table on Brazil - Market size and forecast 2024-2029 ($ million)
- Exhibits119: Chart on Brazil - Year-over-year growth 2024-2029 (%)
- Exhibits120: Data Table on Brazil - Year-over-year growth 2024-2029 (%)
- Exhibits121: Chart on France - Market size and forecast 2024-2029 ($ million)
- Exhibits122: Data Table on France - Market size and forecast 2024-2029 ($ million)
- Exhibits123: Chart on France - Year-over-year growth 2024-2029 (%)
- Exhibits124: Data Table on France - Year-over-year growth 2024-2029 (%)
- Exhibits125: Chart on Italy - Market size and forecast 2024-2029 ($ million)
- Exhibits126: Data Table on Italy - Market size and forecast 2024-2029 ($ million)
- Exhibits127: Chart on Italy - Year-over-year growth 2024-2029 (%)
- Exhibits128: Data Table on Italy - Year-over-year growth 2024-2029 (%)
- Exhibits129: Chart on Japan - Market size and forecast 2024-2029 ($ million)
- Exhibits130: Data Table on Japan - Market size and forecast 2024-2029 ($ million)
- Exhibits131: Chart on Japan - Year-over-year growth 2024-2029 (%)
- Exhibits132: Data Table on Japan - Year-over-year growth 2024-2029 (%)
- Exhibits133: Market opportunity By Geographical Landscape ($ million)
- Exhibits134: Data Tables on Market opportunity By Geographical Landscape ($ million)
- Exhibits135: Impact of drivers and challenges in 2024 and 2029
- Exhibits136: Overview on criticality of inputs and factors of differentiation
- Exhibits137: Overview on factors of disruption
- Exhibits138: Impact of key risks on business
- Exhibits139: Companies covered
- Exhibits140: Company ranking index
- Exhibits141: Matrix on companies position and classification
- Exhibits142: Anthology Inc. - Overview
- Exhibits143: Anthology Inc. - Product / Service
- Exhibits144: Anthology Inc. - Key news
- Exhibits145: Anthology Inc. - Key offerings
- Exhibits146: SWOT
- Exhibits147: Batia Infotech - Overview
- Exhibits148: Batia Infotech - Product / Service
- Exhibits149: Batia Infotech - Key offerings
- Exhibits150: SWOT
- Exhibits151: CogniFit Inc. - Overview
- Exhibits152: CogniFit Inc. - Product / Service
- Exhibits153: CogniFit Inc. - Key offerings
- Exhibits154: SWOT
- Exhibits155: Coursera Inc. - Overview
- Exhibits156: Coursera Inc. - Business segments
- Exhibits157: Coursera Inc. - Key news
- Exhibits158: Coursera Inc. - Key offerings
- Exhibits159: Coursera Inc. - Segment focus
- Exhibits160: SWOT
- Exhibits161: D2L Inc. - Overview
- Exhibits162: D2L Inc. - Product / Service
- Exhibits163: D2L Inc. - Key news
- Exhibits164: D2L Inc. - Key offerings
- Exhibits165: SWOT
- Exhibits166: Educational Testing Service - Overview
- Exhibits167: Educational Testing Service - Product / Service
- Exhibits168: Educational Testing Service - Key offerings
- Exhibits169: SWOT
- Exhibits170: Edutech - Overview
- Exhibits171: Edutech - Product / Service
- Exhibits172: Edutech - Key offerings
- Exhibits173: SWOT
- Exhibits174: Houghton Mifflin Harcourt Co. - Overview
- Exhibits175: Houghton Mifflin Harcourt Co. - Product / Service
- Exhibits176: Houghton Mifflin Harcourt Co. - Key news
- Exhibits177: Houghton Mifflin Harcourt Co. - Key offerings
- Exhibits178: SWOT
- Exhibits179: Instructure Holdings Inc. - Overview
- Exhibits180: Instructure Holdings Inc. - Product / Service
- Exhibits181: Instructure Holdings Inc. - Key news
- Exhibits182: Instructure Holdings Inc. - Key offerings
- Exhibits183: SWOT
- Exhibits184: John Wiley and Sons Inc. - Overview
- Exhibits185: John Wiley and Sons Inc. - Business segments
- Exhibits186: John Wiley and Sons Inc. - Key offerings
- Exhibits187: John Wiley and Sons Inc. - Segment focus
- Exhibits188: SWOT
- Exhibits189: MeritTrac Services Pvt Ltd. - Overview
- Exhibits190: MeritTrac Services Pvt Ltd. - Product / Service
- Exhibits191: MeritTrac Services Pvt Ltd. - Key offerings
- Exhibits192: SWOT
- Exhibits193: NIIT Ltd. - Overview
- Exhibits194: NIIT Ltd. - Product / Service
- Exhibits195: NIIT Ltd. - Key news
- Exhibits196: NIIT Ltd. - Key offerings
- Exhibits197: SWOT
- Exhibits198: Oxford University Press - Overview
- Exhibits199: Oxford University Press - Product / Service
- Exhibits200: Oxford University Press - Key offerings
- Exhibits201: SWOT
- Exhibits202: Pearson Plc - Overview
- Exhibits203: Pearson Plc - Business segments
- Exhibits204: Pearson Plc - Key news
- Exhibits205: Pearson Plc - Key offerings
- Exhibits206: Pearson Plc - Segment focus
- Exhibits207: SWOT
- Exhibits208: Sylvan Learning LLC - Overview
- Exhibits209: Sylvan Learning LLC - Product / Service
- Exhibits210: Sylvan Learning LLC - Key offerings
- Exhibits211: SWOT
- Exhibits212: Inclusions checklist
- Exhibits213: Exclusions checklist
- Exhibits214: Currency conversion rates for US$
- Exhibits215: Research methodology
- Exhibits216: Information sources
- Exhibits217: Data validation
- Exhibits218: Validation techniques employed for market sizing
- Exhibits219: Data synthesis
- Exhibits220: 360 degree market analysis
- Exhibits221: List of abbreviations
The k-12 testing and assessment market is forecasted to grow by USD 14583.9 mn during 2024-2029, accelerating at a CAGR of 12.2% during the forecast period. The report on the k-12 testing and assessment market provides a holistic analysis, market size and forecast, trends, growth drivers, and challenges, as well as vendor analysis covering around 25 vendors.
The report offers an up-to-date analysis regarding the current market scenario, the latest trends and drivers, and the overall market environment. The market is driven by increasing use of analytics, growing momentum of learning management system, and growing government interventions in k-12 testing and assessment.
| Market Scope | |
|---|---|
| Base Year | 2025 |
| End Year | 2029 |
| Series Year | 2025-2029 |
| Growth Momentum | Accelerate |
| YOY 2025 | 10.2% |
| CAGR | 12.2% |
| Incremental Value | $14583.9 mn |
Technavio's k-12 testing and assessment market is segmented as below:
By Product
- Curriculum-based testing
- Non-curriculum-based testing
By Method
- Blended method
- Online method
- Traditional method
By Geographical Landscape
- North America
- Europe
- APAC
- South America
- Middle East and Africa
This study identifies the increasing emphasis on formative learning tools as one of the prime reasons driving the k-12 testing and assessment market growth during the next few years. Also, rise in cloud computing and growing use of games for assessment will lead to sizable demand in the market.
The report on the k-12 testing and assessment market covers the following areas:
- K-12 Testing And Assessment Market sizing
- K-12 Testing And Assessment Market forecast
- K-12 Testing And Assessment Market industry analysis
The robust vendor analysis is designed to help clients improve their market position, and in line with this, this report provides a detailed analysis of several leading k-12 testing and assessment market vendors that include Anthology Inc., Batia Infotech, CogniFit Inc., Coursera Inc., D2L Inc., Educational Testing Service, Edutech, FairTest, Houghton Mifflin Harcourt Co., Instructure Holdings Inc., John Wiley and Sons Inc., MeritTrac Services Pvt Ltd., NIIT Ltd., Oxford University Press, Pearson Plc, RAND Corp., Scantron Inc., Sylvan Learning LLC, Thoughtful Learning, and Vedantu Innovations Pvt. Ltd.. Also, the k-12 testing and assessment market analysis report includes information on upcoming trends and challenges that will influence market growth. This is to help companies strategize and leverage all forthcoming growth opportunities.
The study was conducted using an objective combination of primary and secondary information including inputs from key participants in the industry. The report contains a comprehensive market and vendor landscape in addition to an analysis of the key vendors.
The publisher presents a detailed picture of the market by the way of study, synthesis, and summation of data from multiple sources by an analysis of key parameters such as profit, pricing, competition, and promotions. It presents various market facets by identifying the key industry influencers. The data presented is comprehensive, reliable, and a result of extensive primary and secondary research. The market research reports provide a complete competitive landscape and an in-depth vendor selection methodology and analysis using qualitative and quantitative research to forecast accurate market growth.
Table of Contents
1 Executive Summary
- 1.1 Market overview
- Executive Summary - Chart on Market Overview
- Executive Summary - Data Table on Market Overview
- Executive Summary - Chart on Global Market Characteristics
- Executive Summary - Chart on Market By Geographical Landscape
- Executive Summary - Chart on Market Segmentation by Product
- Executive Summary - Chart on Market Segmentation by Method
- Executive Summary - Chart on Incremental Growth
- Executive Summary - Data Table on Incremental Growth
- Executive Summary - Chart on Company Market Positioning
2 Technavio Analysis
- 2.1 Analysis of price sensitivity, lifecycle, customer purchase basket, adoption rates, and purchase criteria
- Analysis of price sensitivity, lifecycle, customer purchase basket, adoption rates, and purchase criteria
- 2.2 Criticality of inputs and Factors of differentiation
- Overview on criticality of inputs and factors of differentiation
- 2.3 Factors of disruption
- Overview on factors of disruption
- 2.4 Impact of drivers and challenges
- Impact of drivers and challenges in 2024 and 2029
3 Market Landscape
- 3.1 Market ecosystem
- Parent Market
- Data Table on - Parent Market
- 3.2 Market characteristics
- Market characteristics analysis
- 3.3 Value chain analysis
- Value chain analysis
4 Market Sizing
- 4.1 Market definition
- Offerings of companies included in the market definition
- 4.2 Market segment analysis
- Market segments
- 4.3 Market size 2024
- 4.4 Market outlook: Forecast for 2024-2029
- Chart on Global - Market size and forecast 2024-2029 ($ million)
- Data Table on Global - Market size and forecast 2024-2029 ($ million)
- Chart on Global Market: Year-over-year growth 2024-2029 (%)
- Data Table on Global Market: Year-over-year growth 2024-2029 (%)
5 Historic Market Size
- 5.1 Global K-12 Testing And Assessment Market 2019 - 2023
- Historic Market Size - Data Table on Global K-12 Testing And Assessment Market 2019 - 2023 ($ million)
- 5.2 Product segment analysis 2019 - 2023
- Historic Market Size - Product Segment 2019 - 2023 ($ million)
- 5.3 Method segment analysis 2019 - 2023
- Historic Market Size - Method Segment 2019 - 2023 ($ million)
- 5.4 Geography segment analysis 2019 - 2023
- Historic Market Size - Geography Segment 2019 - 2023 ($ million)
- 5.5 Country segment analysis 2019 - 2023
- Historic Market Size - Country Segment 2019 - 2023 ($ million)
6 Qualitative Analysis
- 6.1 Impact of AI on K-12 testing and assessment market
7 Five Forces Analysis
- 7.1 Five forces summary
- Five forces analysis - Comparison between 2024 and 2029
- 7.2 Bargaining power of buyers
- Bargaining power of buyers - Impact of key factors 2024 and 2029
- 7.3 Bargaining power of suppliers
- Bargaining power of suppliers - Impact of key factors in 2024 and 2029
- 7.4 Threat of new entrants
- Threat of new entrants - Impact of key factors in 2024 and 2029
- 7.5 Threat of substitutes
- Threat of substitutes - Impact of key factors in 2024 and 2029
- 7.6 Threat of rivalry
- Threat of rivalry - Impact of key factors in 2024 and 2029
- 7.7 Market condition
- Chart on Market condition - Five forces 2024 and 2029
8 Market Segmentation by Product
- 8.1 Market segments
- Chart on Product - Market share 2024-2029 (%)
- Data Table on Product - Market share 2024-2029 (%)
- 8.2 Comparison by Product
- Chart on Comparison by Product
- Data Table on Comparison by Product
- 8.3 Curriculum-based testing - Market size and forecast 2024-2029
- Chart on Curriculum-based testing - Market size and forecast 2024-2029 ($ million)
- Data Table on Curriculum-based testing - Market size and forecast 2024-2029 ($ million)
- Chart on Curriculum-based testing - Year-over-year growth 2024-2029 (%)
- Data Table on Curriculum-based testing - Year-over-year growth 2024-2029 (%)
- 8.4 Non-curriculum-based testing - Market size and forecast 2024-2029
- Chart on Non-curriculum-based testing - Market size and forecast 2024-2029 ($ million)
- Data Table on Non-curriculum-based testing - Market size and forecast 2024-2029 ($ million)
- Chart on Non-curriculum-based testing - Year-over-year growth 2024-2029 (%)
- Data Table on Non-curriculum-based testing - Year-over-year growth 2024-2029 (%)
- 8.5 Market opportunity by Product
- Market opportunity by Product ($ million)
- Data Table on Market opportunity by Product ($ million)
9 Market Segmentation by Method
- 9.1 Market segments
- Chart on Method - Market share 2024-2029 (%)
- Data Table on Method - Market share 2024-2029 (%)
- 9.2 Comparison by Method
- Chart on Comparison by Method
- Data Table on Comparison by Method
- 9.3 Blended method - Market size and forecast 2024-2029
- Chart on Blended method - Market size and forecast 2024-2029 ($ million)
- Data Table on Blended method - Market size and forecast 2024-2029 ($ million)
- Chart on Blended method - Year-over-year growth 2024-2029 (%)
- Data Table on Blended method - Year-over-year growth 2024-2029 (%)
- 9.4 Online method - Market size and forecast 2024-2029
- Chart on Online method - Market size and forecast 2024-2029 ($ million)
- Data Table on Online method - Market size and forecast 2024-2029 ($ million)
- Chart on Online method - Year-over-year growth 2024-2029 (%)
- Data Table on Online method - Year-over-year growth 2024-2029 (%)
- 9.5 Traditional method - Market size and forecast 2024-2029
- Chart on Traditional method - Market size and forecast 2024-2029 ($ million)
- Data Table on Traditional method - Market size and forecast 2024-2029 ($ million)
- Chart on Traditional method - Year-over-year growth 2024-2029 (%)
- Data Table on Traditional method - Year-over-year growth 2024-2029 (%)
- 9.6 Market opportunity by Method
- Market opportunity by Method ($ million)
- Data Table on Market opportunity by Method ($ million)
10 Customer Landscape
- 10.1 Customer landscape overview
- Analysis of price sensitivity, lifecycle, customer purchase basket, adoption rates, and purchase criteria
11 Geographic Landscape
- 11.1 Geographic segmentation
- Chart on Market share By Geographical Landscape 2024-2029 (%)
- Data Table on Market share By Geographical Landscape 2024-2029 (%)
- 11.2 Geographic comparison
- Chart on Geographic comparison
- Data Table on Geographic comparison
- 11.3 North America - Market size and forecast 2024-2029
- Chart on North America - Market size and forecast 2024-2029 ($ million)
- Data Table on North America - Market size and forecast 2024-2029 ($ million)
- Chart on North America - Year-over-year growth 2024-2029 (%)
- Data Table on North America - Year-over-year growth 2024-2029 (%)
- 11.4 Europe - Market size and forecast 2024-2029
- Chart on Europe - Market size and forecast 2024-2029 ($ million)
- Data Table on Europe - Market size and forecast 2024-2029 ($ million)
- Chart on Europe - Year-over-year growth 2024-2029 (%)
- Data Table on Europe - Year-over-year growth 2024-2029 (%)
- 11.5 APAC - Market size and forecast 2024-2029
- Chart on APAC - Market size and forecast 2024-2029 ($ million)
- Data Table on APAC - Market size and forecast 2024-2029 ($ million)
- Chart on APAC - Year-over-year growth 2024-2029 (%)
- Data Table on APAC - Year-over-year growth 2024-2029 (%)
- 11.6 South America - Market size and forecast 2024-2029
- Chart on South America - Market size and forecast 2024-2029 ($ million)
- Data Table on South America - Market size and forecast 2024-2029 ($ million)
- Chart on South America - Year-over-year growth 2024-2029 (%)
- Data Table on South America - Year-over-year growth 2024-2029 (%)
- 11.7 Middle East and Africa - Market size and forecast 2024-2029
- Chart on Middle East and Africa - Market size and forecast 2024-2029 ($ million)
- Data Table on Middle East and Africa - Market size and forecast 2024-2029 ($ million)
- Chart on Middle East and Africa - Year-over-year growth 2024-2029 (%)
- Data Table on Middle East and Africa - Year-over-year growth 2024-2029 (%)
- 11.8 US - Market size and forecast 2024-2029
- Chart on US - Market size and forecast 2024-2029 ($ million)
- Data Table on US - Market size and forecast 2024-2029 ($ million)
- Chart on US - Year-over-year growth 2024-2029 (%)
- Data Table on US - Year-over-year growth 2024-2029 (%)
- 11.9 China - Market size and forecast 2024-2029
- Chart on China - Market size and forecast 2024-2029 ($ million)
- Data Table on China - Market size and forecast 2024-2029 ($ million)
- Chart on China - Year-over-year growth 2024-2029 (%)
- Data Table on China - Year-over-year growth 2024-2029 (%)
- 11.10 UK - Market size and forecast 2024-2029
- Chart on UK - Market size and forecast 2024-2029 ($ million)
- Data Table on UK - Market size and forecast 2024-2029 ($ million)
- Chart on UK - Year-over-year growth 2024-2029 (%)
- Data Table on UK - Year-over-year growth 2024-2029 (%)
- 11.11 Germany - Market size and forecast 2024-2029
- Chart on Germany - Market size and forecast 2024-2029 ($ million)
- Data Table on Germany - Market size and forecast 2024-2029 ($ million)
- Chart on Germany - Year-over-year growth 2024-2029 (%)
- Data Table on Germany - Year-over-year growth 2024-2029 (%)
- 11.12 Canada - Market size and forecast 2024-2029
- Chart on Canada - Market size and forecast 2024-2029 ($ million)
- Data Table on Canada - Market size and forecast 2024-2029 ($ million)
- Chart on Canada - Year-over-year growth 2024-2029 (%)
- Data Table on Canada - Year-over-year growth 2024-2029 (%)
- 11.13 India - Market size and forecast 2024-2029
- Chart on India - Market size and forecast 2024-2029 ($ million)
- Data Table on India - Market size and forecast 2024-2029 ($ million)
- Chart on India - Year-over-year growth 2024-2029 (%)
- Data Table on India - Year-over-year growth 2024-2029 (%)
- 11.14 Brazil - Market size and forecast 2024-2029
- Chart on Brazil - Market size and forecast 2024-2029 ($ million)
- Data Table on Brazil - Market size and forecast 2024-2029 ($ million)
- Chart on Brazil - Year-over-year growth 2024-2029 (%)
- Data Table on Brazil - Year-over-year growth 2024-2029 (%)
- 11.15 France - Market size and forecast 2024-2029
- Chart on France - Market size and forecast 2024-2029 ($ million)
- Data Table on France - Market size and forecast 2024-2029 ($ million)
- Chart on France - Year-over-year growth 2024-2029 (%)
- Data Table on France - Year-over-year growth 2024-2029 (%)
- 11.16 Italy - Market size and forecast 2024-2029
- Chart on Italy - Market size and forecast 2024-2029 ($ million)
- Data Table on Italy - Market size and forecast 2024-2029 ($ million)
- Chart on Italy - Year-over-year growth 2024-2029 (%)
- Data Table on Italy - Year-over-year growth 2024-2029 (%)
- 11.17 Japan - Market size and forecast 2024-2029
- Chart on Japan - Market size and forecast 2024-2029 ($ million)
- Data Table on Japan - Market size and forecast 2024-2029 ($ million)
- Chart on Japan - Year-over-year growth 2024-2029 (%)
- Data Table on Japan - Year-over-year growth 2024-2029 (%)
- 11.18 Market opportunity By Geographical Landscape
- Market opportunity By Geographical Landscape ($ million)
- Data Tables on Market opportunity By Geographical Landscape ($ million)
12 Drivers, Challenges, and Opportunity/Restraints
- 12.1 Market drivers
- 12.2 Market challenges
- 12.3 Impact of drivers and challenges
- Impact of drivers and challenges in 2024 and 2029
- 12.4 Market opportunities/restraints
13 Competitive Landscape
- 13.1 Overview
- 13.2 Competitive Landscape
- Overview on criticality of inputs and factors of differentiation
- 13.3 Landscape disruption
- Overview on factors of disruption
- 13.4 Industry risks
- Impact of key risks on business
14 Competitive Analysis
- 14.1 Companies profiled
- Companies covered
- 14.2 Company ranking index
- Company ranking index
- 14.3 Market positioning of companies
- Matrix on companies position and classification
- 14.4 Anthology Inc.
- Anthology Inc. - Overview
- Anthology Inc. - Product / Service
- Anthology Inc. - Key news
- Anthology Inc. - Key offerings
- SWOT
- 14.5 Batia Infotech
- Batia Infotech - Overview
- Batia Infotech - Product / Service
- Batia Infotech - Key offerings
- SWOT
- 14.6 CogniFit Inc.
- CogniFit Inc. - Overview
- CogniFit Inc. - Product / Service
- CogniFit Inc. - Key offerings
- SWOT
- 14.7 Coursera Inc.
- Coursera Inc. - Overview
- Coursera Inc. - Business segments
- Coursera Inc. - Key news
- Coursera Inc. - Key offerings
- Coursera Inc. - Segment focus
- SWOT
- 14.8 D2L Inc.
- D2L Inc. - Overview
- D2L Inc. - Product / Service
- D2L Inc. - Key news
- D2L Inc. - Key offerings
- SWOT
- 14.9 Educational Testing Service
- Educational Testing Service - Overview
- Educational Testing Service - Product / Service
- Educational Testing Service - Key offerings
- SWOT
- 14.10 Edutech
- Edutech - Overview
- Edutech - Product / Service
- Edutech - Key offerings
- SWOT
- 14.11 Houghton Mifflin Harcourt Co.
- Houghton Mifflin Harcourt Co. - Overview
- Houghton Mifflin Harcourt Co. - Product / Service
- Houghton Mifflin Harcourt Co. - Key news
- Houghton Mifflin Harcourt Co. - Key offerings
- SWOT
- 14.12 Instructure Holdings Inc.
- Instructure Holdings Inc. - Overview
- Instructure Holdings Inc. - Product / Service
- Instructure Holdings Inc. - Key news
- Instructure Holdings Inc. - Key offerings
- SWOT
- 14.13 John Wiley and Sons Inc.
- John Wiley and Sons Inc. - Overview
- John Wiley and Sons Inc. - Business segments
- John Wiley and Sons Inc. - Key offerings
- John Wiley and Sons Inc. - Segment focus
- SWOT
- 14.14 MeritTrac Services Pvt Ltd.
- MeritTrac Services Pvt Ltd. - Overview
- MeritTrac Services Pvt Ltd. - Product / Service
- MeritTrac Services Pvt Ltd. - Key offerings
- SWOT
- 14.15 NIIT Ltd.
- NIIT Ltd. - Overview
- NIIT Ltd. - Product / Service
- NIIT Ltd. - Key news
- NIIT Ltd. - Key offerings
- SWOT
- 14.16 Oxford University Press
- Oxford University Press - Overview
- Oxford University Press - Product / Service
- Oxford University Press - Key offerings
- SWOT
- 14.17 Pearson Plc
- Pearson Plc - Overview
- Pearson Plc - Business segments
- Pearson Plc - Key news
- Pearson Plc - Key offerings
- Pearson Plc - Segment focus
- SWOT
- 14.18 Sylvan Learning LLC
- Sylvan Learning LLC - Overview
- Sylvan Learning LLC - Product / Service
- Sylvan Learning LLC - Key offerings
- SWOT
15 Appendix
- 15.1 Scope of the report
- 15.2 Inclusions and exclusions checklist
- Inclusions checklist
- Exclusions checklist
- 15.3 Currency conversion rates for US$
- Currency conversion rates for US$
- 15.4 Research methodology
- Research methodology
- 15.5 Data procurement
- Information sources
- 15.6 Data validation
- Data validation
- 15.7 Validation techniques employed for market sizing
- Validation techniques employed for market sizing
- 15.8 Data synthesis
- Data synthesis
- 15.9 360 degree market analysis
- 360 degree market analysis
- 15.10 List of abbreviations
- List of abbreviations
