|
|
市場調査レポート
商品コード
1515952
衛星地上局装置の世界市場 2024-2028Global satellite ground station equipment market 2024-2028 |
||||||
|
|||||||
カスタマイズ可能
|
|||||||

| 衛星地上局装置の世界市場 2024-2028 |
|
出版日: 2024年06月11日
発行: TechNavio
ページ情報: 英文 152 Pages
納期: 即納可能
|

全表示
- 概要
- 図表
- 目次
衛星地上局装置市場は2023-2028年に6兆6,000億米ドル、予測期間中のCAGRは6.89%で成長すると予測されます。
当レポートでは、衛星地上局装置市場の全体的な分析、市場規模・予測、動向、成長促進要因、課題、約25のベンダーを網羅したベンダー分析などを掲載しています。
現在の市場シナリオ、最新動向と促進要因、市場環境全体に関する最新分析を提供しています。同市場は、衛星通信への投資の増加、衛星打ち上げ数の増加、リモートセンシング用途での衛星利用の増加などが牽引しています。
| 市場範囲 | |
|---|---|
| 基準年 | 2024 |
| 終了年 | 2028 |
| 予測期間 | 2024-2028 |
| 成長モメンタム | 加速 |
| 前年比2024年 | 6.59% |
| CAGR | 6.89% |
| 増分額 | 6兆6,000億米ドル |
本調査では、今後数年間の衛星地上局装置市場成長を牽引する主要因の1つとして、モバイル地上局の出現を挙げています。また、5Gエコシステムの展開、戦略的パートナーシップや契約の増加が、市場の大きな需要につながります。
目次
第1章 エグゼクティブサマリー
- 市場概要
第2章 市場情勢
- 市場エコシステム
- 市場の特徴
- バリューチェーン分析
第3章 市場規模の評価
- 市場の定義
- 市場セグメント分析
- 市場規模 2023
- 市場の見通し 2023-2028
第4章 市場規模実績
- 世界衛星地上局装置市場 2018-2022
- タイプ別セグメント分析 2018-2022
- 地域別セグメント分析 2018-2022
- 国別セグメント分析 2018-2022
第5章 ファイブフォース分析
- ファイブフォースの要約
- 買い手の交渉力
- 供給企業の交渉力
- 新規参入業者の脅威
- 代替品の脅威
- 競争の脅威
- 市況
第6章 市場セグメンテーション:タイプ別
- 市場セグメンテーション
- 比較:タイプ別
- NOC機器:市場規模と予測 2023-2028
- VSAT機器:市場規模と予測 2023-2028
- アンテナ:市場規模と予測 2023-2028
- パワーユニット:市場規模と予測 2023-2028
- その他:市場規模と予測 2023-2028
- 市場機会:タイプ別
第7章 顧客情勢
- 顧客情勢の概要
第8章 地域別情勢
- 地域別セグメンテーション
- 地域別比較
- 北米:市場規模と予測 2023-2028
- アジア太平洋:市場規模と予測 2023-2028
- 欧州:市場規模と予測 2023-2028
- 南米:市場規模と予測 2023-2028
- 中東・アフリカ:市場規模と予測 2023-2028
- 米国:市場規模と予測 2023-2028
- 中国:市場規模と予測 2023-2028
- 日本:市場規模と予測 2023-2028
- ロシア:市場規模と予測 2023-2028
- 英国:市場規模と予測 2023-2028
- 市場機会:地域情勢別
第9章 促進要因・課題・機会・抑制要因
- 市場促進要因
- 市場の課題
- 促進要因と課題の影響
- 市場の機会・抑制要因
第10章 競合情勢
- 概要
- 競合情勢
- 混乱の状況
- 業界のリスク
第11章 競合分析
- 企業プロファイル
- 企業の市場ポジショニング
- Baylin Technologies Inc
- Comtech
- EchoStar Corp.
- Gilat Satellite Networks Ltd.
- GomSpace Group AB
- Norsat International Inc.
- NovelSat
- Singapore Technologies Engineering Ltd.
- Terrasat Communications Inc
- Viasat Inc.
第12章 付録
Exhibits:
- Exhibits1: Executive Summary - Chart on Market Overview
- Exhibits2: Executive Summary - Data Table on Market Overview
- Exhibits3: Executive Summary - Chart on Global Market Characteristics
- Exhibits4: Executive Summary - Chart on Market By Geographical Landscape
- Exhibits5: Executive Summary - Chart on Market Segmentation by Type
- Exhibits6: Executive Summary - Chart on Incremental Growth
- Exhibits7: Executive Summary - Data Table on Incremental Growth
- Exhibits8: Executive Summary - Chart on Company Market Positioning
- Exhibits9: Parent Market
- Exhibits10: Data Table on - Parent Market
- Exhibits11: Market characteristics analysis
- Exhibits12: Value Chain Analysis
- Exhibits13: Offerings of companies included in the market definition
- Exhibits14: Market segments
- Exhibits15: Chart on Global - Market size and forecast 2023-2028 ($ billion)
- Exhibits16: Data Table on Global - Market size and forecast 2023-2028 ($ billion)
- Exhibits17: Chart on Global Market: Year-over-year growth 2023-2028 (%)
- Exhibits18: Data Table on Global Market: Year-over-year growth 2023-2028 (%)
- Exhibits19: Historic Market Size - Data Table on Global Satellite Ground Station Equipment Market 2018 - 2022 ($ billion)
- Exhibits20: Historic Market Size - Type Segment 2018 - 2022 ($ billion)
- Exhibits21: Historic Market Size - Geography Segment 2018 - 2022 ($ billion)
- Exhibits22: Historic Market Size - Country Segment 2018 - 2022 ($ billion)
- Exhibits23: Five forces analysis - Comparison between 2023 and 2028
- Exhibits24: Bargaining power of buyers - Impact of key factors 2023 and 2028
- Exhibits25: Bargaining power of suppliers - Impact of key factors in 2023 and 2028
- Exhibits26: Threat of new entrants - Impact of key factors in 2023 and 2028
- Exhibits27: Threat of substitutes - Impact of key factors in 2023 and 2028
- Exhibits28: Threat of rivalry - Impact of key factors in 2023 and 2028
- Exhibits29: Chart on Market condition - Five forces 2023 and 2028
- Exhibits30: Chart on Type - Market share 2023-2028 (%)
- Exhibits31: Data Table on Type - Market share 2023-2028 (%)
- Exhibits32: Chart on Comparison by Type
- Exhibits33: Data Table on Comparison by Type
- Exhibits34: Chart on NOC equipment - Market size and forecast 2023-2028 ($ billion)
- Exhibits35: Data Table on NOC equipment - Market size and forecast 2023-2028 ($ billion)
- Exhibits36: Chart on NOC equipment - Year-over-year growth 2023-2028 (%)
- Exhibits37: Data Table on NOC equipment - Year-over-year growth 2023-2028 (%)
- Exhibits38: Chart on VSAT equipment - Market size and forecast 2023-2028 ($ billion)
- Exhibits39: Data Table on VSAT equipment - Market size and forecast 2023-2028 ($ billion)
- Exhibits40: Chart on VSAT equipment - Year-over-year growth 2023-2028 (%)
- Exhibits41: Data Table on VSAT equipment - Year-over-year growth 2023-2028 (%)
- Exhibits42: Chart on Antennas - Market size and forecast 2023-2028 ($ billion)
- Exhibits43: Data Table on Antennas - Market size and forecast 2023-2028 ($ billion)
- Exhibits44: Chart on Antennas - Year-over-year growth 2023-2028 (%)
- Exhibits45: Data Table on Antennas - Year-over-year growth 2023-2028 (%)
- Exhibits46: Chart on Power units - Market size and forecast 2023-2028 ($ billion)
- Exhibits47: Data Table on Power units - Market size and forecast 2023-2028 ($ billion)
- Exhibits48: Chart on Power units - Year-over-year growth 2023-2028 (%)
- Exhibits49: Data Table on Power units - Year-over-year growth 2023-2028 (%)
- Exhibits50: Chart on Others - Market size and forecast 2023-2028 ($ billion)
- Exhibits51: Data Table on Others - Market size and forecast 2023-2028 ($ billion)
- Exhibits52: Chart on Others - Year-over-year growth 2023-2028 (%)
- Exhibits53: Data Table on Others - Year-over-year growth 2023-2028 (%)
- Exhibits54: Market opportunity by Type ($ billion)
- Exhibits55: Data Table on Market opportunity by Type ($ billion)
- Exhibits56: Analysis of price sensitivity, lifecycle, customer purchase basket, adoption rates, and purchase criteria
- Exhibits57: Chart on Market share By Geographical Landscape 2023-2028 (%)
- Exhibits58: Data Table on Market share By Geographical Landscape 2023-2028 (%)
- Exhibits59: Chart on Geographic comparison
- Exhibits60: Data Table on Geographic comparison
- Exhibits61: Chart on North America - Market size and forecast 2023-2028 ($ billion)
- Exhibits62: Data Table on North America - Market size and forecast 2023-2028 ($ billion)
- Exhibits63: Chart on North America - Year-over-year growth 2023-2028 (%)
- Exhibits64: Data Table on North America - Year-over-year growth 2023-2028 (%)
- Exhibits65: Chart on APAC - Market size and forecast 2023-2028 ($ billion)
- Exhibits66: Data Table on APAC - Market size and forecast 2023-2028 ($ billion)
- Exhibits67: Chart on APAC - Year-over-year growth 2023-2028 (%)
- Exhibits68: Data Table on APAC - Year-over-year growth 2023-2028 (%)
- Exhibits69: Chart on Europe - Market size and forecast 2023-2028 ($ billion)
- Exhibits70: Data Table on Europe - Market size and forecast 2023-2028 ($ billion)
- Exhibits71: Chart on Europe - Year-over-year growth 2023-2028 (%)
- Exhibits72: Data Table on Europe - Year-over-year growth 2023-2028 (%)
- Exhibits73: Chart on South America - Market size and forecast 2023-2028 ($ billion)
- Exhibits74: Data Table on South America - Market size and forecast 2023-2028 ($ billion)
- Exhibits75: Chart on South America - Year-over-year growth 2023-2028 (%)
- Exhibits76: Data Table on South America - Year-over-year growth 2023-2028 (%)
- Exhibits77: Chart on Middle East and Africa - Market size and forecast 2023-2028 ($ billion)
- Exhibits78: Data Table on Middle East and Africa - Market size and forecast 2023-2028 ($ billion)
- Exhibits79: Chart on Middle East and Africa - Year-over-year growth 2023-2028 (%)
- Exhibits80: Data Table on Middle East and Africa - Year-over-year growth 2023-2028 (%)
- Exhibits81: Chart on US - Market size and forecast 2023-2028 ($ billion)
- Exhibits82: Data Table on US - Market size and forecast 2023-2028 ($ billion)
- Exhibits83: Chart on US - Year-over-year growth 2023-2028 (%)
- Exhibits84: Data Table on US - Year-over-year growth 2023-2028 (%)
- Exhibits85: Chart on China - Market size and forecast 2023-2028 ($ billion)
- Exhibits86: Data Table on China - Market size and forecast 2023-2028 ($ billion)
- Exhibits87: Chart on China - Year-over-year growth 2023-2028 (%)
- Exhibits88: Data Table on China - Year-over-year growth 2023-2028 (%)
- Exhibits89: Chart on Japan - Market size and forecast 2023-2028 ($ billion)
- Exhibits90: Data Table on Japan - Market size and forecast 2023-2028 ($ billion)
- Exhibits91: Chart on Japan - Year-over-year growth 2023-2028 (%)
- Exhibits92: Data Table on Japan - Year-over-year growth 2023-2028 (%)
- Exhibits93: Chart on Russia - Market size and forecast 2023-2028 ($ billion)
- Exhibits94: Data Table on Russia - Market size and forecast 2023-2028 ($ billion)
- Exhibits95: Chart on Russia - Year-over-year growth 2023-2028 (%)
- Exhibits96: Data Table on Russia - Year-over-year growth 2023-2028 (%)
- Exhibits97: Chart on UK - Market size and forecast 2023-2028 ($ billion)
- Exhibits98: Data Table on UK - Market size and forecast 2023-2028 ($ billion)
- Exhibits99: Chart on UK - Year-over-year growth 2023-2028 (%)
- Exhibits100: Data Table on UK - Year-over-year growth 2023-2028 (%)
- Exhibits101: Market opportunity By Geographical Landscape ($ billion)
- Exhibits102: Data Tables on Market opportunity By Geographical Landscape ($ billion)
- Exhibits103: Impact of drivers and challenges in 2023 and 2028
- Exhibits104: Overview on criticality of inputs and factors of differentiation
- Exhibits105: Overview on factors of disruption
- Exhibits106: Impact of key risks on business
- Exhibits107: Companies covered
- Exhibits108: Matrix on companies position and classification
- Exhibits109: Baylin Technologies Inc - Overview
- Exhibits110: Baylin Technologies Inc - Product / Service
- Exhibits111: Baylin Technologies Inc - Key offerings
- Exhibits112: Comtech - Overview
- Exhibits113: Comtech - Business segments
- Exhibits114: Comtech - Key news
- Exhibits115: Comtech - Key offerings
- Exhibits116: Comtech - Segment focus
- Exhibits117: EchoStar Corp. - Overview
- Exhibits118: EchoStar Corp. - Business segments
- Exhibits119: EchoStar Corp. - Key news
- Exhibits120: EchoStar Corp. - Key offerings
- Exhibits121: EchoStar Corp. - Segment focus
- Exhibits122: Gilat Satellite Networks Ltd. - Overview
- Exhibits123: Gilat Satellite Networks Ltd. - Business segments
- Exhibits124: Gilat Satellite Networks Ltd. - Key offerings
- Exhibits125: Gilat Satellite Networks Ltd. - Segment focus
- Exhibits126: GomSpace Group AB - Overview
- Exhibits127: GomSpace Group AB - Product / Service
- Exhibits128: GomSpace Group AB - Key offerings
- Exhibits129: Norsat International Inc. - Overview
- Exhibits130: Norsat International Inc. - Product / Service
- Exhibits131: Norsat International Inc. - Key offerings
- Exhibits132: NovelSat - Overview
- Exhibits133: NovelSat - Product / Service
- Exhibits134: NovelSat - Key offerings
- Exhibits135: Singapore Technologies Engineering Ltd. - Overview
- Exhibits136: Singapore Technologies Engineering Ltd. - Business segments
- Exhibits137: Singapore Technologies Engineering Ltd. - Key news
- Exhibits138: Singapore Technologies Engineering Ltd. - Key offerings
- Exhibits139: Singapore Technologies Engineering Ltd. - Segment focus
- Exhibits140: Terrasat Communications Inc - Overview
- Exhibits141: Terrasat Communications Inc - Product / Service
- Exhibits142: Terrasat Communications Inc - Key offerings
- Exhibits143: Viasat Inc. - Overview
- Exhibits144: Viasat Inc. - Business segments
- Exhibits145: Viasat Inc. - Key news
- Exhibits146: Viasat Inc. - Key offerings
- Exhibits147: Viasat Inc. - Segment focus
- Exhibits148: Inclusions checklist
- Exhibits149: Exclusions checklist
- Exhibits150: Currency conversion rates for US$
- Exhibits151: Research methodology
- Exhibits152: Information sources
- Exhibits153: Data validation
- Exhibits154: Validation techniques employed for market sizing
- Exhibits155: Data synthesis
- Exhibits156: 360 degree market analysis
- Exhibits157: List of abbreviations
The satellite ground station equipment market is forecasted to grow by USD 6600 bn during 2023-2028, accelerating at a CAGR of 6.89% during the forecast period. The report on the satellite ground station equipment market provides a holistic analysis, market size and forecast, trends, growth drivers, and challenges, as well as vendor analysis covering around 25 vendors.
The report offers an up-to-date analysis regarding the current market scenario, the latest trends and drivers, and the overall market environment. The market is driven by increasing investments in hts communication, increase in number of satellite launches, and increasing use of satellites for remote sensing applications.
Technavio's satellite ground station equipment market is segmented as below:
| Market Scope | |
|---|---|
| Base Year | 2024 |
| End Year | 2028 |
| Series Year | 2024-2028 |
| Growth Momentum | Accelerate |
| YOY 2024 | 6.59% |
| CAGR | 6.89% |
| Incremental Value | $6600bn |
By Type
- NOC equipment
- VSAT equipment
- Antennas
- Power units
- Others
By Geographical Landscape
- North America
- APAC
- Europe
- South America
- Middle East and Africa
This study identifies the emergence of mobile ground station as one of the prime reasons driving the satellite ground station equipment market growth during the next few years. Also, deployment of 5g ecosystem and increase in strategic partnerships and contracts will lead to sizable demand in the market.
The report on the satellite ground station equipment market covers the following areas:
- Satellite ground station equipment market sizing
- Satellite ground station equipment market forecast
- Satellite ground station equipment market industry analysis
The robust vendor analysis is designed to help clients improve their market position, and in line with this, this report provides a detailed analysis of several leading satellite ground station equipment market vendors that include AAC Clyde Space AB, Baylin Technologies Inc, Comtech, CPI International Inc, ECA Group, EchoStar Corp., Gilat Satellite Networks Ltd., GomSpace Group AB, Inmarsat Global Ltd., Innovative Solutions In Space BV, Kratos Defense and Security Solutions Inc., Norsat International Inc., NovelSat, Satcom Direct Inc, Singapore Technologies Engineering Ltd., Teledyne Technologies Inc., Terrasat Communications Inc, Ultra Electronics Holdings Plc, Viasat Inc., and WORK Microwave GmbH. Also, the satellite ground station equipment market analysis report includes information on upcoming trends and challenges that will influence market growth. This is to help companies strategize and leverage all forthcoming growth opportunities.
The study was conducted using an objective combination of primary and secondary information including inputs from key participants in the industry. The report contains a comprehensive market and vendor landscape in addition to an analysis of the key vendors.
The publisher presents a detailed picture of the market by the way of study, synthesis, and summation of data from multiple sources by an analysis of key parameters such as profit, pricing, competition, and promotions. It presents various market facets by identifying the key industry influencers. The data presented is comprehensive, reliable, and a result of extensive research - both primary and secondary. The market research reports provide a complete competitive landscape and an in-depth vendor selection methodology and analysis using qualitative and quantitative research to forecast the accurate market growth.
Table of Contents
1 Executive Summary
- 1.1 Market overview
- Executive Summary - Chart on Market Overview
- Executive Summary - Data Table on Market Overview
- Executive Summary - Chart on Global Market Characteristics
- Executive Summary - Chart on Market By Geographical Landscape
- Executive Summary - Chart on Market Segmentation by Type
- Executive Summary - Chart on Incremental Growth
- Executive Summary - Data Table on Incremental Growth
- Executive Summary - Chart on Company Market Positioning
2 Market Landscape
- 2.1 Market ecosystem
- Parent Market
- Data Table on - Parent Market
- 2.2 Market characteristics
- Market characteristics analysis
- 2.3 Value chain analysis
- Value Chain Analysis
3 Market Sizing
- 3.1 Market definition
- Offerings of companies included in the market definition
- 3.2 Market segment analysis
- Market segments
- 3.3 Market size 2023
- 3.4 Market outlook: Forecast for 2023-2028
- Chart on Global - Market size and forecast 2023-2028 ($ billion)
- Data Table on Global - Market size and forecast 2023-2028 ($ billion)
- Chart on Global Market: Year-over-year growth 2023-2028 (%)
- Data Table on Global Market: Year-over-year growth 2023-2028 (%)
4 Historic Market Size
- 4.1 Global Satellite Ground Station Equipment Market 2018 - 2022
- Historic Market Size - Data Table on Global Satellite Ground Station Equipment Market 2018 - 2022 ($ billion)
- 4.2 Type segment analysis 2018 - 2022
- Historic Market Size - Type Segment 2018 - 2022 ($ billion)
- 4.3 Geography segment analysis 2018 - 2022
- Historic Market Size - Geography Segment 2018 - 2022 ($ billion)
- 4.4 Country segment analysis 2018 - 2022
- Historic Market Size - Country Segment 2018 - 2022 ($ billion)
5 Five Forces Analysis
- 5.1 Five forces summary
- Five forces analysis - Comparison between 2023 and 2028
- 5.2 Bargaining power of buyers
- Bargaining power of buyers - Impact of key factors 2023 and 2028
- 5.3 Bargaining power of suppliers
- Bargaining power of suppliers - Impact of key factors in 2023 and 2028
- 5.4 Threat of new entrants
- Threat of new entrants - Impact of key factors in 2023 and 2028
- 5.5 Threat of substitutes
- Threat of substitutes - Impact of key factors in 2023 and 2028
- 5.6 Threat of rivalry
- Threat of rivalry - Impact of key factors in 2023 and 2028
- 5.7 Market condition
- Chart on Market condition - Five forces 2023 and 2028
6 Market Segmentation by Type
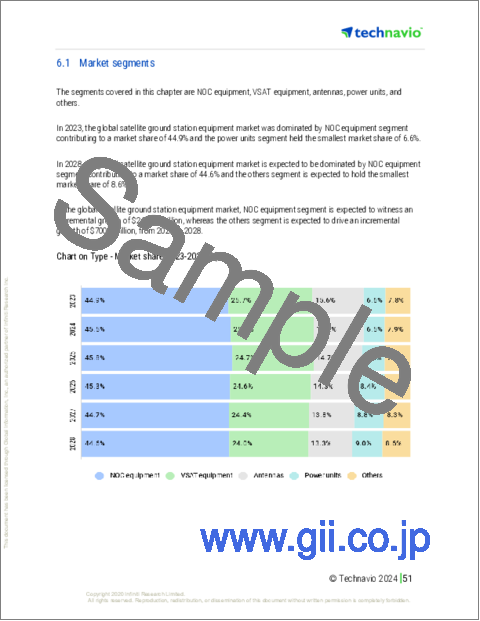
- 6.1 Market segments
- Chart on Type - Market share 2023-2028 (%)
- Data Table on Type - Market share 2023-2028 (%)
- 6.2 Comparison by Type
- Chart on Comparison by Type
- Data Table on Comparison by Type
- 6.3 NOC equipment - Market size and forecast 2023-2028
- Chart on NOC equipment - Market size and forecast 2023-2028 ($ billion)
- Data Table on NOC equipment - Market size and forecast 2023-2028 ($ billion)
- Chart on NOC equipment - Year-over-year growth 2023-2028 (%)
- Data Table on NOC equipment - Year-over-year growth 2023-2028 (%)
- 6.4 VSAT equipment - Market size and forecast 2023-2028
- Chart on VSAT equipment - Market size and forecast 2023-2028 ($ billion)
- Data Table on VSAT equipment - Market size and forecast 2023-2028 ($ billion)
- Chart on VSAT equipment - Year-over-year growth 2023-2028 (%)
- Data Table on VSAT equipment - Year-over-year growth 2023-2028 (%)
- 6.5 Antennas - Market size and forecast 2023-2028
- Chart on Antennas - Market size and forecast 2023-2028 ($ billion)
- Data Table on Antennas - Market size and forecast 2023-2028 ($ billion)
- Chart on Antennas - Year-over-year growth 2023-2028 (%)
- Data Table on Antennas - Year-over-year growth 2023-2028 (%)
- 6.6 Power units - Market size and forecast 2023-2028
- Chart on Power units - Market size and forecast 2023-2028 ($ billion)
- Data Table on Power units - Market size and forecast 2023-2028 ($ billion)
- Chart on Power units - Year-over-year growth 2023-2028 (%)
- Data Table on Power units - Year-over-year growth 2023-2028 (%)
- 6.7 Others - Market size and forecast 2023-2028
- Chart on Others - Market size and forecast 2023-2028 ($ billion)
- Data Table on Others - Market size and forecast 2023-2028 ($ billion)
- Chart on Others - Year-over-year growth 2023-2028 (%)
- Data Table on Others - Year-over-year growth 2023-2028 (%)
- 6.8 Market opportunity by Type
- Market opportunity by Type ($ billion)
- Data Table on Market opportunity by Type ($ billion)
7 Customer Landscape
- 7.1 Customer landscape overview
- Analysis of price sensitivity, lifecycle, customer purchase basket, adoption rates, and purchase criteria
8 Geographic Landscape
- 8.1 Geographic segmentation
- Chart on Market share By Geographical Landscape 2023-2028 (%)
- Data Table on Market share By Geographical Landscape 2023-2028 (%)
- 8.2 Geographic comparison
- Chart on Geographic comparison
- Data Table on Geographic comparison
- 8.3 North America - Market size and forecast 2023-2028
- Chart on North America - Market size and forecast 2023-2028 ($ billion)
- Data Table on North America - Market size and forecast 2023-2028 ($ billion)
- Chart on North America - Year-over-year growth 2023-2028 (%)
- Data Table on North America - Year-over-year growth 2023-2028 (%)
- 8.4 APAC - Market size and forecast 2023-2028
- Chart on APAC - Market size and forecast 2023-2028 ($ billion)
- Data Table on APAC - Market size and forecast 2023-2028 ($ billion)
- Chart on APAC - Year-over-year growth 2023-2028 (%)
- Data Table on APAC - Year-over-year growth 2023-2028 (%)
- 8.5 Europe - Market size and forecast 2023-2028
- Chart on Europe - Market size and forecast 2023-2028 ($ billion)
- Data Table on Europe - Market size and forecast 2023-2028 ($ billion)
- Chart on Europe - Year-over-year growth 2023-2028 (%)
- Data Table on Europe - Year-over-year growth 2023-2028 (%)
- 8.6 South America - Market size and forecast 2023-2028
- Chart on South America - Market size and forecast 2023-2028 ($ billion)
- Data Table on South America - Market size and forecast 2023-2028 ($ billion)
- Chart on South America - Year-over-year growth 2023-2028 (%)
- Data Table on South America - Year-over-year growth 2023-2028 (%)
- 8.7 Middle East and Africa - Market size and forecast 2023-2028
- Chart on Middle East and Africa - Market size and forecast 2023-2028 ($ billion)
- Data Table on Middle East and Africa - Market size and forecast 2023-2028 ($ billion)
- Chart on Middle East and Africa - Year-over-year growth 2023-2028 (%)
- Data Table on Middle East and Africa - Year-over-year growth 2023-2028 (%)
- 8.8 US - Market size and forecast 2023-2028
- Chart on US - Market size and forecast 2023-2028 ($ billion)
- Data Table on US - Market size and forecast 2023-2028 ($ billion)
- Chart on US - Year-over-year growth 2023-2028 (%)
- Data Table on US - Year-over-year growth 2023-2028 (%)
- 8.9 China - Market size and forecast 2023-2028
- Chart on China - Market size and forecast 2023-2028 ($ billion)
- Data Table on China - Market size and forecast 2023-2028 ($ billion)
- Chart on China - Year-over-year growth 2023-2028 (%)
- Data Table on China - Year-over-year growth 2023-2028 (%)
- 8.10 Japan - Market size and forecast 2023-2028
- Chart on Japan - Market size and forecast 2023-2028 ($ billion)
- Data Table on Japan - Market size and forecast 2023-2028 ($ billion)
- Chart on Japan - Year-over-year growth 2023-2028 (%)
- Data Table on Japan - Year-over-year growth 2023-2028 (%)
- 8.11 Russia - Market size and forecast 2023-2028
- Chart on Russia - Market size and forecast 2023-2028 ($ billion)
- Data Table on Russia - Market size and forecast 2023-2028 ($ billion)
- Chart on Russia - Year-over-year growth 2023-2028 (%)
- Data Table on Russia - Year-over-year growth 2023-2028 (%)
- 8.12 UK - Market size and forecast 2023-2028
- Chart on UK - Market size and forecast 2023-2028 ($ billion)
- Data Table on UK - Market size and forecast 2023-2028 ($ billion)
- Chart on UK - Year-over-year growth 2023-2028 (%)
- Data Table on UK - Year-over-year growth 2023-2028 (%)
- 8.13 Market opportunity By Geographical Landscape
- Market opportunity By Geographical Landscape ($ billion)
- Data Tables on Market opportunity By Geographical Landscape ($ billion)
9 Drivers, Challenges, and Opportunity/Restraints
- 9.1 Market drivers
- 9.2 Market challenges
- 9.3 Impact of drivers and challenges
- Impact of drivers and challenges in 2023 and 2028
- 9.4 Market opportunities/restraints
10 Competitive Landscape
- 10.1 Overview
- 10.2 Competitive Landscape
- Overview on criticality of inputs and factors of differentiation
- 10.3 Landscape disruption
- Overview on factors of disruption
- 10.4 Industry risks
- Impact of key risks on business
11 Competitive Analysis
- 11.1 Companies profiled
- Companies covered
- 11.2 Market positioning of companies
- Matrix on companies position and classification
- 11.3 Baylin Technologies Inc
- Baylin Technologies Inc - Overview
- Baylin Technologies Inc - Product / Service
- Baylin Technologies Inc - Key offerings
- 11.4 Comtech
- Comtech - Overview
- Comtech - Business segments
- Comtech - Key news
- Comtech - Key offerings
- Comtech - Segment focus
- 11.5 EchoStar Corp.
- EchoStar Corp. - Overview
- EchoStar Corp. - Business segments
- EchoStar Corp. - Key news
- EchoStar Corp. - Key offerings
- EchoStar Corp. - Segment focus
- 11.6 Gilat Satellite Networks Ltd.
- Gilat Satellite Networks Ltd. - Overview
- Gilat Satellite Networks Ltd. - Business segments
- Gilat Satellite Networks Ltd. - Key offerings
- Gilat Satellite Networks Ltd. - Segment focus
- 11.7 GomSpace Group AB
- GomSpace Group AB - Overview
- GomSpace Group AB - Product / Service
- GomSpace Group AB - Key offerings
- 11.8 Norsat International Inc.
- Norsat International Inc. - Overview
- Norsat International Inc. - Product / Service
- Norsat International Inc. - Key offerings
- 11.9 NovelSat
- NovelSat - Overview
- NovelSat - Product / Service
- NovelSat - Key offerings
- 11.10 Singapore Technologies Engineering Ltd.
- Singapore Technologies Engineering Ltd. - Overview
- Singapore Technologies Engineering Ltd. - Business segments
- Singapore Technologies Engineering Ltd. - Key news
- Singapore Technologies Engineering Ltd. - Key offerings
- Singapore Technologies Engineering Ltd. - Segment focus
- 11.11 Terrasat Communications Inc
- Terrasat Communications Inc - Overview
- Terrasat Communications Inc - Product / Service
- Terrasat Communications Inc - Key offerings
- 11.12 Viasat Inc.
- Viasat Inc. - Overview
- Viasat Inc. - Business segments
- Viasat Inc. - Key news
- Viasat Inc. - Key offerings
- Viasat Inc. - Segment focus
12 Appendix
- 12.1 Scope of the report
- 12.2 Inclusions and exclusions checklist
- Inclusions checklist
- Exclusions checklist
- 12.3 Currency conversion rates for US$
- Currency conversion rates for US$
- 12.4 Research methodology
- Research methodology
- 12.5 Data procurement
- Information sources
- 12.6 Data validation
- Data validation
- 12.7 Validation techniques employed for market sizing
- Validation techniques employed for market sizing
- 12.8 Data synthesis
- Data synthesis
- 12.9 360 degree market analysis
- 360 degree market analysis
- 12.10 List of abbreviations
- List of abbreviations
