|
|
市場調査レポート
商品コード
1660795
苛性ソーダ(NaOH)の世界市場(2025年~2029年)Global Caustic Soda (naoh) Market 2025-2029 |
||||||

|
|||||||
カスタマイズ可能
|
|||||||

| 苛性ソーダ(NaOH)の世界市場(2025年~2029年) |
|
出版日: 2025年02月18日
発行: TechNavio
ページ情報: 英文 246 Pages
納期: 即納可能
|

全表示
- 概要
- 目次
世界の苛性ソーダ(NaOH)の市場規模は、2024年~2029年に105億2,960万米ドルに達し、予測期間中のCAGRは4.4%で成長すると予測されています。
当レポートでは、苛性ソーダ(NaOH)市場の全体的な分析、市場規模・予測、動向、成長促進要因、課題、約25のベンダーを網羅したベンダー分析などを掲載しています。
当レポートは、現在の市場シナリオ、最新動向と促進要因、市場環境全体に関する最新分析を提供しています。アルミナ産業からの需要増加、紙・パルプ生産の増加、PVC製品の採用増加などが市場を牽引しています。
| 市場範囲 | |
|---|---|
| 基準年 | 2025年 |
| 終了年 | 2029年 |
| 予測期間 | 2025年~2029年 |
| 成長モメンタム | 加速 |
| 前年比2025年 | 4.2% |
| CAGR | 4.4% |
| 増分額 | 105億2,960万米ドル |
本調査は、業界の主要参入企業からのインプットを含め、一次情報と二次情報を客観的に組み合わせて実施しました。レポートには、主要企業の分析に加え、包括的な市場規模データ、地域別分析によるセグメント、ベンダー情勢が含まれています。レポートには実績データと予測データがあります。
本調査では、今後数年間の苛性ソーダ(NaOH)市場の成長を促進する主な理由の1つとして、苛性ソーダの生産能力の増加を挙げています。また、苛性ソーダ製造の水銀電池プロセスの段階的廃止とクロルアルカリ業界の企業による垂直統合は、市場の大きな需要につながります。
目次
第1章 エグゼクティブサマリー
- 市場概要
第2章 Technavioの分析
- 価格感度・ライフサイクル・顧客購入バスケット・採用率・購入基準の分析
- インプットの重要性と差別化の要因
- ディスラプションの要因
- 促進要因と課題の影響
第3章 市場情勢
- 市場エコシステム
- 市場の特徴
- バリューチェーン分析
第4章 市場規模
- 市場の定義
- 市場セグメント分析
- 市場規模(2024年)
- 市場の見通し(2024年~2029年)
第5章 市場規模実績
- 苛性ソーダ(NaOH)の世界市場(2019年~2023年)
- 用途セグメント分析(2019年~2023年)
- 方法セグメント分析(2019年~2023年)
- グレードタイプセグメント分析(2019年~2023年)
- 流通チャネルセグメント分析(2019年~2023年)
- 地域セグメント分析(2019年~2023年)
- 国セグメント分析(2019年~2023年)
第6章 定性分析
- AIの影響:苛性ソーダ(NaOH)の世界市場
第7章 ファイブフォース分析
- ファイブフォースの要約
- 買い手の交渉力
- 供給企業の交渉力
- 新規参入業者の脅威
- 代替品の脅威
- 競争の脅威
- 市況
第8章 市場セグメンテーション:用途別
- 市場セグメント
- 比較:用途別
- 有機化学物質:市場規模と予測(2024年~2029年)
- 石鹸・洗剤・繊維:市場規模と予測(2024年~2029年)
- 紙・パルプ:市場規模と予測(2024年~2029年)
- アルミニウム:市場規模と予測(2024年~2029年)
- その他:市場規模と予測(2024年~2029年)
- 市場機会:用途別
第9章 市場セグメンテーション:方法別
- 市場セグメント
- 比較:方法別
- 膜細胞プロセス:市場規模と予測(2024年~2029年)
- 横隔膜セルプロセス:市場規模と予測(2024年~2029年)
- 水銀電池プロセス:市場規模と予測(2024年~2029年)
- 市場機会:方法別
第10章 市場セグメンテーション:グレードタイプ別
- 市場セグメント
- 比較:グレードタイプ別
- 工業グレード:市場規模と予測(2024年~2029年)
- 食品グレード:市場規模と予測(2024年~2029年)
- 市場機会:グレードタイプ別
第11章 市場セグメンテーション:流通チャネル別
- 市場セグメント
- 比較:流通チャネル別
- オフライン:市場規模と予測(2024年~2029年)
- オンライン:市場規模と予測(2024年~2029年)
- 市場機会:流通チャネル別
第12章 顧客情勢
- 顧客情勢の概要
第13章 地域別情勢
- 地域別セグメンテーション
- 地域別比較
- アジア太平洋:市場規模と予測(2024年~2029年)
- 北米:市場規模と予測(2024年~2029年)
- 欧州:市場規模と予測(2024年~2029年)
- 南米:市場規模と予測(2024年~2029年)
- 中東・アフリカ:市場規模と予測(2024年~2029年)
- 中国:市場規模と予測(2024年~2029年)
- 米国:市場規模と予測(2024年~2029年)
- インド:市場規模と予測(2024年~2029年)
- 日本:市場規模と予測(2024年~2029年)
- カナダ:市場規模と予測(2024年~2029年)
- ドイツ:市場規模と予測(2024年~2029年)
- 韓国:市場規模と予測(2024年~2029年)
- 英国:市場規模と予測(2024年~2029年)
- フランス:市場規模と予測(2024年~2029年)
- イタリア:市場規模と予測(2024年~2029年)
- 市場機会:地域情勢別
第14章 促進要因・課題・機会・抑制要因
- 市場促進要因
- 市場の課題
- 促進要因と課題の影響
- 市場の機会・抑制要因
第15章 競合情勢
- 概要
- 競合情勢
- ディスラプションの状況
- 業界のリスク
第16章 競合分析
- 企業プロファイル
- 企業ランキング指数
- 企業の市場ポジショニング
- Aditya Birla Chemicals
- Arkema
- BASF SE
- Braskem SA
- Formosa Plastics Corp.
- Genesis Energy LP
- Gujarat Alkalies and Chemicals Ltd.
- INEOS Group Holdings S.A.
- Occidental Petroleum Corp.
- Olin Corp.
- Shin Etsu Chemical Co. Ltd.
- Solvay SA
- The Dow Chemical Co.
- Tosoh Corp.
- Westlake Corp.
第17章 付録
The caustic soda (NaOH) market is forecasted to grow by USD 10529.6 million during 2024-2029, accelerating at a CAGR of 4.4% during the forecast period. The report on the caustic soda (NaOH) market provides a holistic analysis, market size and forecast, trends, growth drivers, and challenges, as well as vendor analysis covering around 25 vendors.
The report offers an up-to-date analysis regarding the current market scenario, the latest trends and drivers, and the overall market environment. The market is driven by increasing demand from alumina industry, rising paper and pulp production, and increasing adoption of PVC products.
| Market Scope | |
|---|---|
| Base Year | 2025 |
| End Year | 2029 |
| Series Year | 2025-2029 |
| Growth Momentum | Accelerate |
| YOY 2025 | 4.2% |
| CAGR | 4.4% |
| Incremental Value | $10529.6 mn |
The study was conducted using an objective combination of primary and secondary information including inputs from key participants in the industry. The report contains a comprehensive market size data, segment with regional analysis and vendor landscape in addition to an analysis of the key companies. Reports have historic and forecast data.
Technavio's caustic soda (NaOH) market is segmented as below:
By Application
- Organic chemicals
- Soaps/detergents/textiles
- Paper and pulp
- Aluminum
- Others
By Method
- Membrane cell process
- Diaphragm cell process
- Mercury cell process
By Grade Type
- Industrial grade
- Food grade
By Distribution Channel
- Offline
- Online
By Geographical Landscape
- APAC
- North America
- Europe
- South America
- Middle East and Africa
This study identifies the increasing production capacity for caustic soda as one of the prime reasons driving the caustic soda (NaOH) market growth during the next few years. Also, phasing-out of mercury cell process of caustic soda production and vertical integration by companies in chlor-alkali industry will lead to sizable demand in the market.
The report on the caustic soda (NaOH) market covers the following areas:
- Caustic Soda (NaOH) Market sizing
- Caustic Soda (NaOH) Market forecast
- Caustic Soda (NaOH) Market industry analysis
The robust vendor analysis is designed to help clients improve their market position, and in line with this, this report provides a detailed analysis of several leading caustic soda (NaOH) market vendors that include Aditya Birla Chemicals, Arkema, BASF SE, Braskem SA, Covestro AG, Formosa Plastics Corp., Genesis Energy LP, Gujarat Alkalies and Chemicals Ltd., INEOS Group Holdings S.A., Kemira Oyj, Nouryon Chemicals Holding B.V., Occidental Petroleum Corp., Olin Corp., Shin Etsu Chemical Co. Ltd., Solvay SA, Superior Plus Corp., Tata Chemicals Ltd., The Dow Chemical Co., Tosoh Corp., and Westlake Corp.. Also, the caustic soda (NaOH) market analysis report includes information on upcoming trends and challenges that will influence market growth. This is to help companies strategize and leverage all forthcoming growth opportunities.
The publisher presents a detailed picture of the market by the way of study, synthesis, and summation of data from multiple sources by an analysis of key parameters such as profit, pricing, competition, and promotions. It presents various market facets by identifying the key industry influencers. The data presented is comprehensive, reliable, and a result of extensive primary and secondary research. The market research reports provide a complete competitive landscape and an in-depth vendor selection methodology and analysis using qualitative and quantitative research to forecast accurate market growth.
Table of Contents
1 Executive Summary
- 1.1 Market overview
- Executive Summary - Chart on Market Overview
- Executive Summary - Data Table on Market Overview
- Executive Summary - Chart on Global Market Characteristics
- Executive Summary - Chart on Market By Geographical Landscape
- Executive Summary - Chart on Market Segmentation by Application
- Executive Summary - Chart on Market Segmentation by Method
- Executive Summary - Chart on Market Segmentation by Grade Type
- Executive Summary - Chart on Market Segmentation by Distribution Channel
- Executive Summary - Chart on Incremental Growth
- Executive Summary - Data Table on Incremental Growth
- Executive Summary - Chart on Company Market Positioning
2 Technavio Analysis
- 2.1 Analysis of price sensitivity, lifecycle, customer purchase basket, adoption rates, and purchase criteria
- Analysis of price sensitivity, lifecycle, customer purchase basket, adoption rates, and purchase criteria
- 2.2 Criticality of inputs and Factors of differentiation
- Overview on criticality of inputs and factors of differentiation
- 2.3 Factors of disruption
- Overview on factors of disruption
- 2.4 Impact of drivers and challenges
- Impact of drivers and challenges in 2024 and 2029
3 Market Landscape
- 3.1 Market ecosystem
- Parent Market
- Data Table on - Parent Market
- 3.2 Market characteristics
- Market characteristics analysis
- 3.3 Value chain analysis
- Value chain analysis
4 Market Sizing
- 4.1 Market definition
- Offerings of companies included in the market definition
- 4.2 Market segment analysis
- Market segments
- 4.3 Market size 2024
- 4.4 Market outlook: Forecast for 2024-2029
- Chart on Global - Market size and forecast 2024-2029 ($ million)
- Data Table on Global - Market size and forecast 2024-2029 ($ million)
- Chart on Global Market: Year-over-year growth 2024-2029 (%)
- Data Table on Global Market: Year-over-year growth 2024-2029 (%)
5 Historic Market Size
- 5.1 Global Caustic Soda (NaOH) Market 2019 - 2023
- Historic Market Size - Data Table on Global Caustic Soda (NaOH) Market 2019 - 2023 ($ million)
- 5.2 Application segment analysis 2019 - 2023
- Historic Market Size - Application Segment 2019 - 2023 ($ million)
- 5.3 Method segment analysis 2019 - 2023
- Historic Market Size - Method Segment 2019 - 2023 ($ million)
- 5.4 Grade Type segment analysis 2019 - 2023
- Historic Market Size - Grade Type Segment 2019 - 2023 ($ million)
- 5.5 Distribution Channel segment analysis 2019 - 2023
- Historic Market Size - Distribution Channel Segment 2019 - 2023 ($ million)
- 5.6 Geography segment analysis 2019 - 2023
- Historic Market Size - Geography Segment 2019 - 2023 ($ million)
- 5.7 Country segment analysis 2019 - 2023
- Historic Market Size - Country Segment 2019 - 2023 ($ million)
6 Qualitative Analysis
- 6.1 Impact of AI on Global Caustic Soda (NaOH) Market
7 Five Forces Analysis
- 7.1 Five forces summary
- Five forces analysis - Comparison between 2024 and 2029
- 7.2 Bargaining power of buyers
- Bargaining power of buyers - Impact of key factors 2024 and 2029
- 7.3 Bargaining power of suppliers
- Bargaining power of suppliers - Impact of key factors in 2024 and 2029
- 7.4 Threat of new entrants
- Threat of new entrants - Impact of key factors in 2024 and 2029
- 7.5 Threat of substitutes
- Threat of substitutes - Impact of key factors in 2024 and 2029
- 7.6 Threat of rivalry
- Threat of rivalry - Impact of key factors in 2024 and 2029
- 7.7 Market condition
- Chart on Market condition - Five forces 2024 and 2029
8 Market Segmentation by Application
- 8.1 Market segments
- Chart on Application - Market share 2024-2029 (%)
- Data Table on Application - Market share 2024-2029 (%)
- 8.2 Comparison by Application
- Chart on Comparison by Application
- Data Table on Comparison by Application
- 8.3 Organic chemicals - Market size and forecast 2024-2029
- Chart on Organic chemicals - Market size and forecast 2024-2029 ($ million)
- Data Table on Organic chemicals - Market size and forecast 2024-2029 ($ million)
- Chart on Organic chemicals - Year-over-year growth 2024-2029 (%)
- Data Table on Organic chemicals - Year-over-year growth 2024-2029 (%)
- 8.4 Soaps/detergents/textiles - Market size and forecast 2024-2029
- Chart on Soaps/detergents/textiles - Market size and forecast 2024-2029 ($ million)
- Data Table on Soaps/detergents/textiles - Market size and forecast 2024-2029 ($ million)
- Chart on Soaps/detergents/textiles - Year-over-year growth 2024-2029 (%)
- Data Table on Soaps/detergents/textiles - Year-over-year growth 2024-2029 (%)
- 8.5 Paper and pulp - Market size and forecast 2024-2029
- Chart on Paper and pulp - Market size and forecast 2024-2029 ($ million)
- Data Table on Paper and pulp - Market size and forecast 2024-2029 ($ million)
- Chart on Paper and pulp - Year-over-year growth 2024-2029 (%)
- Data Table on Paper and pulp - Year-over-year growth 2024-2029 (%)
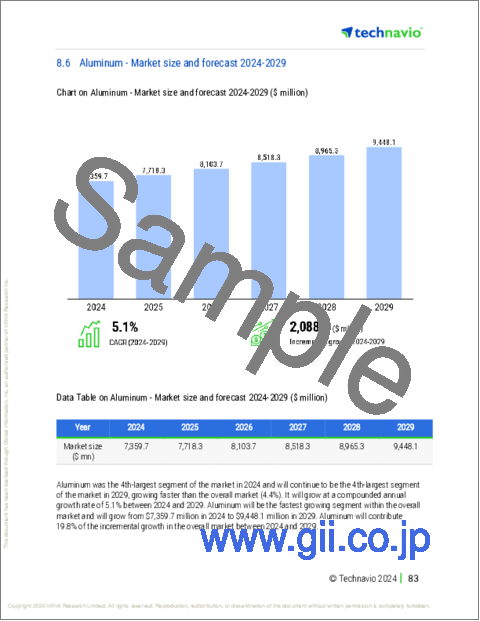
- 8.6 Aluminum - Market size and forecast 2024-2029
- Chart on Aluminum - Market size and forecast 2024-2029 ($ million)
- Data Table on Aluminum - Market size and forecast 2024-2029 ($ million)
- Chart on Aluminum - Year-over-year growth 2024-2029 (%)
- Data Table on Aluminum - Year-over-year growth 2024-2029 (%)
- 8.7 Others - Market size and forecast 2024-2029
- Chart on Others - Market size and forecast 2024-2029 ($ million)
- Data Table on Others - Market size and forecast 2024-2029 ($ million)
- Chart on Others - Year-over-year growth 2024-2029 (%)
- Data Table on Others - Year-over-year growth 2024-2029 (%)
- 8.8 Market opportunity by Application
- Market opportunity by Application ($ million)
- Data Table on Market opportunity by Application ($ million)
9 Market Segmentation by Method
- 9.1 Market segments
- Chart on Method - Market share 2024-2029 (%)
- Data Table on Method - Market share 2024-2029 (%)
- 9.2 Comparison by Method
- Chart on Comparison by Method
- Data Table on Comparison by Method
- 9.3 Membrane cell process - Market size and forecast 2024-2029
- Chart on Membrane cell process - Market size and forecast 2024-2029 ($ million)
- Data Table on Membrane cell process - Market size and forecast 2024-2029 ($ million)
- Chart on Membrane cell process - Year-over-year growth 2024-2029 (%)
- Data Table on Membrane cell process - Year-over-year growth 2024-2029 (%)
- 9.4 Diaphragm cell process - Market size and forecast 2024-2029
- Chart on Diaphragm cell process - Market size and forecast 2024-2029 ($ million)
- Data Table on Diaphragm cell process - Market size and forecast 2024-2029 ($ million)
- Chart on Diaphragm cell process - Year-over-year growth 2024-2029 (%)
- Data Table on Diaphragm cell process - Year-over-year growth 2024-2029 (%)
- 9.5 Mercury cell process - Market size and forecast 2024-2029
- Chart on Mercury cell process - Market size and forecast 2024-2029 ($ million)
- Data Table on Mercury cell process - Market size and forecast 2024-2029 ($ million)
- Chart on Mercury cell process - Year-over-year growth 2024-2029 (%)
- Data Table on Mercury cell process - Year-over-year growth 2024-2029 (%)
- 9.6 Market opportunity by Method
- Market opportunity by Method ($ million)
- Data Table on Market opportunity by Method ($ million)
10 Market Segmentation by Grade Type
- 10.1 Market segments
- Chart on Grade Type - Market share 2024-2029 (%)
- Data Table on Grade Type - Market share 2024-2029 (%)
- 10.2 Comparison by Grade Type
- Chart on Comparison by Grade Type
- Data Table on Comparison by Grade Type
- 10.3 Industrial grade - Market size and forecast 2024-2029
- Chart on Industrial grade - Market size and forecast 2024-2029 ($ million)
- Data Table on Industrial grade - Market size and forecast 2024-2029 ($ million)
- Chart on Industrial grade - Year-over-year growth 2024-2029 (%)
- Data Table on Industrial grade - Year-over-year growth 2024-2029 (%)
- 10.4 Food grade - Market size and forecast 2024-2029
- Chart on Food grade - Market size and forecast 2024-2029 ($ million)
- Data Table on Food grade - Market size and forecast 2024-2029 ($ million)
- Chart on Food grade - Year-over-year growth 2024-2029 (%)
- Data Table on Food grade - Year-over-year growth 2024-2029 (%)
- 10.5 Market opportunity by Grade Type
- Market opportunity by Grade Type ($ million)
- Data Table on Market opportunity by Grade Type ($ million)
11 Market Segmentation by Distribution Channel
- 11.1 Market segments
- Chart on Distribution Channel - Market share 2024-2029 (%)
- Data Table on Distribution Channel - Market share 2024-2029 (%)
- 11.2 Comparison by Distribution Channel
- Chart on Comparison by Distribution Channel
- Data Table on Comparison by Distribution Channel
- 11.3 Offline - Market size and forecast 2024-2029
- Chart on Offline - Market size and forecast 2024-2029 ($ million)
- Data Table on Offline - Market size and forecast 2024-2029 ($ million)
- Chart on Offline - Year-over-year growth 2024-2029 (%)
- Data Table on Offline - Year-over-year growth 2024-2029 (%)
- 11.4 Online - Market size and forecast 2024-2029
- Chart on Online - Market size and forecast 2024-2029 ($ million)
- Data Table on Online - Market size and forecast 2024-2029 ($ million)
- Chart on Online - Year-over-year growth 2024-2029 (%)
- Data Table on Online - Year-over-year growth 2024-2029 (%)
- 11.5 Market opportunity by Distribution Channel
- Market opportunity by Distribution Channel ($ million)
- Data Table on Market opportunity by Distribution Channel ($ million)
12 Customer Landscape
- 12.1 Customer landscape overview
- Analysis of price sensitivity, lifecycle, customer purchase basket, adoption rates, and purchase criteria
13 Geographic Landscape
- 13.1 Geographic segmentation
- Chart on Market share By Geographical Landscape 2024-2029 (%)
- Data Table on Market share By Geographical Landscape 2024-2029 (%)
- 13.2 Geographic comparison
- Chart on Geographic comparison
- Data Table on Geographic comparison
- 13.3 APAC - Market size and forecast 2024-2029
- Chart on APAC - Market size and forecast 2024-2029 ($ million)
- Data Table on APAC - Market size and forecast 2024-2029 ($ million)
- Chart on APAC - Year-over-year growth 2024-2029 (%)
- Data Table on APAC - Year-over-year growth 2024-2029 (%)
- 13.4 North America - Market size and forecast 2024-2029
- Chart on North America - Market size and forecast 2024-2029 ($ million)
- Data Table on North America - Market size and forecast 2024-2029 ($ million)
- Chart on North America - Year-over-year growth 2024-2029 (%)
- Data Table on North America - Year-over-year growth 2024-2029 (%)
- 13.5 Europe - Market size and forecast 2024-2029
- Chart on Europe - Market size and forecast 2024-2029 ($ million)
- Data Table on Europe - Market size and forecast 2024-2029 ($ million)
- Chart on Europe - Year-over-year growth 2024-2029 (%)
- Data Table on Europe - Year-over-year growth 2024-2029 (%)
- 13.6 South America - Market size and forecast 2024-2029
- Chart on South America - Market size and forecast 2024-2029 ($ million)
- Data Table on South America - Market size and forecast 2024-2029 ($ million)
- Chart on South America - Year-over-year growth 2024-2029 (%)
- Data Table on South America - Year-over-year growth 2024-2029 (%)
- 13.7 Middle East and Africa - Market size and forecast 2024-2029
- Chart on Middle East and Africa - Market size and forecast 2024-2029 ($ million)
- Data Table on Middle East and Africa - Market size and forecast 2024-2029 ($ million)
- Chart on Middle East and Africa - Year-over-year growth 2024-2029 (%)
- Data Table on Middle East and Africa - Year-over-year growth 2024-2029 (%)
- 13.8 China - Market size and forecast 2024-2029
- Chart on China - Market size and forecast 2024-2029 ($ million)
- Data Table on China - Market size and forecast 2024-2029 ($ million)
- Chart on China - Year-over-year growth 2024-2029 (%)
- Data Table on China - Year-over-year growth 2024-2029 (%)
- 13.9 US - Market size and forecast 2024-2029
- Chart on US - Market size and forecast 2024-2029 ($ million)
- Data Table on US - Market size and forecast 2024-2029 ($ million)
- Chart on US - Year-over-year growth 2024-2029 (%)
- Data Table on US - Year-over-year growth 2024-2029 (%)
- 13.10 India - Market size and forecast 2024-2029
- Chart on India - Market size and forecast 2024-2029 ($ million)
- Data Table on India - Market size and forecast 2024-2029 ($ million)
- Chart on India - Year-over-year growth 2024-2029 (%)
- Data Table on India - Year-over-year growth 2024-2029 (%)
- 13.11 Japan - Market size and forecast 2024-2029
- Chart on Japan - Market size and forecast 2024-2029 ($ million)
- Data Table on Japan - Market size and forecast 2024-2029 ($ million)
- Chart on Japan - Year-over-year growth 2024-2029 (%)
- Data Table on Japan - Year-over-year growth 2024-2029 (%)
- 13.12 Canada - Market size and forecast 2024-2029
- Chart on Canada - Market size and forecast 2024-2029 ($ million)
- Data Table on Canada - Market size and forecast 2024-2029 ($ million)
- Chart on Canada - Year-over-year growth 2024-2029 (%)
- Data Table on Canada - Year-over-year growth 2024-2029 (%)
- 13.13 Germany - Market size and forecast 2024-2029
- Chart on Germany - Market size and forecast 2024-2029 ($ million)
- Data Table on Germany - Market size and forecast 2024-2029 ($ million)
- Chart on Germany - Year-over-year growth 2024-2029 (%)
- Data Table on Germany - Year-over-year growth 2024-2029 (%)
- 13.14 South Korea - Market size and forecast 2024-2029
- Chart on South Korea - Market size and forecast 2024-2029 ($ million)
- Data Table on South Korea - Market size and forecast 2024-2029 ($ million)
- Chart on South Korea - Year-over-year growth 2024-2029 (%)
- Data Table on South Korea - Year-over-year growth 2024-2029 (%)
- 13.15 UK - Market size and forecast 2024-2029
- Chart on UK - Market size and forecast 2024-2029 ($ million)
- Data Table on UK - Market size and forecast 2024-2029 ($ million)
- Chart on UK - Year-over-year growth 2024-2029 (%)
- Data Table on UK - Year-over-year growth 2024-2029 (%)
- 13.16 France - Market size and forecast 2024-2029
- Chart on France - Market size and forecast 2024-2029 ($ million)
- Data Table on France - Market size and forecast 2024-2029 ($ million)
- Chart on France - Year-over-year growth 2024-2029 (%)
- Data Table on France - Year-over-year growth 2024-2029 (%)
- 13.17 Italy - Market size and forecast 2024-2029
- Chart on Italy - Market size and forecast 2024-2029 ($ million)
- Data Table on Italy - Market size and forecast 2024-2029 ($ million)
- Chart on Italy - Year-over-year growth 2024-2029 (%)
- Data Table on Italy - Year-over-year growth 2024-2029 (%)
- 13.18 Market opportunity By Geographical Landscape
- Market opportunity By Geographical Landscape ($ million)
- Data Tables on Market opportunity By Geographical Landscape ($ million)
14 Drivers, Challenges, and Opportunity/Restraints
- 14.1 Market drivers
- 14.2 Market challenges
- 14.3 Impact of drivers and challenges
- Impact of drivers and challenges in 2024 and 2029
- 14.4 Market opportunities/restraints
15 Competitive Landscape
- 15.1 Overview
- 15.2 Competitive Landscape
- Overview on criticality of inputs and factors of differentiation
- 15.3 Landscape disruption
- Overview on factors of disruption
- 15.4 Industry risks
- Impact of key risks on business
16 Competitive Analysis
- 16.1 Companies profiled
- Companies covered
- 16.2 Company ranking index
- Company ranking index
- 16.3 Market positioning of companies
- Matrix on companies position and classification
- 16.4 Aditya Birla Chemicals
- Aditya Birla Chemicals - Overview
- Aditya Birla Chemicals - Product / Service
- Aditya Birla Chemicals - Key offerings
- SWOT
- 16.5 Arkema
- Arkema - Overview
- Arkema - Business segments
- Arkema - Key news
- Arkema - Key offerings
- Arkema - Segment focus
- SWOT
- 16.6 BASF SE
- BASF SE - Overview
- BASF SE - Business segments
- BASF SE - Key news
- BASF SE - Key offerings
- BASF SE - Segment focus
- SWOT
- 16.7 Braskem SA
- Braskem SA - Overview
- Braskem SA - Business segments
- Braskem SA - Key news
- Braskem SA - Key offerings
- Braskem SA - Segment focus
- SWOT
- 16.8 Formosa Plastics Corp.
- Formosa Plastics Corp. - Overview
- Formosa Plastics Corp. - Product / Service
- Formosa Plastics Corp. - Key news
- Formosa Plastics Corp. - Key offerings
- SWOT
- 16.9 Genesis Energy LP
- Genesis Energy LP - Overview
- Genesis Energy LP - Business segments
- Genesis Energy LP - Key offerings
- Genesis Energy LP - Segment focus
- SWOT
- 16.10 Gujarat Alkalies and Chemicals Ltd.
- Gujarat Alkalies and Chemicals Ltd. - Overview
- Gujarat Alkalies and Chemicals Ltd. - Product / Service
- Gujarat Alkalies and Chemicals Ltd. - Key offerings
- SWOT
- 16.11 INEOS Group Holdings S.A.
- INEOS Group Holdings S.A. - Overview
- INEOS Group Holdings S.A. - Product / Service
- INEOS Group Holdings S.A. - Key news
- INEOS Group Holdings S.A. - Key offerings
- SWOT
- 16.12 Occidental Petroleum Corp.
- Occidental Petroleum Corp. - Overview
- Occidental Petroleum Corp. - Business segments
- Occidental Petroleum Corp. - Key news
- Occidental Petroleum Corp. - Key offerings
- Occidental Petroleum Corp. - Segment focus
- SWOT
- 16.13 Olin Corp.
- Olin Corp. - Overview
- Olin Corp. - Business segments
- Olin Corp. - Key news
- Olin Corp. - Key offerings
- Olin Corp. - Segment focus
- SWOT
- 16.14 Shin Etsu Chemical Co. Ltd.
- Shin Etsu Chemical Co. Ltd. - Overview
- Shin Etsu Chemical Co. Ltd. - Business segments
- Shin Etsu Chemical Co. Ltd. - Key offerings
- Shin Etsu Chemical Co. Ltd. - Segment focus
- SWOT
- 16.15 Solvay SA
- Solvay SA - Overview
- Solvay SA - Business segments
- Solvay SA - Key news
- Solvay SA - Key offerings
- Solvay SA - Segment focus
- SWOT
- 16.16 The Dow Chemical Co.
- The Dow Chemical Co. - Overview
- The Dow Chemical Co. - Business segments
- The Dow Chemical Co. - Key news
- The Dow Chemical Co. - Key offerings
- The Dow Chemical Co. - Segment focus
- SWOT
- 16.17 Tosoh Corp.
- Tosoh Corp. - Overview
- Tosoh Corp. - Business segments
- Tosoh Corp. - Key offerings
- Tosoh Corp. - Segment focus
- SWOT
- 16.18 Westlake Corp.
- Westlake Corp. - Overview
- Westlake Corp. - Business segments
- Westlake Corp. - Key offerings
- Westlake Corp. - Segment focus
- SWOT
17 Appendix
- 17.1 Scope of the report
- 17.2 Inclusions and exclusions checklist
- Inclusions checklist
- Exclusions checklist
- 17.3 Currency conversion rates for US$
- Currency conversion rates for US$
- 17.4 Research methodology
- Research methodology
- 17.5 Data procurement
- Information sources
- 17.6 Data validation
- Data validation
- 17.7 Validation techniques employed for market sizing
- Validation techniques employed for market sizing
- 17.8 Data synthesis
- Data synthesis
- 17.9 360 degree market analysis
- 360 degree market analysis
- 17.10 List of abbreviations
- List of abbreviations

