|
|
市場調査レポート
商品コード
1915316
世界のコンタクトセンター市場2026-2030年Global Contact Center Market 2026-2030 |
||||||

|
|||||||
カスタマイズ可能
|
|||||||

| 世界のコンタクトセンター市場2026-2030年 |
|
出版日: 2026年01月19日
発行: TechNavio
ページ情報: 英文 297 Pages
納期: 即納可能
|

概要
世界のコンタクトセンター市場は、2025年から2030年にかけて2,593億米ドル規模に成長し、予測期間中のCAGRは11.1%と予測されております。
本報告書では、世界のコンタクトセンター市場に関する包括的な分析、市場規模と予測、動向、成長要因、課題に加え、約25社のベンダー分析を提供しております。
本レポートは、現在の市場状況、最新の市場動向と促進要因、市場環境全般に関する最新の分析を提供します。市場の成長は、企業の運営コスト削減への注力、効果的な収益創出のためのCRM改善の必要性、コンタクトセンターへのIVR統合によって牽引されています。
本調査は、業界の主要関係者からの情報を含む、一次情報と二次情報の客観的な組み合わせを用いて実施されました。本レポートには、主要企業の分析に加え、包括的な市場規模データ、地域別分析を伴うセグメント、ベンダー情勢が含まれています。レポートには過去データと予測データが記載されています。
| 市場範囲 | |
|---|---|
| 基準年 | 2026年 |
| 終了年 | 2030年 |
| 予測期間 | 2026-2030 |
| 成長モメンタム | 加速 |
| 前年比2026年 | 10% |
| CAGR | 11.1% |
| 増分額 | 2,593億米ドル |
本調査では、今後数年間における世界のコンタクトセンター市場の成長を牽引する主要要因の一つとして、業務効率化のためのチャットボット導入が挙げられます。また、クラウドベースのコンタクトセンターの普及拡大や、カスタマイズされたソリューション提供を目的としたAIのコンタクトセンターへの導入が進むことで、市場において相当な需要が見込まれます。
目次
第1章 エグゼクティブサマリー
第2章 Technavio分析
- 価格・ライフサイクル・顧客購入バスケット・採用率・購入基準の分析
- インプットの重要性と差別化の要因
- 混乱の要因
- 促進要因と課題の影響
第3章 市場情勢
- 市場エコシステム
- 市場の特徴
- バリューチェーン分析
第4章 市場規模
- 市場の定義
- 市場セグメント分析
- 市場規模 2025
- 市場の見通し 2025-2030
第5章 市場規模実績
- 世界のコンタクトセンター市場 2020-2024
- タイプセグメント分析 2020-2024
- 展開セグメント分析 2020-2024
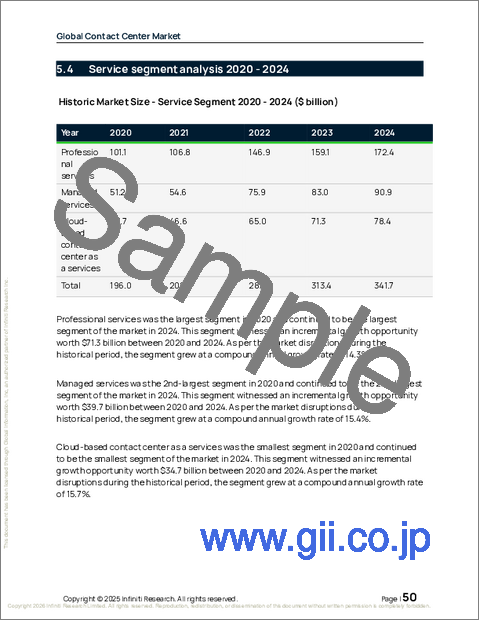
- サービスセグメント分析 2020-2024
- 地域別セグメント分析 2020-2024
- 国別セグメント分析 2020-2024
第6章 定性分析
- AIが世界のコンタクトセンター市場に与える影響世界のコンタクトセンター市場
第7章 ファイブフォース分析
- ファイブフォースの要約
- 買い手の交渉力
- 供給企業の交渉力
- 新規参入業者の脅威
- 代替品の脅威
- 競争の脅威
- 市況
第8章 市場セグメンテーション:タイプ別
- 比較:タイプ別
- 音声ベース
- テキストベース
- ソーシャルメディアベース
- 市場機会:タイプ別
第9章 市場セグメンテーション:展開別
- 比較:展開別
- オンプレミス
- クラウドベース
- 市場機会:展開別
第10章 市場セグメンテーション:サービス別
- 比較:サービス別
- プロフェッショナルサービス
- マネージドサービス
- クラウドベースのコンタクトセンターサービス
- 市場機会:サービス別
第11章 顧客情勢
第12章 地域別情勢
- 地域別セグメンテーション
- 地域別比較
- 北米
- 米国
- カナダ
- メキシコ
- アジア太平洋
- 中国
- インド
- 日本
- フィリピン
- オーストラリア
- インドネシア
- 欧州
- ドイツ
- フランス
- 英国
- スペイン
- オランダ
- イタリア
- 南米
- ブラジル
- アルゼンチン
- コロンビア
- 中東・アフリカ
- 南アフリカ
- アラブ首長国連邦
- サウジアラビア
- エジプト
- ナイジェリア
- 市場機会:地域別
第13章 促進要因・課題・機会
- 市場促進要因
- 市場の課題
- 促進要因と課題の影響
- 市場機会
第14章 競合情勢
- 概要
- 競合情勢
- 混乱の状況
- 業界のリスク
第15章 競合分析
- 企業プロファイル
- 企業ランキング指標
- 企業の市場ポジショニング
- 8x8 Inc.
- ALE International
- Alvaria Inc.
- Amazon.com Inc.
- Ameyo Pvt Ltd.
- Atos SE
- Avaya LLC
- Cisco Systems Inc.
- Enghouse Systems Ltd.
- Five9 Inc.
- Genesys Telecom Lab Inc.
- Google LLC
- Mitel Networks Corp.
- NEC Corp.
- NICE Ltd.
