|
|
市場調査レポート
商品コード
1975429
デジタルコンテンツの世界市場 2026年~2030年Global Digital Content Market 2026-2030 |
||||||
|
|||||||
カスタマイズ可能
|
|||||||

| デジタルコンテンツの世界市場 2026年~2030年 |
|
出版日: 2026年03月09日
発行: TechNavio
ページ情報: 英文 307 Pages
納期: 即納可能
|

概要
世界のデジタルコンテンツ市場は、2025年から2030年にかけて1兆6,526億米ドルの成長が見込まれ、予測期間中のCAGRは19.9%と予測されています。
本報告書では、世界のデジタルコンテンツ市場に関する包括的な分析、市場規模と予測、動向、成長要因、課題に加え、約25社のベンダー分析を提供しております。
本レポートは、現在の市場状況、最新の動向と促進要因、市場環境全般に関する最新の分析を提供します。市場は、各セクターにおけるデジタルトランスフォーメーションの進展、オンラインストリーミングチャネルにおけるサービス更新の増加、発展途上国におけるオンラインコンテンツ消費の拡大によって牽引されています。
本調査は、業界の主要関係者からの情報をはじめとする一次情報と二次情報を客観的に組み合わせて実施されました。本レポートには、主要企業の分析に加え、包括的な市場規模データ、地域別分析を伴うセグメント、ベンダー情勢が含まれています。レポートには過去データと予測データが掲載されています。
| 市場範囲 | |
|---|---|
| 基準年 | 2026年 |
| 終了年 | 2030年 |
| 予測期間 | 2026年~2030年 |
| 成長モメンタム | 加速 |
| 前年比2026年 | 15.8% |
| CAGR | 19.9% |
| 増分額 | 1兆6,526億米ドル |
本調査では、ソーシャルメディアの利用拡大が、今後数年間における世界のデジタルコンテンツ市場成長を牽引する主要な要因の一つであると特定しております。また、コンテンツの多様性の拡大、ならびにモバイルアプリケーションの世界の普及と創出が、市場における相当な需要につながると見込まれます。
目次
第1章 エグゼクティブサマリー
第2章 Technavio分析
- 価格・ライフサイクル・顧客購入バスケット・採用率・購入基準の分析
- インプットの重要性と差別化の要因
- 混乱の要因
- 促進要因と課題の影響
第3章 市場情勢
- 市場エコシステム
- 市場の特徴
- バリューチェーン分析
第4章 市場規模
- 市場の定義
- 市場セグメント分析
- 市場規模、2025年
- 市場の見通し、2025年~2030年
第5章 市場規模実績
- デジタルコンテンツの世界市場、2020年~2024年
- コンテンツタイプセグメント分析、2020年~2024年
- 用途セグメント分析、2020年~2024年
- 展開セグメント分析、2020年~2024年
- 地域別セグメント分析、2020年~2024年
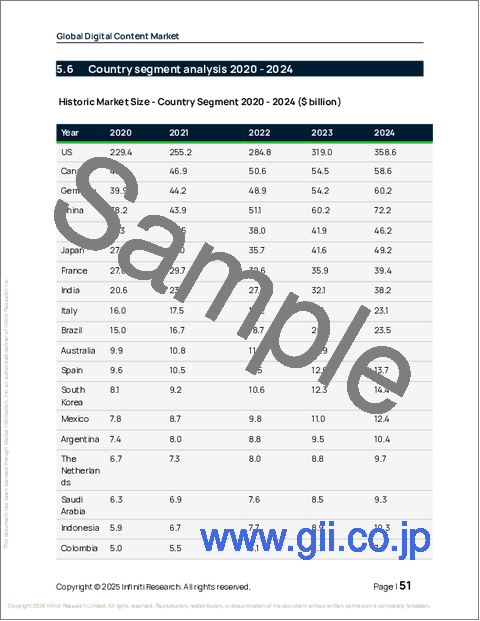
- 国別セグメント分析、2020年~2024年
第6章 定性分析
- AIの影響:世界のデジタルコンテンツ市場
第7章 ファイブフォース分析
- ファイブフォースの要約
- 買い手の交渉力
- 供給企業の交渉力
- 新規参入業者の脅威
- 代替品の脅威
- 競争の脅威
- 市況
第8章 市場セグメンテーション:コンテンツタイプ別
- 比較:コンテンツタイプ別
- デジタル動画コンテンツ
- デジタルゲームコンテンツ
- デジタルテキストコンテンツ
- デジタル音声コンテンツ
- 市場機会:コンテンツタイプ別
第9章 市場セグメンテーション:用途別
- 比較:用途別
- スマートフォン
- コンピューター
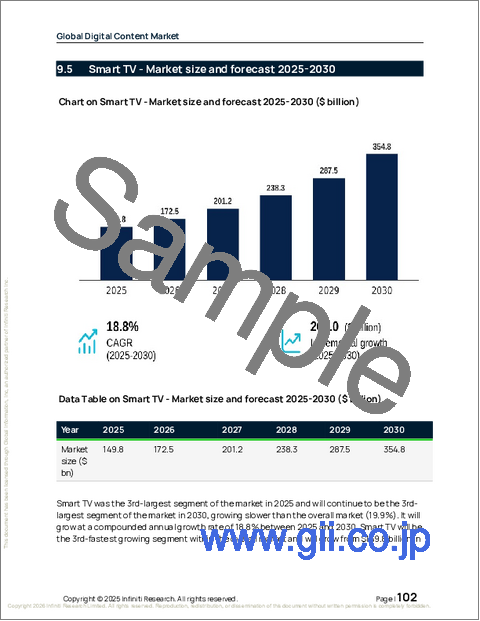
- スマートテレビ
- その他
- 市場機会:用途別
第10章 市場セグメンテーション:展開別
- 比較:展開別
- クラウド
- オンプレミス
- 市場機会:展開別
第11章 顧客情勢
第12章 地域別情勢
- 地域別セグメンテーション
- 地域別比較
- 北米
- 米国
- カナダ
- メキシコ
- 欧州
- ドイツ
- 英国
- フランス
- イタリア
- スペイン
- オランダ
- アジア太平洋
- 中国
- 日本
- インド
- 韓国
- オーストラリア
- インドネシア
- 南米
- ブラジル
- アルゼンチン
- コロンビア
- 中東・アフリカ
- サウジアラビア
- アラブ首長国連邦
- 南アフリカ
- イスラエル
- トルコ
- 市場機会:地域別
第13章 促進要因・課題・機会
- 市場促進要因
- 市場の課題
- 促進要因と課題の影響
- 市場機会
第14章 競合情勢
- 概要
- 競合情勢
- 混乱の状況
- 業界のリスク
第15章 競合分析
- 企業プロファイル
- 企業ランキング指標
- 企業の市場ポジショニング
- Accenture Plc
- Acquia Inc.
- ActiveCampaign LLC
- Adobe Inc.
- Alibaba Group Holding Ltd.
- Amazon.com Inc.
- ByteDance Ltd.
- Dentsu Group Inc.
- Google LLC
- IBM Corp.
- Meta Platforms Inc.
- Microsoft Corp.
- Oracle Corp.
- Salesforce Inc.
- SAP SE
