|
|
市場調査レポート
商品コード
1788422
カーボンナノチューブの世界市場、2025年~2029年Global Carbon Nanotube Market 2025-2029 |
||||||
|
|||||||
カスタマイズ可能
|
|||||||


| カーボンナノチューブの世界市場、2025年~2029年 |
|
出版日: 2025年08月05日
発行: TechNavio
ページ情報: 英文 229 Pages
納期: 即納可能
|

全表示
- 概要
- 図表
- 目次
カーボンナノチューブ市場は2024-2029年に362億5,140万米ドル、予測期間中のCAGRで39.2%の成長が予測されています。
当レポートでは、カーボンナノチューブ市場の全体的な分析、市場規模・予測、動向、成長促進要因、課題、約25のベンダーを網羅したベンダー分析などを掲載しています。
現在の市場シナリオ、最新動向と促進要因、市場環境全体に関する最新分析を提供しています。市場は、半導体部品の微細化、構造補強用途での添加剤としてのカーボンナノチューブの使用、軽量で耐久性のある材料への需要の増加によって牽引されています。
| 市場範囲 | |
|---|---|
| 基準年 | 2025 |
| 終了年 | 2029 |
| 予測期間 | 2025-2029 |
| 成長モメンタム | 加速 |
| 前年比 | 32.8% |
| CAGR | 39.2% |
| 増分額 | 362億5,140万米ドル |
本調査は、業界の主要参加者からのインプットを含め、一次情報と二次情報を客観的に組み合わせて実施しました。本レポートには、主要企業の分析に加え、包括的な市場規模データ、地域分析によるセグメント、ベンダー情勢が含まれています。レポートには過去データと予測データがあります。
本調査では、カーボンナノチューブベースのタッチスクリーンに対する需要の高まりが、今後数年間のカーボンナノチューブ市場成長を牽引する主要な要因の1つであると分析しています。また、シリコントランジスタのカーボンナノチューブへの置き換えや、カーボンナノチューブベースのバンタブラックの開発が、市場の大きな需要につながるでしょう。
目次
第1章 エグゼクティブサマリー
- 市場概要
第2章 Technavio分析
- 価格・ライフサイクル・顧客購入バスケット・採用率・購入基準の分析
- インプットの重要性と差別化の要因
- 混乱の要因
- 促進要因と課題の影響
第3章 市場情勢
- 市場エコシステム
- 市場の特徴
- バリューチェーン分析
第4章 市場規模
- 市場の定義
- 市場セグメント分析
- 市場規模 2024
- 市場の見通し 2024-2029
第5章 市場規模実績
- カーボンナノチューブの世界市場 2019-2023
- 製品別セグメント分析 2019-2023
- アプリケーション別セグメント分析 2019-2023
- 方法別セグメント分析 2019-2023
- 地域別セグメント分析 2019-2023
- 国別セグメント分析 2019-2023
第6章 定性分析
- AIの影響:カーボンナノチューブの世界市場
第7章 ファイブフォース分析
- ファイブフォースの要約
- 買い手の交渉力
- 供給企業の交渉力
- 新規参入業者の脅威
- 代替品の脅威
- 競争の脅威
- 市況
第8章 市場セグメンテーション:製品別
- 市場セグメント
- 比較:製品別
- MWCNT:市場規模と予測 2024-2029
- SWCNT:市場規模と予測 2024-2029
- 市場機会:製品別
第9章 市場セグメンテーション:アプリケーション別
- 市場セグメント
- 比較:アプリケーション別
- CPC:市場規模と予測 2024-2029
- エレクトロニクス:市場規模と予測 2024-2029
- EBC:市場規模と予測 2024-2029
- その他:市場規模と予測 2024-2029
- 市場機会:アプリケーション別
第10章 市場セグメンテーション:方法別
- 市場セグメント
- 比較:方法別
- 化学蒸着:市場規模と予測 2024-2029
- 触媒化学蒸着:市場規模と予測 2024-2029
- 高圧一酸化炭素反応:市場規模と予測 2024-2029
- その他:市場規模と予測 2024-2029
- 市場機会:方法別
第11章 顧客情勢
- 顧客情勢の概要
第12章 地域別情勢
- 地域別セグメンテーション
- 地域別比較
- アジア太平洋:市場規模と予測 2024-2029
- 北米:市場規模と予測 2024-2029
- 欧州:市場規模と予測 2024-2029
- 中東・アフリカ:市場規模と予測 2024-2029
- 南米:市場規模と予測 2024-2029
- 米国:市場規模と予測 2024-2029
- 中国:市場規模と予測 2024-2029
- インド:市場規模と予測 2024-2029
- 日本:市場規模と予測 2024-2029
- 韓国:市場規模と予測 2024-2029
- ドイツ:市場規模と予測 2024-2029
- フランス:市場規模と予測 2024-2029
- オーストラリア:市場規模と予測 2024-2029
- カナダ:市場規模と予測 2024-2029
- 英国:市場規模と予測 2024-2029
- 市場機会:地域情勢別
第13章 促進要因・課題・機会・抑制要因
- 市場促進要因
- 市場の課題
- 促進要因と課題の影響
- 市場の機会・抑制要因
第14章 競合情勢
- 概要
- 競合情勢
- 混乱の状況
- 業界のリスク
第15章 競合分析
- 企業プロファイル
- 企業ランキング指数
- 企業の市場ポジショニング
- Arkema
- Cabot Corp.
- Carbon Solutions Inc.
- CHASM Advanced Materials Inc.
- Continental Carbon Co.
- Hanwha Corp.
- Hyperion Catalysis International Inc.
- Jiangsu Cnano Technology Co. Ltd.
- Klean Industries Inc.
- LG Chem Ltd.
- Nanocyl SA
- Nanoshel LLC
- Raymor Industries Inc.
- Resonac Holdings Corp.
- Toray Industries Inc.
第16章 付録
Exhibits:
- Exhibits1: Executive Summary - Chart on Market Overview
- Exhibits2: Executive Summary - Data Table on Market Overview
- Exhibits3: Executive Summary - Chart on Global Market Characteristics
- Exhibits4: Executive Summary - Chart on Market By Geographical Landscape
- Exhibits5: Executive Summary - Chart on Market Segmentation by Product
- Exhibits6: Executive Summary - Chart on Market Segmentation by Application
- Exhibits7: Executive Summary - Chart on Market Segmentation by Method
- Exhibits8: Executive Summary - Chart on Incremental Growth
- Exhibits9: Executive Summary - Data Table on Incremental Growth
- Exhibits10: Executive Summary - Chart on Company Market Positioning
- Exhibits11: Analysis of price sensitivity, lifecycle, customer purchase basket, adoption rates, and purchase criteria
- Exhibits12: Overview on criticality of inputs and factors of differentiation
- Exhibits13: Overview on factors of disruption
- Exhibits14: Impact of drivers and challenges in 2024 and 2029
- Exhibits15: Parent Market
- Exhibits16: Data Table on - Parent Market
- Exhibits17: Market characteristics analysis
- Exhibits18: Value chain analysis
- Exhibits19: Offerings of companies included in the market definition
- Exhibits20: Market segments
- Exhibits21: Chart on Global - Market size and forecast 2024-2029 ($ million)
- Exhibits22: Data Table on Global - Market size and forecast 2024-2029 ($ million)
- Exhibits23: Chart on Global Market: Year-over-year growth 2024-2029 (%)
- Exhibits24: Data Table on Global Market: Year-over-year growth 2024-2029 (%)
- Exhibits25: Historic Market Size - Data Table on Global Carbon Nanotube Market 2019 - 2023 ($ million)
- Exhibits26: Historic Market Size - Product Segment 2019 - 2023 ($ million)
- Exhibits27: Historic Market Size - Application Segment 2019 - 2023 ($ million)
- Exhibits28: Historic Market Size - Method Segment 2019 - 2023 ($ million)
- Exhibits29: Historic Market Size - Geography Segment 2019 - 2023 ($ million)
- Exhibits30: Historic Market Size - Country Segment 2019 - 2023 ($ million)
- Exhibits31: Five forces analysis - Comparison between 2024 and 2029
- Exhibits32: Bargaining power of buyers - Impact of key factors 2024 and 2029
- Exhibits33: Bargaining power of suppliers - Impact of key factors in 2024 and 2029
- Exhibits34: Threat of new entrants - Impact of key factors in 2024 and 2029
- Exhibits35: Threat of substitutes - Impact of key factors in 2024 and 2029
- Exhibits36: Threat of rivalry - Impact of key factors in 2024 and 2029
- Exhibits37: Chart on Market condition - Five forces 2024 and 2029
- Exhibits38: Chart on Product - Market share 2024-2029 (%)
- Exhibits39: Data Table on Product - Market share 2024-2029 (%)
- Exhibits40: Chart on Comparison by Product
- Exhibits41: Data Table on Comparison by Product
- Exhibits42: Chart on MWCNT - Market size and forecast 2024-2029 ($ million)
- Exhibits43: Data Table on MWCNT - Market size and forecast 2024-2029 ($ million)
- Exhibits44: Chart on MWCNT - Year-over-year growth 2024-2029 (%)
- Exhibits45: Data Table on MWCNT - Year-over-year growth 2024-2029 (%)
- Exhibits46: Chart on SWCNT - Market size and forecast 2024-2029 ($ million)
- Exhibits47: Data Table on SWCNT - Market size and forecast 2024-2029 ($ million)
- Exhibits48: Chart on SWCNT - Year-over-year growth 2024-2029 (%)
- Exhibits49: Data Table on SWCNT - Year-over-year growth 2024-2029 (%)
- Exhibits50: Market opportunity by Product ($ million)
- Exhibits51: Data Table on Market opportunity by Product ($ million)
- Exhibits52: Chart on Application - Market share 2024-2029 (%)
- Exhibits53: Data Table on Application - Market share 2024-2029 (%)
- Exhibits54: Chart on Comparison by Application
- Exhibits55: Data Table on Comparison by Application
- Exhibits56: Chart on CPC - Market size and forecast 2024-2029 ($ million)
- Exhibits57: Data Table on CPC - Market size and forecast 2024-2029 ($ million)
- Exhibits58: Chart on CPC - Year-over-year growth 2024-2029 (%)
- Exhibits59: Data Table on CPC - Year-over-year growth 2024-2029 (%)
- Exhibits60: Chart on Electronics - Market size and forecast 2024-2029 ($ million)
- Exhibits61: Data Table on Electronics - Market size and forecast 2024-2029 ($ million)
- Exhibits62: Chart on Electronics - Year-over-year growth 2024-2029 (%)
- Exhibits63: Data Table on Electronics - Year-over-year growth 2024-2029 (%)
- Exhibits64: Chart on EBC - Market size and forecast 2024-2029 ($ million)
- Exhibits65: Data Table on EBC - Market size and forecast 2024-2029 ($ million)
- Exhibits66: Chart on EBC - Year-over-year growth 2024-2029 (%)
- Exhibits67: Data Table on EBC - Year-over-year growth 2024-2029 (%)
- Exhibits68: Chart on Others - Market size and forecast 2024-2029 ($ million)
- Exhibits69: Data Table on Others - Market size and forecast 2024-2029 ($ million)
- Exhibits70: Chart on Others - Year-over-year growth 2024-2029 (%)
- Exhibits71: Data Table on Others - Year-over-year growth 2024-2029 (%)
- Exhibits72: Market opportunity by Application ($ million)
- Exhibits73: Data Table on Market opportunity by Application ($ million)
- Exhibits74: Chart on Method - Market share 2024-2029 (%)
- Exhibits75: Data Table on Method - Market share 2024-2029 (%)
- Exhibits76: Chart on Comparison by Method
- Exhibits77: Data Table on Comparison by Method
- Exhibits78: Chart on Chemical vapor deposition - Market size and forecast 2024-2029 ($ million)
- Exhibits79: Data Table on Chemical vapor deposition - Market size and forecast 2024-2029 ($ million)
- Exhibits80: Chart on Chemical vapor deposition - Year-over-year growth 2024-2029 (%)
- Exhibits81: Data Table on Chemical vapor deposition - Year-over-year growth 2024-2029 (%)
- Exhibits82: Chart on Catalytic chemical vapor deposition - Market size and forecast 2024-2029 ($ million)
- Exhibits83: Data Table on Catalytic chemical vapor deposition - Market size and forecast 2024-2029 ($ million)
- Exhibits84: Chart on Catalytic chemical vapor deposition - Year-over-year growth 2024-2029 (%)
- Exhibits85: Data Table on Catalytic chemical vapor deposition - Year-over-year growth 2024-2029 (%)
- Exhibits86: Chart on High-pressure carbon monoxide reaction - Market size and forecast 2024-2029 ($ million)
- Exhibits87: Data Table on High-pressure carbon monoxide reaction - Market size and forecast 2024-2029 ($ million)
- Exhibits88: Chart on High-pressure carbon monoxide reaction - Year-over-year growth 2024-2029 (%)
- Exhibits89: Data Table on High-pressure carbon monoxide reaction - Year-over-year growth 2024-2029 (%)
- Exhibits90: Chart on Others - Market size and forecast 2024-2029 ($ million)
- Exhibits91: Data Table on Others - Market size and forecast 2024-2029 ($ million)
- Exhibits92: Chart on Others - Year-over-year growth 2024-2029 (%)
- Exhibits93: Data Table on Others - Year-over-year growth 2024-2029 (%)
- Exhibits94: Market opportunity by Method ($ million)
- Exhibits95: Data Table on Market opportunity by Method ($ million)
- Exhibits96: Analysis of price sensitivity, lifecycle, customer purchase basket, adoption rates, and purchase criteria
- Exhibits97: Chart on Market share By Geographical Landscape 2024-2029 (%)
- Exhibits98: Data Table on Market share By Geographical Landscape 2024-2029 (%)
- Exhibits99: Chart on Geographic comparison
- Exhibits100: Data Table on Geographic comparison
- Exhibits101: Chart on APAC - Market size and forecast 2024-2029 ($ million)
- Exhibits102: Data Table on APAC - Market size and forecast 2024-2029 ($ million)
- Exhibits103: Chart on APAC - Year-over-year growth 2024-2029 (%)
- Exhibits104: Data Table on APAC - Year-over-year growth 2024-2029 (%)
- Exhibits105: Chart on North America - Market size and forecast 2024-2029 ($ million)
- Exhibits106: Data Table on North America - Market size and forecast 2024-2029 ($ million)
- Exhibits107: Chart on North America - Year-over-year growth 2024-2029 (%)
- Exhibits108: Data Table on North America - Year-over-year growth 2024-2029 (%)
- Exhibits109: Chart on Europe - Market size and forecast 2024-2029 ($ million)
- Exhibits110: Data Table on Europe - Market size and forecast 2024-2029 ($ million)
- Exhibits111: Chart on Europe - Year-over-year growth 2024-2029 (%)
- Exhibits112: Data Table on Europe - Year-over-year growth 2024-2029 (%)
- Exhibits113: Chart on Middle East and Africa - Market size and forecast 2024-2029 ($ million)
- Exhibits114: Data Table on Middle East and Africa - Market size and forecast 2024-2029 ($ million)
- Exhibits115: Chart on Middle East and Africa - Year-over-year growth 2024-2029 (%)
- Exhibits116: Data Table on Middle East and Africa - Year-over-year growth 2024-2029 (%)
- Exhibits117: Chart on South America - Market size and forecast 2024-2029 ($ million)
- Exhibits118: Data Table on South America - Market size and forecast 2024-2029 ($ million)
- Exhibits119: Chart on South America - Year-over-year growth 2024-2029 (%)
- Exhibits120: Data Table on South America - Year-over-year growth 2024-2029 (%)
- Exhibits121: Chart on US - Market size and forecast 2024-2029 ($ million)
- Exhibits122: Data Table on US - Market size and forecast 2024-2029 ($ million)
- Exhibits123: Chart on US - Year-over-year growth 2024-2029 (%)
- Exhibits124: Data Table on US - Year-over-year growth 2024-2029 (%)
- Exhibits125: Chart on China - Market size and forecast 2024-2029 ($ million)
- Exhibits126: Data Table on China - Market size and forecast 2024-2029 ($ million)
- Exhibits127: Chart on China - Year-over-year growth 2024-2029 (%)
- Exhibits128: Data Table on China - Year-over-year growth 2024-2029 (%)
- Exhibits129: Chart on India - Market size and forecast 2024-2029 ($ million)
- Exhibits130: Data Table on India - Market size and forecast 2024-2029 ($ million)
- Exhibits131: Chart on India - Year-over-year growth 2024-2029 (%)
- Exhibits132: Data Table on India - Year-over-year growth 2024-2029 (%)
- Exhibits133: Chart on Japan - Market size and forecast 2024-2029 ($ million)
- Exhibits134: Data Table on Japan - Market size and forecast 2024-2029 ($ million)
- Exhibits135: Chart on Japan - Year-over-year growth 2024-2029 (%)
- Exhibits136: Data Table on Japan - Year-over-year growth 2024-2029 (%)
- Exhibits137: Chart on South Korea - Market size and forecast 2024-2029 ($ million)
- Exhibits138: Data Table on South Korea - Market size and forecast 2024-2029 ($ million)
- Exhibits139: Chart on South Korea - Year-over-year growth 2024-2029 (%)
- Exhibits140: Data Table on South Korea - Year-over-year growth 2024-2029 (%)
- Exhibits141: Chart on Germany - Market size and forecast 2024-2029 ($ million)
- Exhibits142: Data Table on Germany - Market size and forecast 2024-2029 ($ million)
- Exhibits143: Chart on Germany - Year-over-year growth 2024-2029 (%)
- Exhibits144: Data Table on Germany - Year-over-year growth 2024-2029 (%)
- Exhibits145: Chart on France - Market size and forecast 2024-2029 ($ million)
- Exhibits146: Data Table on France - Market size and forecast 2024-2029 ($ million)
- Exhibits147: Chart on France - Year-over-year growth 2024-2029 (%)
- Exhibits148: Data Table on France - Year-over-year growth 2024-2029 (%)
- Exhibits149: Chart on Australia - Market size and forecast 2024-2029 ($ million)
- Exhibits150: Data Table on Australia - Market size and forecast 2024-2029 ($ million)
- Exhibits151: Chart on Australia - Year-over-year growth 2024-2029 (%)
- Exhibits152: Data Table on Australia - Year-over-year growth 2024-2029 (%)
- Exhibits153: Chart on Canada - Market size and forecast 2024-2029 ($ million)
- Exhibits154: Data Table on Canada - Market size and forecast 2024-2029 ($ million)
- Exhibits155: Chart on Canada - Year-over-year growth 2024-2029 (%)
- Exhibits156: Data Table on Canada - Year-over-year growth 2024-2029 (%)
- Exhibits157: Chart on UK - Market size and forecast 2024-2029 ($ million)
- Exhibits158: Data Table on UK - Market size and forecast 2024-2029 ($ million)
- Exhibits159: Chart on UK - Year-over-year growth 2024-2029 (%)
- Exhibits160: Data Table on UK - Year-over-year growth 2024-2029 (%)
- Exhibits161: Market opportunity By Geographical Landscape ($ million)
- Exhibits162: Data Tables on Market opportunity By Geographical Landscape ($ million)
- Exhibits163: Impact of drivers and challenges in 2024 and 2029
- Exhibits164: Overview on criticality of inputs and factors of differentiation
- Exhibits165: Overview on factors of disruption
- Exhibits166: Impact of key risks on business
- Exhibits167: Companies covered
- Exhibits168: Company ranking index
- Exhibits169: Matrix on companies position and classification
- Exhibits170: Arkema - Overview
- Exhibits171: Arkema - Business segments
- Exhibits172: Arkema - Key news
- Exhibits173: Arkema - Key offerings
- Exhibits174: Arkema - Segment focus
- Exhibits175: SWOT
- Exhibits176: Cabot Corp. - Overview
- Exhibits177: Cabot Corp. - Business segments
- Exhibits178: Cabot Corp. - Key news
- Exhibits179: Cabot Corp. - Key offerings
- Exhibits180: Cabot Corp. - Segment focus
- Exhibits181: SWOT
- Exhibits182: Carbon Solutions Inc. - Overview
- Exhibits183: Carbon Solutions Inc. - Product / Service
- Exhibits184: Carbon Solutions Inc. - Key offerings
- Exhibits185: SWOT
- Exhibits186: CHASM Advanced Materials Inc. - Overview
- Exhibits187: CHASM Advanced Materials Inc. - Product / Service
- Exhibits188: CHASM Advanced Materials Inc. - Key news
- Exhibits189: CHASM Advanced Materials Inc. - Key offerings
- Exhibits190: SWOT
- Exhibits191: Continental Carbon Co. - Overview
- Exhibits192: Continental Carbon Co. - Product / Service
- Exhibits193: Continental Carbon Co. - Key offerings
- Exhibits194: SWOT
- Exhibits195: Hanwha Corp. - Overview
- Exhibits196: Hanwha Corp. - Product / Service
- Exhibits197: Hanwha Corp. - Key news
- Exhibits198: Hanwha Corp. - Key offerings
- Exhibits199: SWOT
- Exhibits200: Hyperion Catalysis International Inc. - Overview
- Exhibits201: Hyperion Catalysis International Inc. - Product / Service
- Exhibits202: Hyperion Catalysis International Inc. - Key offerings
- Exhibits203: SWOT
- Exhibits204: Jiangsu Cnano Technology Co. Ltd. - Overview
- Exhibits205: Jiangsu Cnano Technology Co. Ltd. - Product / Service
- Exhibits206: Jiangsu Cnano Technology Co. Ltd. - Key offerings
- Exhibits207: SWOT
- Exhibits208: Klean Industries Inc. - Overview
- Exhibits209: Klean Industries Inc. - Product / Service
- Exhibits210: Klean Industries Inc. - Key offerings
- Exhibits211: SWOT
- Exhibits212: LG Chem Ltd. - Overview
- Exhibits213: LG Chem Ltd. - Business segments
- Exhibits214: LG Chem Ltd. - Key news
- Exhibits215: LG Chem Ltd. - Key offerings
- Exhibits216: LG Chem Ltd. - Segment focus
- Exhibits217: SWOT
- Exhibits218: Nanocyl SA - Overview
- Exhibits219: Nanocyl SA - Product / Service
- Exhibits220: Nanocyl SA - Key offerings
- Exhibits221: SWOT
- Exhibits222: Nanoshel LLC - Overview
- Exhibits223: Nanoshel LLC - Product / Service
- Exhibits224: Nanoshel LLC - Key offerings
- Exhibits225: SWOT
- Exhibits226: Raymor Industries Inc. - Overview
- Exhibits227: Raymor Industries Inc. - Product / Service
- Exhibits228: Raymor Industries Inc. - Key offerings
- Exhibits229: SWOT
- Exhibits230: Resonac Holdings Corp. - Overview
- Exhibits231: Resonac Holdings Corp. - Business segments
- Exhibits232: Resonac Holdings Corp. - Key news
- Exhibits233: Resonac Holdings Corp. - Key offerings
- Exhibits234: Resonac Holdings Corp. - Segment focus
- Exhibits235: SWOT
- Exhibits236: Toray Industries Inc. - Overview
- Exhibits237: Toray Industries Inc. - Business segments
- Exhibits238: Toray Industries Inc. - Key news
- Exhibits239: Toray Industries Inc. - Key offerings
- Exhibits240: Toray Industries Inc. - Segment focus
- Exhibits241: SWOT
- Exhibits242: Inclusions checklist
- Exhibits243: Exclusions checklist
- Exhibits244: Currency conversion rates for US$
- Exhibits245: Research methodology
- Exhibits246: Information sources
- Exhibits247: Data validation
- Exhibits248: Validation techniques employed for market sizing
- Exhibits249: Data synthesis
- Exhibits250: 360 degree market analysis
- Exhibits251: List of abbreviations
The carbon nanotube market is forecasted to grow by USD 36,251.4 mn during 2024-2029, accelerating at a CAGR of 39.2% during the forecast period. The report on the carbon nanotube market provides a holistic analysis, market size and forecast, trends, growth drivers, and challenges, as well as vendor analysis covering around 25 vendors.
The report offers an up-to-date analysis regarding the current market scenario, the latest trends and drivers, and the overall market environment. The market is driven by miniaturization of semiconductor components, use of carbon nanotubes as additive in structural reinforcement applications, and increasing demand for lightweight and durable materials.
| Market Scope | |
|---|---|
| Base Year | 2025 |
| End Year | 2029 |
| Series Year | 2025-2029 |
| Growth Momentum | Accelerate |
| YOY 2025 | 32.8% |
| CAGR | 39.2% |
| Incremental Value | $36,251.4 mn |
The study was conducted using an objective combination of primary and secondary information including inputs from key participants in the industry. The report contains a comprehensive market size data, segment with regional analysis and vendor landscape in addition to an analysis of the key companies. Reports have historic and forecast data.
Technavio's carbon nanotube market is segmented as below:
By Product
- MWCNT
- SWCNT
By Application
- CPC
- Electronics
- EBC
- Others
By Method
- Chemical vapor deposition
- Catalytic chemical vapor deposition
- High-pressure carbon monoxide reaction
- Others
By Geographical Landscape
- APAC
- North America
- Europe
- Middle East and Africa
- South America
This study identifies the growing demand for carbon nanotube-based touchscreens as one of the prime reasons driving the carbon nanotube market growth during the next few years. Also, replacement of silicon transistors with carbon nanotubes and development of carbon nanotube-based vantablack will lead to sizable demand in the market.
The report on the carbon nanotube market covers the following areas:
- Carbon Nanotube Market sizing
- Carbon Nanotube Market forecast
- Carbon Nanotube Market industry analysis
The robust vendor analysis is designed to help clients improve their market position, and in line with this, this report provides a detailed analysis of several leading carbon nanotube market vendors that include Arkema, Cabot Corp., Carbon Solutions Inc., CHASM Advanced Materials Inc., Continental Carbon Co., Hanwha Corp., Hyperion Catalysis International Inc., Jiangsu Cnano Technology Co. Ltd., Klean Industries Inc., LG Chem Ltd., Nano C Inc., Nanocyl SA, Nanoshel LLC, NoPo Nanotechnologies India Pvt. Ltd., OCSiAl, Ossila Ltd., Raymor Industries Inc., Resonac Holdings Corp., and Toray Industries Inc.. Also, the carbon nanotube market analysis report includes information on upcoming trends and challenges that will influence market growth. This is to help companies strategize and leverage all forthcoming growth opportunities.
The publisher presents a detailed picture of the market by the way of study, synthesis, and summation of data from multiple sources by an analysis of key parameters such as profit, pricing, competition, and promotions. It presents various market facets by identifying the key industry influencers. The data presented is comprehensive, reliable, and a result of extensive primary and secondary research. The market research reports provide a complete competitive landscape and an in-depth vendor selection methodology and analysis using qualitative and quantitative research to forecast accurate market growth.
Table of Contents
1 Executive Summary
- 1.1 Market overview
- Executive Summary - Chart on Market Overview
- Executive Summary - Data Table on Market Overview
- Executive Summary - Chart on Global Market Characteristics
- Executive Summary - Chart on Market By Geographical Landscape
- Executive Summary - Chart on Market Segmentation by Product
- Executive Summary - Chart on Market Segmentation by Application
- Executive Summary - Chart on Market Segmentation by Method
- Executive Summary - Chart on Incremental Growth
- Executive Summary - Data Table on Incremental Growth
- Executive Summary - Chart on Company Market Positioning
2 Technavio Analysis
- 2.1 Analysis of price sensitivity, lifecycle, customer purchase basket, adoption rates, and purchase criteria
- Analysis of price sensitivity, lifecycle, customer purchase basket, adoption rates, and purchase criteria
- 2.2 Criticality of inputs and Factors of differentiation
- Overview on criticality of inputs and factors of differentiation
- 2.3 Factors of disruption
- Overview on factors of disruption
- 2.4 Impact of drivers and challenges
- Impact of drivers and challenges in 2024 and 2029
3 Market Landscape
- 3.1 Market ecosystem
- Parent Market
- Data Table on - Parent Market
- 3.2 Market characteristics
- Market characteristics analysis
- 3.3 Value chain analysis
- Value chain analysis
4 Market Sizing
- 4.1 Market definition
- Offerings of companies included in the market definition
- 4.2 Market segment analysis
- Market segments
- 4.3 Market size 2024
- 4.4 Market outlook: Forecast for 2024-2029
- Chart on Global - Market size and forecast 2024-2029 ($ million)
- Data Table on Global - Market size and forecast 2024-2029 ($ million)
- Chart on Global Market: Year-over-year growth 2024-2029 (%)
- Data Table on Global Market: Year-over-year growth 2024-2029 (%)
5 Historic Market Size
- 5.1 Global Carbon Nanotube Market 2019 - 2023
- Historic Market Size - Data Table on Global Carbon Nanotube Market 2019 - 2023 ($ million)
- 5.2 Product segment analysis 2019 - 2023
- Historic Market Size - Product Segment 2019 - 2023 ($ million)
- 5.3 Application segment analysis 2019 - 2023
- Historic Market Size - Application Segment 2019 - 2023 ($ million)
- 5.4 Method segment analysis 2019 - 2023
- Historic Market Size - Method Segment 2019 - 2023 ($ million)
- 5.5 Geography segment analysis 2019 - 2023
- Historic Market Size - Geography Segment 2019 - 2023 ($ million)
- 5.6 Country segment analysis 2019 - 2023
- Historic Market Size - Country Segment 2019 - 2023 ($ million)
6 Qualitative Analysis
- 6.1 The AI impact on Global Carbon Nanotube Market
7 Five Forces Analysis
- 7.1 Five forces summary
- Five forces analysis - Comparison between 2024 and 2029
- 7.2 Bargaining power of buyers
- Bargaining power of buyers - Impact of key factors 2024 and 2029
- 7.3 Bargaining power of suppliers
- Bargaining power of suppliers - Impact of key factors in 2024 and 2029
- 7.4 Threat of new entrants
- Threat of new entrants - Impact of key factors in 2024 and 2029
- 7.5 Threat of substitutes
- Threat of substitutes - Impact of key factors in 2024 and 2029
- 7.6 Threat of rivalry
- Threat of rivalry - Impact of key factors in 2024 and 2029
- 7.7 Market condition
- Chart on Market condition - Five forces 2024 and 2029
8 Market Segmentation by Product
- 8.1 Market segments
- Chart on Product - Market share 2024-2029 (%)
- Data Table on Product - Market share 2024-2029 (%)
- 8.2 Comparison by Product
- Chart on Comparison by Product
- Data Table on Comparison by Product
- 8.3 MWCNT - Market size and forecast 2024-2029
- Chart on MWCNT - Market size and forecast 2024-2029 ($ million)
- Data Table on MWCNT - Market size and forecast 2024-2029 ($ million)
- Chart on MWCNT - Year-over-year growth 2024-2029 (%)
- Data Table on MWCNT - Year-over-year growth 2024-2029 (%)
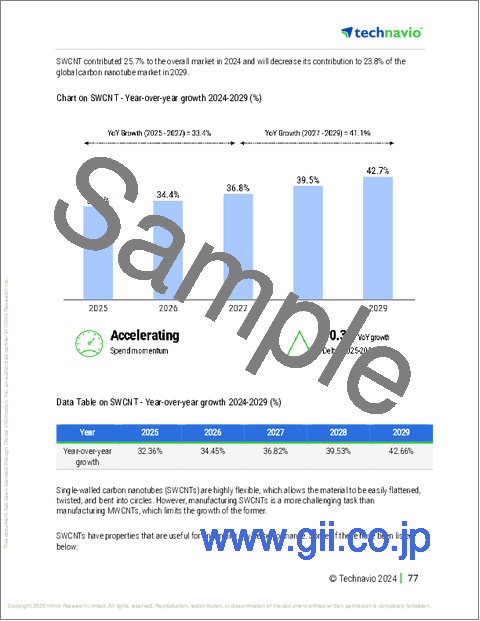
- 8.4 SWCNT - Market size and forecast 2024-2029
- Chart on SWCNT - Market size and forecast 2024-2029 ($ million)
- Data Table on SWCNT - Market size and forecast 2024-2029 ($ million)
- Chart on SWCNT - Year-over-year growth 2024-2029 (%)
- Data Table on SWCNT - Year-over-year growth 2024-2029 (%)
- 8.5 Market opportunity by Product
- Market opportunity by Product ($ million)
- Data Table on Market opportunity by Product ($ million)
9 Market Segmentation by Application
- 9.1 Market segments
- Chart on Application - Market share 2024-2029 (%)
- Data Table on Application - Market share 2024-2029 (%)
- 9.2 Comparison by Application
- Chart on Comparison by Application
- Data Table on Comparison by Application
- 9.3 CPC - Market size and forecast 2024-2029
- Chart on CPC - Market size and forecast 2024-2029 ($ million)
- Data Table on CPC - Market size and forecast 2024-2029 ($ million)
- Chart on CPC - Year-over-year growth 2024-2029 (%)
- Data Table on CPC - Year-over-year growth 2024-2029 (%)
- 9.4 Electronics - Market size and forecast 2024-2029
- Chart on Electronics - Market size and forecast 2024-2029 ($ million)
- Data Table on Electronics - Market size and forecast 2024-2029 ($ million)
- Chart on Electronics - Year-over-year growth 2024-2029 (%)
- Data Table on Electronics - Year-over-year growth 2024-2029 (%)
- 9.5 EBC - Market size and forecast 2024-2029
- Chart on EBC - Market size and forecast 2024-2029 ($ million)
- Data Table on EBC - Market size and forecast 2024-2029 ($ million)
- Chart on EBC - Year-over-year growth 2024-2029 (%)
- Data Table on EBC - Year-over-year growth 2024-2029 (%)
- 9.6 Others - Market size and forecast 2024-2029
- Chart on Others - Market size and forecast 2024-2029 ($ million)
- Data Table on Others - Market size and forecast 2024-2029 ($ million)
- Chart on Others - Year-over-year growth 2024-2029 (%)
- Data Table on Others - Year-over-year growth 2024-2029 (%)
- 9.7 Market opportunity by Application
- Market opportunity by Application ($ million)
- Data Table on Market opportunity by Application ($ million)
10 Market Segmentation by Method
- 10.1 Market segments
- Chart on Method - Market share 2024-2029 (%)
- Data Table on Method - Market share 2024-2029 (%)
- 10.2 Comparison by Method
- Chart on Comparison by Method
- Data Table on Comparison by Method
- 10.3 Chemical vapor deposition - Market size and forecast 2024-2029
- Chart on Chemical vapor deposition - Market size and forecast 2024-2029 ($ million)
- Data Table on Chemical vapor deposition - Market size and forecast 2024-2029 ($ million)
- Chart on Chemical vapor deposition - Year-over-year growth 2024-2029 (%)
- Data Table on Chemical vapor deposition - Year-over-year growth 2024-2029 (%)
- 10.4 Catalytic chemical vapor deposition - Market size and forecast 2024-2029
- Chart on Catalytic chemical vapor deposition - Market size and forecast 2024-2029 ($ million)
- Data Table on Catalytic chemical vapor deposition - Market size and forecast 2024-2029 ($ million)
- Chart on Catalytic chemical vapor deposition - Year-over-year growth 2024-2029 (%)
- Data Table on Catalytic chemical vapor deposition - Year-over-year growth 2024-2029 (%)
- 10.5 High-pressure carbon monoxide reaction - Market size and forecast 2024-2029
- Chart on High-pressure carbon monoxide reaction - Market size and forecast 2024-2029 ($ million)
- Data Table on High-pressure carbon monoxide reaction - Market size and forecast 2024-2029 ($ million)
- Chart on High-pressure carbon monoxide reaction - Year-over-year growth 2024-2029 (%)
- Data Table on High-pressure carbon monoxide reaction - Year-over-year growth 2024-2029 (%)
- 10.6 Others - Market size and forecast 2024-2029
- Chart on Others - Market size and forecast 2024-2029 ($ million)
- Data Table on Others - Market size and forecast 2024-2029 ($ million)
- Chart on Others - Year-over-year growth 2024-2029 (%)
- Data Table on Others - Year-over-year growth 2024-2029 (%)
- 10.7 Market opportunity by Method
- Market opportunity by Method ($ million)
- Data Table on Market opportunity by Method ($ million)
11 Customer Landscape
- 11.1 Customer landscape overview
- Analysis of price sensitivity, lifecycle, customer purchase basket, adoption rates, and purchase criteria
12 Geographic Landscape
- 12.1 Geographic segmentation
- Chart on Market share By Geographical Landscape 2024-2029 (%)
- Data Table on Market share By Geographical Landscape 2024-2029 (%)
- 12.2 Geographic comparison
- Chart on Geographic comparison
- Data Table on Geographic comparison
- 12.3 APAC - Market size and forecast 2024-2029
- Chart on APAC - Market size and forecast 2024-2029 ($ million)
- Data Table on APAC - Market size and forecast 2024-2029 ($ million)
- Chart on APAC - Year-over-year growth 2024-2029 (%)
- Data Table on APAC - Year-over-year growth 2024-2029 (%)
- 12.4 North America - Market size and forecast 2024-2029
- Chart on North America - Market size and forecast 2024-2029 ($ million)
- Data Table on North America - Market size and forecast 2024-2029 ($ million)
- Chart on North America - Year-over-year growth 2024-2029 (%)
- Data Table on North America - Year-over-year growth 2024-2029 (%)
- 12.5 Europe - Market size and forecast 2024-2029
- Chart on Europe - Market size and forecast 2024-2029 ($ million)
- Data Table on Europe - Market size and forecast 2024-2029 ($ million)
- Chart on Europe - Year-over-year growth 2024-2029 (%)
- Data Table on Europe - Year-over-year growth 2024-2029 (%)
- 12.6 Middle East and Africa - Market size and forecast 2024-2029
- Chart on Middle East and Africa - Market size and forecast 2024-2029 ($ million)
- Data Table on Middle East and Africa - Market size and forecast 2024-2029 ($ million)
- Chart on Middle East and Africa - Year-over-year growth 2024-2029 (%)
- Data Table on Middle East and Africa - Year-over-year growth 2024-2029 (%)
- 12.7 South America - Market size and forecast 2024-2029
- Chart on South America - Market size and forecast 2024-2029 ($ million)
- Data Table on South America - Market size and forecast 2024-2029 ($ million)
- Chart on South America - Year-over-year growth 2024-2029 (%)
- Data Table on South America - Year-over-year growth 2024-2029 (%)
- 12.8 US - Market size and forecast 2024-2029
- Chart on US - Market size and forecast 2024-2029 ($ million)
- Data Table on US - Market size and forecast 2024-2029 ($ million)
- Chart on US - Year-over-year growth 2024-2029 (%)
- Data Table on US - Year-over-year growth 2024-2029 (%)
- 12.9 China - Market size and forecast 2024-2029
- Chart on China - Market size and forecast 2024-2029 ($ million)
- Data Table on China - Market size and forecast 2024-2029 ($ million)
- Chart on China - Year-over-year growth 2024-2029 (%)
- Data Table on China - Year-over-year growth 2024-2029 (%)
- 12.10 India - Market size and forecast 2024-2029
- Chart on India - Market size and forecast 2024-2029 ($ million)
- Data Table on India - Market size and forecast 2024-2029 ($ million)
- Chart on India - Year-over-year growth 2024-2029 (%)
- Data Table on India - Year-over-year growth 2024-2029 (%)
- 12.11 Japan - Market size and forecast 2024-2029
- Chart on Japan - Market size and forecast 2024-2029 ($ million)
- Data Table on Japan - Market size and forecast 2024-2029 ($ million)
- Chart on Japan - Year-over-year growth 2024-2029 (%)
- Data Table on Japan - Year-over-year growth 2024-2029 (%)
- 12.12 South Korea - Market size and forecast 2024-2029
- Chart on South Korea - Market size and forecast 2024-2029 ($ million)
- Data Table on South Korea - Market size and forecast 2024-2029 ($ million)
- Chart on South Korea - Year-over-year growth 2024-2029 (%)
- Data Table on South Korea - Year-over-year growth 2024-2029 (%)
- 12.13 Germany - Market size and forecast 2024-2029
- Chart on Germany - Market size and forecast 2024-2029 ($ million)
- Data Table on Germany - Market size and forecast 2024-2029 ($ million)
- Chart on Germany - Year-over-year growth 2024-2029 (%)
- Data Table on Germany - Year-over-year growth 2024-2029 (%)
- 12.14 France - Market size and forecast 2024-2029
- Chart on France - Market size and forecast 2024-2029 ($ million)
- Data Table on France - Market size and forecast 2024-2029 ($ million)
- Chart on France - Year-over-year growth 2024-2029 (%)
- Data Table on France - Year-over-year growth 2024-2029 (%)
- 12.15 Australia - Market size and forecast 2024-2029
- Chart on Australia - Market size and forecast 2024-2029 ($ million)
- Data Table on Australia - Market size and forecast 2024-2029 ($ million)
- Chart on Australia - Year-over-year growth 2024-2029 (%)
- Data Table on Australia - Year-over-year growth 2024-2029 (%)
- 12.16 Canada - Market size and forecast 2024-2029
- Chart on Canada - Market size and forecast 2024-2029 ($ million)
- Data Table on Canada - Market size and forecast 2024-2029 ($ million)
- Chart on Canada - Year-over-year growth 2024-2029 (%)
- Data Table on Canada - Year-over-year growth 2024-2029 (%)
- 12.17 UK - Market size and forecast 2024-2029
- Chart on UK - Market size and forecast 2024-2029 ($ million)
- Data Table on UK - Market size and forecast 2024-2029 ($ million)
- Chart on UK - Year-over-year growth 2024-2029 (%)
- Data Table on UK - Year-over-year growth 2024-2029 (%)
- 12.18 Market opportunity By Geographical Landscape
- Market opportunity By Geographical Landscape ($ million)
- Data Tables on Market opportunity By Geographical Landscape ($ million)
13 Drivers, Challenges, and Opportunity/Restraints
- 13.1 Market drivers
- 13.2 Market challenges
- 13.3 Impact of drivers and challenges
- Impact of drivers and challenges in 2024 and 2029
- 13.4 Market opportunities/restraints
14 Competitive Landscape
- 14.1 Overview
- 14.2 Competitive Landscape
- Overview on criticality of inputs and factors of differentiation
- 14.3 Landscape disruption
- Overview on factors of disruption
- 14.4 Industry risks
- Impact of key risks on business
15 Competitive Analysis
- 15.1 Companies profiled
- Companies covered
- 15.2 Company ranking index
- Company ranking index
- 15.3 Market positioning of companies
- Matrix on companies position and classification
- 15.4 Arkema
- Arkema - Overview
- Arkema - Business segments
- Arkema - Key news
- Arkema - Key offerings
- Arkema - Segment focus
- SWOT
- 15.5 Cabot Corp.
- Cabot Corp. - Overview
- Cabot Corp. - Business segments
- Cabot Corp. - Key news
- Cabot Corp. - Key offerings
- Cabot Corp. - Segment focus
- SWOT
- 15.6 Carbon Solutions Inc.
- Carbon Solutions Inc. - Overview
- Carbon Solutions Inc. - Product / Service
- Carbon Solutions Inc. - Key offerings
- SWOT
- 15.7 CHASM Advanced Materials Inc.
- CHASM Advanced Materials Inc. - Overview
- CHASM Advanced Materials Inc. - Product / Service
- CHASM Advanced Materials Inc. - Key news
- CHASM Advanced Materials Inc. - Key offerings
- SWOT
- 15.8 Continental Carbon Co.
- Continental Carbon Co. - Overview
- Continental Carbon Co. - Product / Service
- Continental Carbon Co. - Key offerings
- SWOT
- 15.9 Hanwha Corp.
- Hanwha Corp. - Overview
- Hanwha Corp. - Product / Service
- Hanwha Corp. - Key news
- Hanwha Corp. - Key offerings
- SWOT
- 15.10 Hyperion Catalysis International Inc.
- Hyperion Catalysis International Inc. - Overview
- Hyperion Catalysis International Inc. - Product / Service
- Hyperion Catalysis International Inc. - Key offerings
- SWOT
- 15.11 Jiangsu Cnano Technology Co. Ltd.
- Jiangsu Cnano Technology Co. Ltd. - Overview
- Jiangsu Cnano Technology Co. Ltd. - Product / Service
- Jiangsu Cnano Technology Co. Ltd. - Key offerings
- SWOT
- 15.12 Klean Industries Inc.
- Klean Industries Inc. - Overview
- Klean Industries Inc. - Product / Service
- Klean Industries Inc. - Key offerings
- SWOT
- 15.13 LG Chem Ltd.
- LG Chem Ltd. - Overview
- LG Chem Ltd. - Business segments
- LG Chem Ltd. - Key news
- LG Chem Ltd. - Key offerings
- LG Chem Ltd. - Segment focus
- SWOT
- 15.14 Nanocyl SA
- Nanocyl SA - Overview
- Nanocyl SA - Product / Service
- Nanocyl SA - Key offerings
- SWOT
- 15.15 Nanoshel LLC
- Nanoshel LLC - Overview
- Nanoshel LLC - Product / Service
- Nanoshel LLC - Key offerings
- SWOT
- 15.16 Raymor Industries Inc.
- Raymor Industries Inc. - Overview
- Raymor Industries Inc. - Product / Service
- Raymor Industries Inc. - Key offerings
- SWOT
- 15.17 Resonac Holdings Corp.
- Resonac Holdings Corp. - Overview
- Resonac Holdings Corp. - Business segments
- Resonac Holdings Corp. - Key news
- Resonac Holdings Corp. - Key offerings
- Resonac Holdings Corp. - Segment focus
- SWOT
- 15.18 Toray Industries Inc.
- Toray Industries Inc. - Overview
- Toray Industries Inc. - Business segments
- Toray Industries Inc. - Key news
- Toray Industries Inc. - Key offerings
- Toray Industries Inc. - Segment focus
- SWOT
16 Appendix
- 16.1 Scope of the report
- 16.2 Inclusions and exclusions checklist
- Inclusions checklist
- Exclusions checklist
- 16.3 Currency conversion rates for US$
- Currency conversion rates for US$
- 16.4 Research methodology
- Research methodology
- 16.5 Data procurement
- Information sources
- 16.6 Data validation
- Data validation
- 16.7 Validation techniques employed for market sizing
- Validation techniques employed for market sizing
- 16.8 Data synthesis
- Data synthesis
- 16.9 360 degree market analysis
- 360 degree market analysis
- 16.10 List of abbreviations
- List of abbreviations
